

Abstract
An array of single-beam acoustic Doppler profilers has been developed for the high resolution measurement of three-dimensional tidal flow velocities and subsequently tested in an energetic tidal site. This configuration has been developed to increase spatial resolution of velocity measurements in comparison to conventional acoustic Doppler profilers (ADPs) which characteristically use divergent acoustic beams emanating from a single instrument. This is achieved using geometrically convergent acoustic beams creating a sample volume at the focal point of 0.03 m3. Away from the focal point, the array is also able to simultaneously reconstruct three-dimensional velocity components in a profile throughout the water column, and is referred to herein as a convergent-beam acoustic Doppler profiler (C-ADP). Mid-depth profiling is achieved through integration of the sensor platform with the operational commercial-scale Alstom 1 MW DeepGen-IV Tidal Turbine deployed at the European Marine Energy Center, Orkney Isles, UK. This proof-of-concept paper outlines the C-ADP system configuration and comparison to measurements provided by co-installed reference instrumentation.
Comparison of C-ADP to standard divergent ADP (D-ADP) velocity measurements reveals a mean difference of 8 mm s−1, standard deviation of 18 mm s−1, and an order of magnitude reduction in realisable length scale. C-ADP focal point measurements compared to a proximal single-beam reference show peak cross-correlation coefficient of 0.96 over 4.0 s averaging period and a 47% reduction in Doppler noise.
The dual functionality of the C-ADP as a profiling instrument with a high resolution focal point make this configuration a unique and valuable advancement in underwater velocimetry enabling improved quantification of flow turbulence. Since waves are simultaneously measured via profiled velocities, pressure measurements and surface detection, it is expected that derivatives of this system will be a powerful tool in wave-current interaction studies.
Export citation and abstract BibTeX RIS

Content from this work may be used under the terms of the Creative Commons Attribution 3.0 licence. Any further distribution of this work must maintain attribution to the author(s) and the title of the work, journal citation and DOI.
1. Introduction
Improved understanding of the dynamics of tidal currents and oceanic waves and their complex interaction is a prerequisite for an economically viable marine hydrokinetic turbine industry: complex velocity fields drive structural loads which affect device design, reliability and ultimately energy conversion rate. Characterisation of the turbulent flow is limited by existing velocity measurement technology. In these typically heterogeneous flows, velocimetry using divergent-beam acoustic Doppler profilers (D-ADPs) is unable to capture instantaneous three-dimensional velocity information at the necessary spatial scales.
Acoustic Doppler velocimetry techniques, particularly geometrically divergent acoustic beam configurations, are widely used in the field measurement of offshore flow velocities due to the relative ease of configuration and installation, unobtrusive flow measurements, as well as the ability to sample throughout the water column. Acoustic Doppler profilers have been successfully used to characterise the mean flow conditions and energy flux in several tidal channels [1–5]. Conventional ADPs emit acoustic signals from a number of transducers on a single device. While a variety of beam configurations exist, in order to deduce a three-dimensional velocity measurement, these acoustic beams must be transmitted in at least three directions [6]. The beam directions are therefore necessarily divergent, typically at an angle of  –
– from vertical. A conventional D-ADP is shown in figure 1(a). Because the velocity measurement of each beam is calculated from the Doppler shift (resulting from the scattering of sound by suspended particles in the water) the velocity component is measured in the direction of the beam itself.
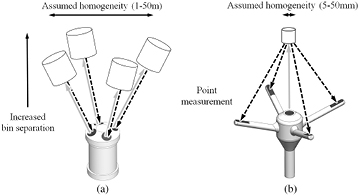
Figure 1. Comparison of beam directions for representative (a) D-ADP and (b) ADV instruments. The grey arrow in the direction of the sample volume represents the transmitted acoustic signal, and the dashed black arrow in the direction of the receiver represents the reflected signal.
Download figure:
Standard image High-resolution imageThe transformation of the velocity components from the beam direction to the instrument coordinate system requires the assumption of flow homogeneity [7]. That is, the velocity vector transformation assumes that the velocities in sample bins at the same distance from the transducer are identical. This is often a reasonable assumption for mean flow velocities, which typically do not vary considerably within the spread of the acoustic beams.
In energetic tidal flows, the instantaneous flow velocity is seen to vary over a wide range of time and length scales. Coherent turbulent structures smaller than the distance separating the divergent beams of D-ADPs at a given elevation are unable to be resolved. Large scale eddies, although greater in scale than these beam separations, are misinterpreted through conventional D-ADP processing algorithms [8, 9]. Furthermore, Doppler noise is an inherent feature of the measurements arising from this technique. By assuming the signal contamination to be white noise, Doppler noise is able to be removed in post-processing of bulk statistics [10, 11], however the use of the instantaneous velocity time series acquired using existing D-ADP configurations is limited.
Acoustic Doppler velocimeters (ADVs), like D-ADPs, also use the Doppler shift of an acoustic signal to determine the beam-wise velocity components of the flow but operate in a convergent beam configuration. A single point is measured, as shown in figure 1(b), as opposed to a pseudo-central point located centrally between divergent beams in the case of a D-ADP. The ADV operates in a bi-static mode, where the receivers are not collocated with the transmitter. Through the convergent beam arrangement, the sample volume of all four beams is coincident and velocity perturbations with significantly reduced length scales can be resolved. Additionally, an ADV takes advantage of its smaller instrument dimensions and distance to the focal point to allow both higher emitted acoustic and sampling frequencies. ADVs (both commercial and bespoke) have been used successfully in a range of laboratory and field applications, including localised velocity measurements [12–16] and sediment transport studies [17, 18].
A significant limitation in ADV technology's applicability in the field of offshore flow measurement is the relative difficulty in installing the instrument at distances from the seabed and other flow-affecting structures. With the sample volume located within 100 mm from the instrument, measuring the flow at a significant distance from a conventional mounting structures is practically reduced. In recent studies, multiple ADVs were mounted on compliant moorings to achieve measurement locations at significant distance from the seabed [19, 20]. The velocity signal is corrected for instrument motion using the simultaneously measured instrument accelerations, with promising results. The measurement of high resolution velocity profiles has been achieved using a number of recent ADV designs [18, 21], however the comparatively low range of these instruments is smaller than that required for this application.
This paper presents an alternative configuration of geometrically convergent acoustic beams, in an effort to combine the desirable properties of the D-ADP and ADV instrument to achieve increased spatio-temporal resolution of velocity measurements within a challenging marine environment. This configuration uses a geometrically convergent array of acoustic Doppler profilers, and is referred to herein as a C-ADP. The focal point of the acoustic beams is theoretically adjustable by the attitude of the acoustic beams as well as the separation distances of the array transducers, overcoming the installation challenges associated with the ADV point measurement technology. A summary of the C-ADP configuration relative to traditional D-ADP and ADV techniques is presented in table 1.
Table 1. Comparisons of acoustic Doppler velocimetry instrument configurations.
| D-ADP | ADV | C-ADP | |
|---|---|---|---|
| Acoustic beam directions | Divergent | Convergent | Convergent |
| Sample volumes | Multiple | Single | Multiple |
| Transmitter-receiver configuration | Mono-static | Bi-static | Either |
| Spatial resolution (m3) | 0.4–20 |  |
0.03 |
| Temporal resolution (Hz) | 2 |
200 | 4 |
aRecently available instruments feature faster sampling rates of up to 16 Hz for specific modes of operation.
Applicability of this C-ADP is demonstrated herein through comparison with existing velocimetry techniques during site characterisation activities conducted in the 3 m s−1 tidal flows of the European Marine Energy Centre (EMEC) tidal test site, Orkney, UK.
2. Instrumentation platform configuration
2.1. Installation
The Edinburgh Subsea Instrument Platform (ESIP-1) was designed by the University of Edinburgh in 2012 as a rugged, modular and removable instrumentation platform for integration with the Alstom DeepGen IV 1MW tidal turbine. Containing multiple oceanographic instruments including up to 12 single-beam acoustic Doppler profilers (s-ADP), ESIP-1 was mounted atop the nacelle of the turbine installed in the Fall of Warness, Orkney, UK at the European Marine Energy Center (EMEC) tidal test site. Throughout 2013 multiple flow measurement campaigns were conducted using non-convergent acoustic Doppler profilers in coordination with tidal turbine commissioning and operation. In June 2013 modifications were carried out to include C-ADP functionality and preliminary tests were conducted. Following the recent completion of primary flow characterisation activities in October 2014, further C-ADP specific tests were conducted. ESIP-1 installation position on the turbine nacelle is shown in figure 2. Instruments were connected to the platform's central computing hub which in turn communicated in real-time with the Internet via the turbine's optical fibre connection to shore. The turbine provided a high power, 24 V dc, uninteruptible power supply (UPS). Hard-wired communications and UPS enabled long data measurement campaigns, on-the-fly configuration of instrumentation and real-time data capture and analysis.
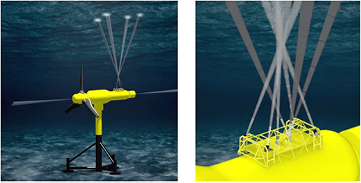
Figure 2. Location of instrument platform mounting on the 1 MW DeepGen IV tidal turbine (turbine model is representative only). The left hand image shows the visualised acoustic beams of the C-ADP on the turbine nacelle as well as ancillary upstream and downstream profiling Doppler instruments. Other instrumentation and instrumentation sub-systems have been removed for clarity. The right hand image shows the convergent acoustic beams of the C-ADP (4 beams), a central upwards facing s-ADP unit (1 beam), and the divergent beams of a D-ADP (3 beam Nortek AWAC) on the instrumentation frame.
Download figure:
Standard image High-resolution imageThe deployment site features 45 m water depth, flows regularly exceeding 3 m s−1 and an energetic wave field, particularly in winter months. The commercial-scale turbine (1 MW rated power, 20 m diameter rotor plane) was developed, installed and is operated as part of the ongoing ReDAPT Project (Reliable Data Acquisition Platform for Tidal); a project commissioned and funded by the Energy Technologies Institute (ETI), UK. In addition to environmental flow field measurement, the focus of this paper, comprehensive turbine performance data sets were produced by the turbine developer and represent an opportunity for future investigation.
2.2. Coordinate system and notation
Being installed on the turbine the coordinate system of the each instrument was defined in terms of the turbine coordinate system, with the x-direction along the turbine axis in the principal flow direction, the y-direction in the cross-flow direction, and the z-direction as upwards to the water surface, as shown in figure 3.

Figure 3. Schematic of acoustic Doppler instrument configurations showing the convergent acoustic beams of the C-ADP, the divergent beams of the D-ADP (AWAC) and the single beam of the vertical s-ADP. The four s-ADP instruments which make up the C-ADP are labeled in a clock-wise sequence from the forward port corner of the instrumentation platform. The pitch angle from vertical,  , is indicated for the aft-facing beam of the D-ADP and the yaw angle,
  , is indicated for
  . (a) Elevation view. (b) Plan view.
Download figure:
Standard image High-resolution imageThe instantaneous Cartesian velocity components aligned with the turbine coordinate system are denoted (u,v,w). The mean velocity components, calculated over a time averaging window of ta, are denoted (U,V,W).
Flow metrics calculated by the C-ADP are compared with the reference instruments introduced in sections 3.1 and 3.2. The error between a flow metric calculated by the C-ADP and a reference instrument is defined by equation (1), where subscript R denotes the reference measurement.

Equivalent expressions for measurement error in other flow metrics are achieved by substition of U in equation (1).
2.3. Measurement locations
The focal point of the C-ADP is located at z = 4 m for the set of experiments presented. In order to make meaningful comparisons at this location, all the acoustic Doppler profiling instruments must have a measurement location available at this point. This is achieved by adjusting the blanking distance and profiling bin size of each instrument [22].
2.4. Instrument timing synchronisation
The convergence of the acoustic beams at the focal point of the C-ADP obscures the reflected signal to each of the respective instruments if the acoustic signals are fired concurrently, referred to herein as synchronous operation. The C-ADP was developed with controllable time offsets for each single-beam instrument, with micro-second accuracy through the use of a timing signal provided by a GPS Grandmaster clock. Instrument offset times were varied and the resulting influence on the measurements (signal return amplitude and velocity) were observed in mono-static mode. In this mode, each instrument operates independently to receive the reflected acoustic signal that was transmitted from itself.
Bi-static sampling is available by using the vertically orientated s-ADP as the transmitter and the C-ADP (comprising four convergent s-ADP instruments) as receivers. Bi-static modes of operation involving a large test-matrix of configuration settings were also tested. Analysis is ongoing and results are not presented in this paper.
3. Instrumentation
3.1. Single-beam acoustic Doppler profilers
The C-ADP comprises four single-beam Doppler instruments developed around an early variant of the Nortek AS AD2CP platform (recently released commercially) which allows a high level of online user configuration over TCP/IP. These early-release models were progressively upgraded with firmware, software and hardware updates as they became available by the manufacturer.
In the construction of the C-ADP, four s-ADPs were installed at the corners of the ESIP-1, all angled towards a point directly above the center of the platform. This was achieved by yawing each instrument by a target angle of  from the x–z plane. The alignment of the diagonally paired instruments were verified visually by aligning consumer-grade laser pointers mounted on removable instrument alignment brackets. The authors have successfully operated s-ADPs onboard the ESIP-1 using remotely controlled actuators with pan and tilt motion capabilities. The results presented herein, however, are for beam angles pitched at constant angle,
  from vertical. Angles reported represent design angles. Geometric errors are expected to arise from installation and operation in the harsh marine environment.
An s-ADP is installed on the frame with the instrument axis aligned in the positive z-direction (upwards). This instrument is used as a relatively high resolution reference instrument (when compared to traditional divergent-beam profilers) for comparing with the w-velocity component measured by the C-ADP. A lateral offset from the instrument platform center by  mm was necessary in order to avoid interference with a central structural component of the ESIP-1 (figure 3(a)).
3.2. Divergent-beam acoustic Doppler profilers
A divergent-beam acoustic Doppler profiler (D-ADP) was also installed on the instrumentation platform. This device was a 1 MHz Nortek AWAC instrument which uses three acoustic beams to calculate the velocity profile from the platform to the water surface. The D-ADP was orientated to minimise acoustic interaction of the three primary beams—neglecting side-lobes—with those of the C-ADP or vertical s-ADP, as shown in figure 3. The properties of the acoustic instruments installed on the instrumentation platform are summarised in table 2.
Table 2. Instrument properties.
| D-ADP (Nortek AWAC) | s-ADP (Nortek AD2CP) | |
|---|---|---|
| Beam configuration | Divergent (D-ADP) | Single (s-ADP) |
| Range |
35 | 20 |
| Max. sample frequency (Hz) | 1 | 4 |
| Pulse frequency (MHz) | 1 | 1 |
| No. of operating beams | 3 | 1 |
| Pulse type | Narrow-band | Broad-band |
| Bin length (m) | 1.0 | 0.5 |
| Beam spread angle |
1.7 | 1.45 |
aDependant on configuration. bAngle from cone wall to beam axis.
A sample time series of stream-wise velocity measurements is shown in figure 4(a) for three tidal cycles. The mean velocity measured by the D-ADP is shown with a line, with the corresponding mean velocity measurement of the C-ADP shown with a circular marker. Sample rates for the C-ADP and D-ADP were 2 Hz and 1 Hz respectively at an ensemble averaging period of 5 min.

Figure 4. Comparison of C-ADP and D-ADP (AWAC) mean velocity time series and sample volume separation. (a) Time series of stream-wise velocity and error velocity (equation (1)) for a single tidal cycle at the focal point of z = 4.0 m. (b) Mean horizontal distance from the sample volume to the instrument axis of C-ADP and AWAC.
Download figure:
Standard image High-resolution imageThe mean horizontal distance from the sample volume to the instrument axis, hSV, is shown for the C-ADP and D-ADP in figure 4(b). In conjunction with figure 2, this demonstrates the significant improvement in spatial resolution which is achieved by the C-ADP, relative to existing divergent acoustic Doppler profilers. The single vertical s-ADP, whilst providing the highest spatial resolution velocity profile, is restricted to measurement of an individual vertical velocity component, w.
4. Methodology
4.1. Test schedule and operational conditions
C-ADP testing was conducted on an opportunity basis as a subset of an extensive site characterisation test programme during 2013–2014. C-ADP triggering tests were routinely conducted during turbine operation where the assessment of relative changes in performance is sufficient. Ambient flow conditions were measured wherever possible by conducting tests during periods of turbine non-operation or through scheduled changes to the turbine orientation relative to the tidal flow, positioning the blades downstream of the ESIP-1.
4.2. Instrument configuration
The maximum profile range of the sensor array is determined by the individual s-ADP power settings which were optimised for analysing agreement at the focal point. Instrument configuration can be adapted through bin size, blanking distance, timing offset and instrument power in order to measure the specific flow property and location under investigation. For example, when sea surface elevation is the required measurement parameter, power can be increased to each of the s-ADP instruments ensuring an adequate profiling range. In the following experiments the bin size was set to 1.0 m for the D-ADP and 0.5 m for the C-ADP and s-ADP.
4.3. C-ADP beam-to-instrument coordinate transformation
The ADP instruments return the component of velocity aligned with the direction of the beam axis. This beam-wise velocity for instrument i is denoted bi and defined as positive for flow directions away from the transducer. The numbering convention used for the C-ADP instruments is shown by the circled labels in figure 3(b).
Expressing the velocity component in the direction from  to
to  as
as  , and the velocity component in the direction from
  to
to  as
as  , the components of the Cartesian velocity captured by the Doppler shift in each beam is given by equation (2). This formulation is a modification of that presented for a D-ADP in [23].


As with the D-ADP, it is necessary to assume homogeneity of the flow between the measurement locations of the sample bins such that (ui,vi,wi) = (u,v,w). This assumption is valid at the focal point of the C-ADP even for instantaneous velocity measurements, as the sample bins are co-located. The three unknown Cartesian velocity components can be solved from the four sub-equations of equation (2) as shown in equation (3).


The vector transformation matrix from the four acoustic beam directions to the C-ADP instrument coordinate system in matrix form is therefore given by equation (4).
The geometric scaling factors of equation (4) are  ,
,  and
and  . For the experiments presented herein, the fixed angles of
  and
and  are used as described in section 3.1.
4.4. Velocimetry
Tests were conducted to allow an assessment of the C-ADPs performance relative to an industry-standard D-ADP and to the high resolution s-ADP.
4.4.1. C-ADP versus D-ADP.
Mean velocity measured by the C-ADP was compared with that of the D-ADP for the three Cartesian velocity directions. The mean velocity was calculated using a moving average with a period of ta = 300 s.
The C-ADP and D-ADP velocity profiles were binned by the mean velocity of the D-ADP at each depth to observe the deviation from the reference instrument as a function of flow speed.
4.4.2. C-ADP versus vertically orientated s-ADP.
Preliminary experimentation indicated the timing of the s-ADP acoustic signals to be a critical function of C-ADP operation. Initial tests using synchronous single beam sampling times resulted in the C-ADP significantly underestimating the mean velocity and showing a local increase in s-ADP signal amplitude at the measurement bin corresponding to the focal point.
The sample volume of the s-ADP measurement bin is smaller than that of the focal point of the four converged bins of the C-ADP. As such, greater spatial averaging is expected from the convergent-beam instrument. This effect is a function of measurement elevation as shown in figure 4(b) and is a minimum at the focal point.
5. Results
The standard deviation of the velocity error is shown in figure 5(a). Asynchronous sampling by a time offset of  was used between all instruments in subsequent tests, where d is the beam length from the instrument to the water surface and c is the speed of sound in seawater. A comparison of synchronous and asynchronous measurements of eU as a function of depth around the focal point are presented in figure 5(a). In this plot the amplitude of the reflected signal is normalised by the amplitude of the first sample bin.
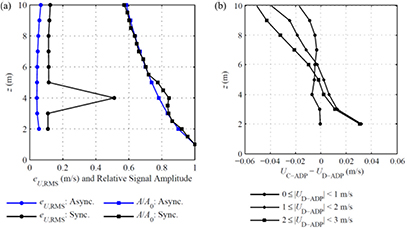
Figure 5. Depth profiles of measurement comparisons. Signal interference is indicated by the local spike at the focal point elevation of z = 4 m in the synchronous case. (a) Standard deviation of velocity error and relative signal amplitude for synchronous and asynchronous sampling regimes. (b) Mean velocity comparison for range of mean flow speeds.
Download figure:
Standard image High-resolution image5.1. C-ADP versus D-ADP
The stream-wise velocity was divided into velocity bins of 1.0 m s−1 over the mean velocity range of 0–3 m s−1, and the error velocity is shown in figure 5(b). The C-ADP agrees well with the reference velocity in the region of the focal point, with error magnitudes increasing above and below this location. The maximum absolute error within the 10 m profile shown is 0.05 m s−1 at flow speeds in the range of 2–3 m s−1.
At distances of z > 4 m, the C-ADP acts in the same way as a divergent-beam ADP, as shown in figure 4(b), enabling the quantification of bulk flow velocities. The agreement between the mean flow velocities calculated using the C-ADP and D-ADP indicates that the mean velocity field is relatively homogeneous over the averaging period of ta = 300 s at the turbine test site.
While close agreement is shown between the C-ADP and the D-ADP over the depth profile range of  m, the velocity at the focal point of z = 4 m is of particular interest, as the location of maximum spatial resolution of the convergent-beam instrument. At this location the mean velocity components measured by the C-ADP exhibit close agreement with those of the divergent-beam reference instrument. This is shown by figure 6, where the mean velocity component measured by the C-ADP is plotted against that of the D-ADP at the focal point elevation. These results show 36 h of 5 min mean velocity with the turbine aligned with the flow direction.
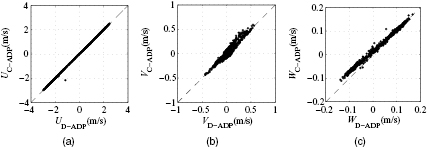
Figure 6. Comparison of 662 mean Cartesian velocity measurements, comparing velocity components of the C-ADP and reference D-ADP instrument at z = 4 m.
Download figure:
Standard image High-resolution image5.2. C-ADP versus vertically orientated s-ADP
The vertical velocity component measured by the C-ADP was compared against the centrally located reference vertical single beam instrument. The instrument profiling configuration was designed to provide a reference velocity for every sample elevation of the C-ADP. While only the single velocity component of w was able to be compared, this presented a unique verification of the C-ADP measurement quality against an instrument at a relatively high spatial and temporal resolution. Such spatial resolution is not possible using a D-ADP due to the inherent divergent geometry of the acoustic beams. The results presented in this section were recorded at an increased sample frequency of 4 Hz enabled via upgrades to instrument firmware.
5.2.1. Instrument noise.
The coordinate transform of the C-ADP for w combines the four acoustic beam velocity in a way that averages the signals. The averaging process reduces the standard deviation of white Doppler noise in the beam-wise velocity by a factor  , where N is the number of signals averaged at each time step. As such, the signal to noise ratio from the C-ADP instrument is greater than the single-beam reference instrument. This effect is relatively independent of measurement elevation within the operating range of the instrument.
Accounting for the attitude of the individual s-ADPs, the standard deviation of the C-ADP signal is reduced by a factor of  through the coordinate transform described in section 4.3. For the four-beam array (N = 4) with
  , this corresponds to a 47% reduction in Doppler noise relative to the single vertical s-ADP instrument.
A spectral analysis using a fast Fourier transform shows the power of the fluctuating vertical velocity component of the C-ADP and s-ADP at each frequency level, shown in figure 7. This data set was acquired during a period of wave activity and mean flow speeds in the range 0.75–1.25 m s−1 at a sample rate of 4 Hz. The significant wave height at the site during this period was calculated using wave spectra from the deployment site as Hm0 = 2.2 m. The spectra presented in figure 7 represents the mean power spectral density from 93 Hanning-windowed, stationary time series of 1024 points with 50% overlap.
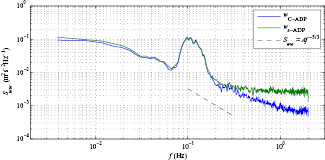
Figure 7. Power spectral density of vertical velocity component measured by C-ADP and s-ADP during tidal cycle with significant wave height of Hm0 = 2.2 m. The gradient of −5/3 is included to identify the classical energy cascade of turbulence.
Download figure:
Standard image High-resolution imageThe presence of large waves at the test site is indicated by the energy concentration in the frequency range of 0.07–0.17 Hz. The spectra of the vertical velocity measured using the CADP follows the theoretical cascade of energy predicted by classical theories at a rate of f −5/3 [24] in the frequency range of 0.2 < f < 2 Hz [25]. The Doppler noise floor of the s-ADP instrument is indicated by the region of zero gradient at frequencies greater than approximately 0.3 Hz.
5.2.2. Cross-correlation of vertical velocity.
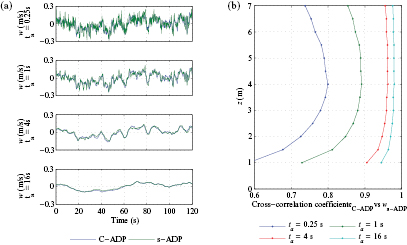
Cross-correlation can be used as a measure of the similarity between two signals. In this case, the maximum cross-correlation coefficient of the vertical velocity measured by the s-ADP and C-ADP is calculated to indicate the comparability of two instrument measurements with varying durations of temporal averaging [26]. The results are presented in figure 8. An averaging period of ta = 0.25 s corresponds to the raw 4 Hz data.
Figure 8. Cross-correlation of vertical velocity signals between the C-ADP and vertical s-ADP showing depth and averaging periods effects. (a) Representative time series at z = 4 m for range of averaging periods. (b) Depth profile of cross-correlation coefficients for range of averaging periods.
Download figure:
Standard image High-resolution image
Again, a peak in the maximum cross-correlation coefficient was observed near the focal point of the convergent beam system (z = 4 m). The beam separation of the C-ADP increases with distance from this focal point and the correlation is seen to decrease as a result. The width of the correlation peak increases with averaging period, as the magnitude of flow perturbations with length scales less than the beam separation are reduced. The peak cross-correlation of 0.8 is calculated at the focal point using the raw 4 Hz data, which increases to 0.96 when a moving average of ta = 4 s is applied.
This result further demonstrates the ability of the C-ADP to resolve velocity perturbations with a relatively high spatial and temporal resolution. The results at the focal point are evidence of the importance of using an instrument with a reduced spatial resolution, compared to existing divergent beam configurations, when high-frequency velocity measurements are required.
6. Conclusions
A novel sensor array of convergent acoustic Doppler velocity profilers has been shown to improve the spatial and temporal resolution of underwater velocimetry for use in the marine energy sector. The ability to function as a profiling instrument with a high resolution focal point make this C-ADP configuration a unique advancement in underwater velocimetry. The scope of use expands on the already broad application of existing ADPs, with the added ability to sample non-homogeneous flow velocities at a point of interest. This is of particular utility in energetic and turbulent flow conditions and has applications in the wake region of underwater installations such as marine energy converters.
The convergent-beam acoustic Doppler profiler (C-ADP) has been validated through a series of comparative experiments with reference instrumentation including a divergent-beam ADP and a vertical acoustic Doppler profiler. A cross-correlation coefficient of 0.80 was calculated for the raw vertical velocity component and cross-correlation of 0.96 in frequency ranges relevant to wave analyses in a direct comparison with a vertically orientated instrument. A peak in measurement agreement was observed at the focal point of z = 4 m for this comparison.
The asynchronous timing control of each profiling instrument was found to be critical to avoid acoustic signal interference at the focal point when the array was operated in mono-static sampling mode. Further optimisation of both mono-static and bi-static modes of operation are currently being undertaken in addition to the analysis of higher order flow metrics and an assessment of the impact of highly energetic wave conditions resulting from recent storms.
Acknowledgments
The ReDAPT project was commissioned and funded by the Energy Technologies Institute (ETI), UK. The data analysis was performed in collaboration with the Pacific Northwest National Laboratory (PNNL), with funding provided by the U.S. Department of Energy, Energy Efficiency and Renewable Energy, Wind and Water Power Program (Contract No. DE-AC06-76RLO 1830). The authors wish to thank Duncan Sutherland, University of Edinburgh, for his assistance in the laboratory and the field. The authors are grateful for the assistance of the Alstom Ocean Energy team throughout the wider 2012–2014 field campaigns and lastly wish to thank the University of Edinburgh's mechanical engineering workshop staff who provided significant levels of timely support.