

Abstract
A small-form-factor holographic optical element (HOE) module, which was mounted on a dual-stage seesaw actuator, was utilized to evaluate blood coagulation in real time. The method involved assessing the decrease in transmitted light of the blood sample surface when the clotting is formed. The prothrombin time (PT) was measured by illumining and focusing a 635 nm laser beam onto the sample. As the fibrinogen turned into non-solute fibrin, the transmitted efficiency and total intensity of the reflected light from the reflector changed. A low-pass filter suppressed the noise in the coagulation-related transient response to yield accurate signals. Finally, the PT measurements were compared to those made classically using other optical sensors.
Export citation and abstract BibTeX RIS
A correction was made to this article on 2 June 2014. The name of the fourth author was corrected.
1. Introduction
Blood coagulation is an important effect associated with the circulatory system that stops bleeding when a blood vessel is damaged. Many cardiovascular diseases affect coagulation characteristics, including thrombus, atrial fibrillation and coronary artery disease. Therefore, the blood coagulation analyzer has become an important and widely used instrument in medical centers and hospitals [1]. The most important factor in coagulation dynamics is the prothrombin time (PT), which can be determined through chemical, optical, mechanical, electrical or physical properties. However, the coagulation mechanism is a complex series of cascading enzymatic processes, so classical analysis methods take a long time and much greater volume of a blood sample [2].
Greco applied reflectance spectroscopy to determine the PT by the transformation of relative reflectance during blood clotting [3]. Besides, Castillo et al used diffuse reflectance sensor, optical fibers and 880 nm near-infrared radiation (NIR), to monitor goat's milk coagulation time [4]. Chang et al and Cheng et al both found the difference of resonance frequency between clotting/unclotting blood samples on a piezoelectric quartz crystal sensor [5, 6]. Other physical methods are based on different types of ultrasound method, such as normal shear wave [7, 8], air-couple [9], and pulse reflection technique [10] to determine the time period when the viscosity of blood changes in the coagulation process. Recently, numerous developed methods for detecting the coagulation applied optical methods. In some studies, multiple scattering analyses (MSA) that involve measuring the intensity of laser light through a blood sample chip using a charge-coupled device (CCD) camera have been used. As the blood clots, the intensity of the scattered light decreases and the duration of the coagulation process can thus be calculated [11–14]. Other works have presented speckle fluctuation measurement to investigate the dynamics of coagulation in real time [15]. This methodology has been compared to viscosity-based detection systems. Another well-known method involves surface plasma resonance (SPR) [16–20]. It uses an electromagnetic field material that is composed of two layers: metal and dielectric. A micro-fluidic tunnel is in contact with a membrane in a detection chip. The blood coagulation changes the resonant frequency of the membrane. The frequency variation can be utilized to plot the clotting of the blood as a function of the clotting time. However, all of these methods have a long preparation period.
This investigation presents a small-form-factor (SFF) optical module on a dual-stage actuator to monitor blood coagulation by measuring the intensity of a reflected laser beam [21]. The intensity of the light that is received varies when laser light is transmitted through a whole blood or plasma sample. This effect provides a non-contact, label-free bio-detection method with a shorter preparation time than other traditional methods.
1.1. Blood coagulation cascade
As displayed in figure 1, blood coagulation is a 'cascade reaction', which has three pathways: intrinsic, extrinsic and common [22]. It involves 12 factors, factors I to XIII with no factor XI. The intrinsic pathway begins when the surface of the vessel is damaged and generates factors IXa-PF3-IV-VIII. The extrinsic pathway is triggered in body tissue that can change into factors VII-III. These two chemical compound products of the two pathways can activate the common pathway to form Xa. After many steps, all of these factors are activated. Factor II, prothrombin, becomes thrombin, causing the fibrinogen to become non-soluble fibrin. Finally, the blood clots and the coagulation reaction is complete.
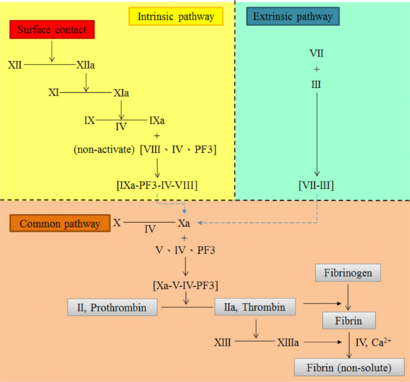
Figure 1. Blood coagulation cascade.
Download figure:
Standard image High-resolution image1.2. Clotting time and prothrombin time
In the coagulation measurement, the clotting time (CT) is the entire time taken for the human blood to coagulate. It is also called 'whole blood clotting time'. As mentioned in section 1.1, two coagulation pathways will lead to clotting of human blood. Hence, these two pathways will result in two different durations, the activated partial thromboplastin time (aPTT) and PT. Both of them generally belong to the CT. The aPTT is defined as the reaction time when the coagulation cascade operated from the intrinsic path to the common path. This global screening process is primarily used to evaluate aberrations in the enzymes and cofactors of the intrinsic coagulation pathway necessary for the prothrombin activation.
The PT is defined as the time required for citrated plasma to clot in the presence of tissue thromboplastin and calcium chloride [23]. It is also the reaction time when the coagulation cascade starts from the extrinsic path to the common path. When blood is drawn from a donor, it is immediately mixed with sodium citrate, which binds to the calcium of whole blood to prevent coagulation and thereby enable transport to the laboratory and preparation of the sample (by centrifugation). In other words, PT is used in two applications: (a) screening for single or combined clotting factor deficiencies in the extrinsic coagulation cascade, indicating hereditary coagulation disorders, liver disease, or vitamin K deficiency; (b) monitoring oral anticoagulant drug therapy.
2. Materials and methods
2.1. Thrombin and plasma
Standard thrombin and plasma were purchased from the Siemens Company. Dade® Innovin® is a commercial mix of powder that is combined with synthetic phospholipids (thromboplastin), calcium, buffers and stabilizers. This reagent is used to initiate clotting via the extrinsic to common pathways in the fibrinogen of blood. Dade® Ci-Trol® is used as the control plasma in a normal coagulation cascade. It is produced from pooled, fresh citrated normal human plasma. Both of these substances are used in adjusting the coagulation equipment. Deionized water is added to both in volumes of 4 mL and 10 mL, respectively. The two solutions thus formed are maintained at 37 °C before any experiment is begun. In our research, we choose Dade® Innovin® to activate the extrinsic pathway, and measure the PT of the blood sample or plasma.
2.2. Experimental setup and specifications
Figure 2 presents the proposed detection devices, which combine a dual-stage actuator with a SFF holographic optical element (HOE) optical module [24]. The optical module is mounted on the PCB (top). The test sample is on the tip of the seesaw arm actuator, which is fixed below the pickup head (bottom). The mixed plasma sample is placed on the double-layer chip (glass and reflector), which is fixed to the PZT bender.

Figure 2. Experimental setup. (a) Schematic of the measurement setup, where the sample is placed on the tip of actuator with a glass chip and reflector. (b) The HOE scheme with the SiO2 pattern. (c) Real image of the SFF HOE optical module.
Download figure:
Standard image High-resolution imageTo induce clotting, 20 µL of Innovin was added to 10 µL of Ci-Trol that had been pre-heated to 37 °C. Figure 2(a) also shows the experimental setup. The function generator provides two different sinusoidal voltage inputs (5 Hz and 6 V) with a 180° phase shift across the seesaw arm and the PZT bender to actuate the dual-stage. The laser source and detector are located on the substrate of the module. When the 635 nm laser diode is triggered, the beam is reflected by two 45° prisms and transmitted through a HOE.
Basically, for achieving low sample volume, the optical module setup is an excellent solution to the problem. But the traditional optical head employs too many optical devices, such as collimating lens, beam splitter, diffraction grating, etc. The HOE is a kind of diffrential optical element that can reduce the number of components and shorten the optical path. Figure 2(b) shows the HOE silicon substrate. The substrate (3 × 5 mm2) covered with SiO2 is etched and transformed to the parallel stripe pattern. The diffractive pattern is designed and calculated by the binary wave-front method. Once the laser passed through the diffractive pattern of HOE, the 0th-order, +1st-order, and −1st-order beams are generated. 40% of the incident light power remained in the 0th-order beam, and 10% of the incident light diffracted into each +1st and −1st diffracted order beam. The sample is transmitted under 0th-order light and the double-transmitting beam (+1st-order light) falls on a quadrant Si pin photodetector (PD) after it has been diffracted by the HOE. Finally, the focusing motion of the dual-stage actuator changes the dimensions of the spot on the PD and the output raw signals. The temporal variation of light intensity, Ī(t), on the PD (A0(t), B0(t), C0(t), and D0(t)), is measured at the crossover of two solutions on the test chip. Obviously, the HOE device can integrate the optical module but the intensity gain must also be sacrificed. The major challenge is to miniaturize the size of an optical head without compromising the performance. In other words, the low efficiency of Ī(t) should be maximized with an operational amplifier (OP Amp) circuit. Besides, we need to make sure that the voltage response range not only satisfies the detection requirement but also has high gain-to-noise ratio. The clotted sample also should not obscure the light too much. Hence, we measured the variation of the intensity gain in the blood/plasma sample under two different situations, clotting and non-clotting. A data acquisition board (NI-9205 DAQ converter) captured continuous voltage signals from PD at a sampling rate of 2 kHz. The cut-off frequency of the low-pass filter is set to 100 Hz to prevent high frequency noise. Finally, the detection variation had a range of 0.8–1.6 V approximately, and the noise gain did not exceed 5% of the detection range (40 mV). The result of light intensity calculation is displayed using a visual programming language interface (NI LabVIEW™ 2012). All these operations are performed at room temperature. The total experimental time, including the signal calculation, is 6 min. All these specifications of setup are presented in table 1.
Table 1. Specification of the HOE module.
| Optical items | Specifications | |
|---|---|---|
| Dimensions | 5 (L) × 3 (W) × 3.1 (H) mm3 | |
| Mass | 10 g | |
| Working distance | ±2.1 mm | |
| Laser diode | Wavelength, λ | 635 nm, red light |
| Operating current | 30 mA | |
| Focusing detection | FE signal (S-curve) | Astigmatic method |
| Format | Quadrant (2 × 2) element | |
| Window material | Quartz glass | |
| Photodetector | Active area | 50 µm × 4 (A, B, C and D) |
| Element gap | 5 µm | |
| Sensitivity | 0.4 (A W−1), | |
| λ = 635 nm | ||
| FE signal amplitude | 0.75 V | |
| FE signal peak to peak distance | 4 µm | |
| Summed signal amplitude | 1.8 V (after amplifying) |
2.3. Focusing error signal and summed signal
The PD array of four segmented cells (A(t), B(t), C(t), and D(t)) is used to generate an astigmatic signal (based on the phase difference between the sums of the diagonal elements) [25], which is given by equation (1).
FE signal, f(t):

where A(t), B(t), C(t) and D(t) are the intensity of light in each cell.
Figure 3 shows the simulated FE signal as well as spot distributions. The spot intensity was normally distributed, and aberrations were within the acceptable range. Because the lens have different focal lengths on two orthogonal surfaces (sagittal and tangential planes), the return beam will introduce the astigmatic spot on the PD at the defocus position (±2 µm).
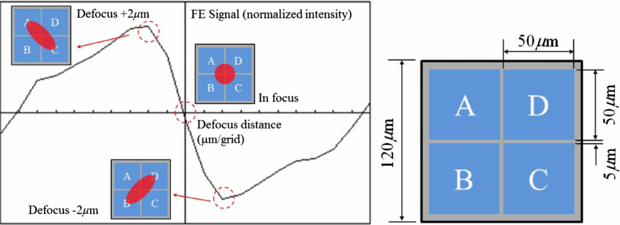
Figure 3. Astigmatic returning spot on the quadrant detector and the FE signal.
Download figure:
Standard image High-resolution imageHence, the summed signal is defined in terms of the total light intensity measured by the photodetector over time, as follows.
Summed signal, s(t):

The summed signal is the sum of signals from the four cells. Figure 4(a) presents four raw signals, A–D, which shows the experimental results that are obtained during the focusing movement by moving the dual-stage PZT actuator. Figure 4(b) compares the FE signal with the summed signal. The signal peak represents the laser in focus. Equation (3) describes the generation of the FE signal (S-curve). Furthermore, the tolerance of the balanced S-curve is obtained as follows

where Vpeak and Vbottom are the maximum and minimum voltages, respectively. The required balance of the S-curve is less than 10%. Next, the optimization principle is applied to find the maximum of signals in an interval. The optimization function is as follows

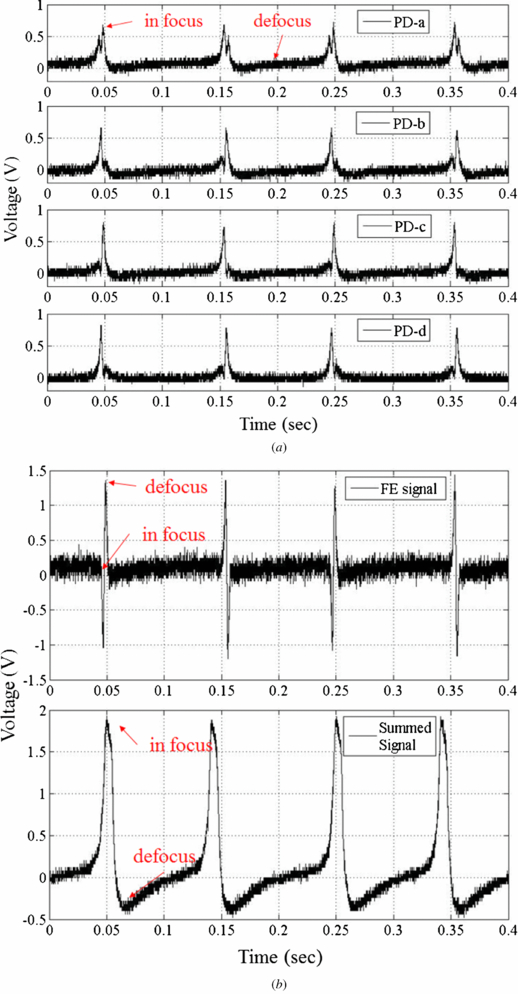
Figure 4. The detection signal from the HOE module. (a) The raw signals from PD. (b) FE signal and summed signals.
Download figure:
Standard image High-resolution imageThe sequence of time is separated into intervals (t0–t1, t1–t2, and so on). The length of the intervals depends on the focusing frequency. For focusing at 5 Hz, the interval is 0.2 s. The optimized summed signal, S(t), is the sum of a subset of peak signals in each interval, and can be defined as the 'maximum' total received light intensity. An OP Amp circuit is designed to magnify the weak voltage signal. The internal noise could be suppressed by a parallel capacitance. The transfer function of the OP Amp is shown as follows:

The relationship between the light intensity and photocurrent Isc is

The photodetector efficiency, η, of the 635 nm laser is 0.41 A W−1. By increasing the ratio of resistance, the response sensitivity is higher but the external noise is also amplified. On the other hand, if light intensity is smaller than the noise signal, then the intensity contrast is diminished. In order to maximize the signal-to-noise ratio, we need to apply a digital low pass filter to suppress the gain of high frequency noise as much as possible. Before the chip is filled with blood or plasma, it has peak voltage 1.8 V triggered by the OP Amp (figure 4(b)).
Figure 5 presents a flowchart of the analysis of the dynamics coagulation. The algorithm is used in LabVIEW™ 2012 to accumulate the intensities of the signal beams. First, the raw signals are filtered to eliminate high-frequency noise. The FE signal balance causes the actuator to adjust the gap between the HOE module and the sample. When the balance of the S-curve is less than 10%, the summed signal is produced. The dynamic curve of S(t) is plotted simultaneously with mixing of the two reagents. Once the summed signal converges to a horizontal regression line (red solid line, calculated by curve fitting) in the steady-state situation within the 5% tolerance, the first entering location will be considered the end of the coagulations, and the PT is calculated. That is defined as the end of the measurement process.
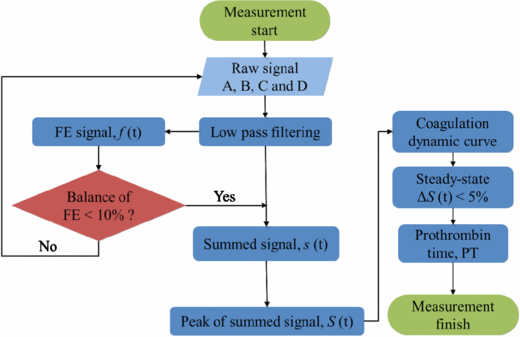
Figure 5. Numerical processing flow chart.
Download figure:
Standard image High-resolution image2.4. Characterizing coagulation by making classical measurements
To confirm the accuracy of the HOE module, a simple double-transmitting measurement system is established (figure 6). This measurement setup structure is based on MSA but the difference is that we use the transmitted light rather than scattered light for detection [26]. The He–Ne laser source and a PD are located on the same side of the sample.
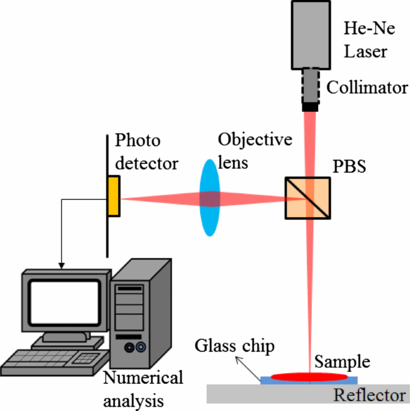
Figure 6. The reflection measurement system.
Download figure:
Standard image High-resolution imageAlthough the absorption spectrum of whole blood reveals that light with wavelengths of between 490 and 980 nm was absorbed by the whole blood/plasma, light with a wavelength of 635 nm was the most absorbed coherent light so was used for detection. The coherent beam will be slightly shifted relative to the source beam to prevent dazzling of the detector. When the vertical laser beam passes through the collimator lens and polarized beam splitter (PBS), the light will transmit through the sample and focus on the reflector. The returning beam is reflected by the PBS again and passes through the objective lens. Finally, the intensity of the transmitting light through the surface of the sample is measured by a PD. This double-transmitting method amplifies the intensity variation significantly in the coagulation process due to penetrating the blood twice.
3. Result and discussion
3.1. Normalized light intensity curve
Figure 7 plots light intensity as normalized amplitude as a function of time for standard plasma ((a) and (b)) and whole blood ((c) and (d)). Based on the definitions of Faivre [11], this time response can be separated into four regions. From t = 0, the standard sample, whole blood (or Dade® Ci-Trol®) is present in the chip. The light intensity is constant (phase I) up to 3–5 s. When the thromboplastin, Dade® Innovin®, is dropped on the chip, the amplitude falls (phase II). At the end of phase II, the signal suddenly increases to its maximum value before declining slowly because the optical density of the thromboplastin increases the light that is transmitted through the sample. In phase III, the signal smoothly becomes weaker because the beginning of the coagulation cascade reduces the intensity of transmitted light from the sample. During the formation of the blood clot (phase IV), the mean light intensity remains constant again and converges to a regression line (red solid line) within the 5% steady-state error range (gray dashed line in area IV of figure 7). The coagulation stabilizes the total light intensity. PT is defined as the duration of phase III. Stabilization of the optical properties of plasma/whole blood is within 8 s to 12 s, respectively.
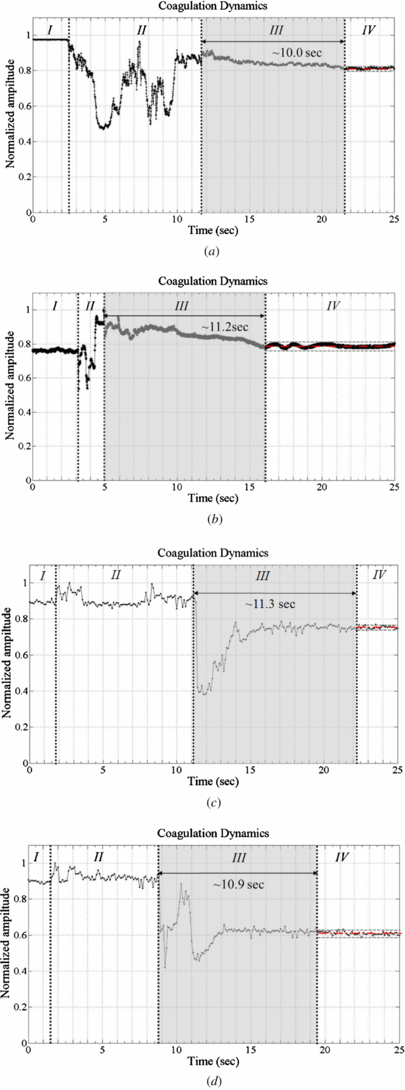
Figure 7. Coagulation dynamics with a plasma/blood sample (in reflection measurement system). (a) Plasma 1. (b) Plasma 2. (c) Blood 1. (d) Blood 2.
Download figure:
Standard image High-resolution imageFigure 8 plots the experimental results obtained using the proposed method. The origin of the light intensity curve includes a defocus signal and the maximum signal is about 1.4 V. This summed signal is a pulse function, so determining the PT is difficult. The in-focus point must be extracted from the raw signal data, using equation (4). The line with circles in figure 8 represents the peak of the summed signals. It is divided into the three phases II to IV (phase I is ignored here) by two inflection points (d2S(t)/dt2 = 0). Each part is associated with one of the different states defined above. At the beginning of the test (phase I), the light intensity depends on the transmission rate of the samples, which are different for each one. Besides, the most important issue is to verify the partition through the change of light intensity before/after coagulation in these processes (phases II to IV). Hence, the gain of phase I is set to be unity, and this part is ignored. The middle of the quadratic curve reflects the coagulation process. The PT is determined from the duration of phase III. Figure 9 plots the peak of summed signal obtained from the same four samples in the double-transmitted method. In phase II, the curve is similar to that obtained using the reference method because the intensity of the transmitted light is increasing, too. In phase III, the intensity increases to a high level that differs from that in the previous test. Both methods yielded similar PT of the samples. The significant difference is that the dynamic curve obtained using the classical method has only one inflection point at ∼5 s (beyond which it decreases), whereas the HOE module yields a second inflection at the end of clotting within the steady-state error. The amplitude increases after a smooth decline. Moreover, the steady-state intensity is different in both methods because a slight variation of the sample thickness will change the transmitted intensity. In the coagulation of a plasma sample (plasma 1 and 2), the variation of the mean light intensity in the reference method is <30% but it is ∼65% in the HOE method. Furthermore, the dynamic curve in whole blood (blood 1 and 2) still has 40% change of light intensity with HOE measurement. It means that the HOE module has higher contrast than the reference method in PT detection. Consequently, the determination of PT is always consistent in each measurement.
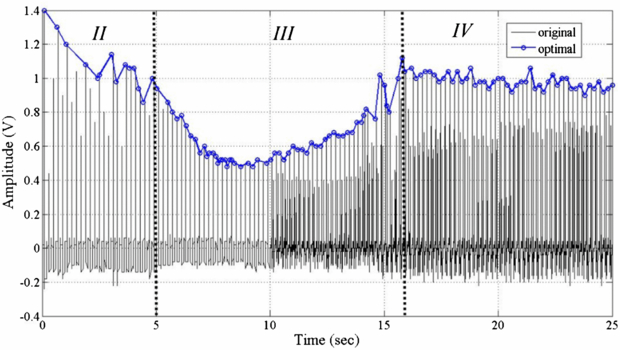
Figure 8. The measurement results for summed signal before/after optimization.
Download figure:
Standard image High-resolution image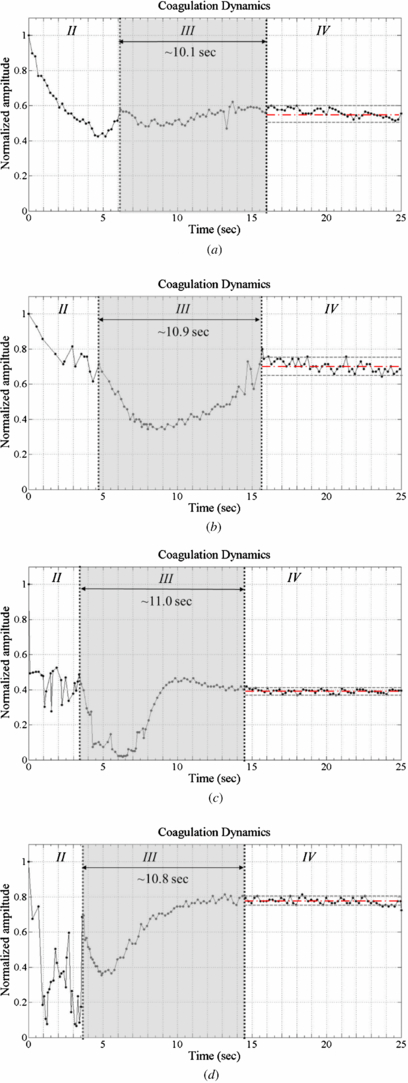
Figure 9. Coagulation dynamics with plasma/blood samples (in the SFF HOE module). (a) Plasma 1. (b) Plasma 2. (c) Blood 1. (d) Blood 2.
Download figure:
Standard image High-resolution image
In conclusion, the change of light intensity curve reflects the blood coagulation process. There are four phases as follows:
- Phase I. Constant intensity: only the plasma/whole blood is present on the chip.
- Phase II. Stabilization of agitation following addition of thromboplastin (low-frequency pulse signal).
- Phase III. Process of coagulation (reflected intensity decreases smoothly).
- Phase IV. End of process: clot finally formed. (The light intensity curve converges to a horizontal regression line within the steady-state error.)
3.2. International normalized ratio
The accuracy of the PT result (in s) on a normal sample will vary according to the different sorts of analytical schemes employed. This is due to the alterations between batches of tissue factor used in the reagent (i.e. human or rat thromboplastins), so it is known to be very reagent-dependent. In order to standardize the PT result, the World Health Organization (WHO) addressed the international normalized ratio (INR). PTs are used in comparison to a PTMean_Normal measured on a pool of healthy donors, but the sensitivity is not consistent in each sample. For standardizing the PT ratio, WHO also proposed that each manufacturer assigns an ISI value (International Sensitivity Index) for any tissue factor they manufacture. The ISI value indicates how a particular batch of tissue factor compares to an international reference tissue factor. The INR uses the ISI to equate all thromboplastins to the reference thromboplastin through the following equation:

The ISI is usually between 1.0 and 2.0. The INR is the ratio of a patient's PT to a normal (control) sample, raised to the power of the ISI value for the analytical scheme used. A standard INR value should be 0.8 to 1.2 for a healthy person, so it is also used to determine the effects of oral anti-coagulants on the coagulation cascade. For example, the INR value of an atrial fibrillation patient is usually higher than 5 and it should be controlled from 2.0 to 3.0. Finally, our INR ratio, INRHOE = (PTHOE/PTMean_ref)ISI, is calculated from equation (7). The ISI value was given by Siemens to be 1.0 for the choice of a particular reagent. The PTMean_ref was chosen to be the average PT of ten standard plasma samples measured with our setup. Table 2 shows the results of plasma/blood in three different measurements. The PT and the associated INR value in four different samples were presented. These results are compared to the measurement results done by an automated coagulation analyzer (Siemens Sysmex CA-1500) in a clinical laboratory. A fair regression coefficient (R2 = 89.2%) of INR between CA-1500 and our proposed method presents that our measurement result is well correlated to those obtained in the clinical laboratory.
Table 2. Coagulation time measurement results.
| Sysmex CA-1500 | Reference method | SFF HOE module | ||||
|---|---|---|---|---|---|---|
| Number of samples | 50 | 10 | 10 | |||
| PTMean_Normal (s) | 10.9 | 10.85 | 10.7 | |||
| PT (s) | INRCA | PT (s) | INRREF | PT (s) | INRHOE | |
| Plasma 1 | 10.5 | 0.96 | 10.0 | 0.92 | 10.1 | 0.94 |
| Plasma 2 | 11.6 | 1.06 | 11.2 | 1.03 | 10.9 | 1.02 |
| Blood 1 | 11.3 | 1.04 | 11.3 | 1.04 | 11.0 | 1.03 |
| Blood 2 | 11.1 | 1.02 | 10.9 | 1.00 | 10.8 | 1.01 |
| Reference range | 9.1–12.2 | 0.90–1.10 | 8–12 | 0.80–1.20 | 8–12 | 0.80–1.20 |
Table 3 summarizes the differences between the reference techniques (Sysmex CA-1500) and the proposed HOE module method. In our research, 5 µL of anti-coagulated (Ci-Trol) whole blood or plasma (Ci-Trol) is mixed with 10 µL of Innovin (thromboplastin). The CA-1500 instrument requires samples with a volume of at least 13 mL plasma centrifuged from whole blood (20 min). It means that our measurement system takes less sample volume and detection time for the blood coagulation test. Finally, the instrument repeatability has also been evaluated by the realization of ten replicates of the PT coagulation time measurement on the standard plasma sample. The results show a standard deviation of 1.54 s on a PT of 10.7 s, leading to a coefficient of variation (CV) of 4.12%.
Table 3. Comparison of the characteristics of the automated CA-1500 analyzer and our HOE technique.
| Siemens Sysmex CA-1500 | SFF HOE module | |
|---|---|---|
| Principle of measurement | Transmittance speckle | Double-transmitted light intensity |
| Sample volume | 13 mL of plasma (26 mL whole blood) | 5 µL of whole blood or plasma |
| Temperature | 37 °C | Room temperature |
| PT range | 10–60 s | 3–25 s |
| Duration of measurement | 20 min centrifugation + 11 min analyzer = 31 min | 6 min |
| Repeatability | CV < 5% | CV = 4.12% |
4. Conclusions
Because of the advantages of real-time blood particle image, fast response time and less sample volume, many optical methods are applied to the detection of blood coagulation. One of the important issues is daily rapid screening of a PT/INR value. However, other optical devices involve many lab-based instruments (e.g. SPR, spectroscopy or CCD), the proposed system with the miniature HOE component has the superiority of being a home care device.
An HOE module sensor with a dual-stage actuator is usually applied to achieve precise flying height positioning measurement in small-form-factor applications. This research demonstrated the use of the HOE module sensor to examine the blood coagulation reaction. The module is utilized for the first time in the real-time monitoring of the coagulation dynamics and duration of the clotting of blood plasma by a noninvasive technique. A different structure of experiment, a classical measurement system, is also proposed to verify the performance of the HOE system. Both methods are based on the variation of light intensity which is transmitted through the blood sample twice to measure the duration of the clotting process. Since the intensity is slightly changed in the HOE module, the raw signals are filtered and amplified numerically. The total duration of clotting measurement is 6 min with HOE module. The required volume of the sample is around 5 µL, as is that of the plasma and blood. This finding was confirmed by comparison with measurements made using classical methods. Besides, the HOE module is a miniature structure to reduce the sizes of optical instrument without compromising the performance in PT measurement. We obtained good consistency in the determination of INR with our measurements of PT and the PT measured by the clinical laboratory. The proposed compact label-free optical biosensor system provides fast signal processing in optical bio-detection with low volume of sample.