

Abstract
A new non-contact optical method (IIC, infrared image correlation) for the determination of the coefficients of thermal expansion of solid materials is presented. The proposed method is based on performing a digital image correlation between thermal images recorded at different temperatures by means of an infrared camera. It allows the coefficient of thermal expansion of both isotropic and anisotropic solid materials to be determined by measuring simultaneously the fractional increase in length and the actual thermal field over a small region of interest in which a dual-emissivity stochastic speckle pattern has been created. The results reported in this paper prove the effectiveness of the proposed method that can be applied either to carry out reference measurements in laboratory or to evaluate thermal stresses and strains on structural components in-field.
Export citation and abstract BibTeX RIS
1. Introduction
In its simplest form, the coefficient of linear thermal expansion (CTE) of any solid material can be defined as the fractional increase in length (linear dimension) per unit rise in temperature. The most general definition is the mean or average coefficient of thermal expansion as given by ASTM [1, 2]:

Based on this definition, αm,1 is related to the slope of the chord between two points on the curve of length against temperature, which represents the expansion over the particular temperature range from T1 to T2, with initial length L0 defined at a reference temperature T0. Often the lower limit of the specified temperature range is also used as the reference temperature, leading to a modification of the former equation to the following [3]:

It should however be noted that the mean CTE computed using either equation (1) or (2) depends on the specific temperature range considered and will, for most metals and alloys, gradually increase with temperature. Thus, in contrast to the true coefficient of linear thermal expansion (αt), which is related to the derivative dL/dT computed at a single temperature, the definition of mean CTE involves the explicit specification either of three or two reference temperatures.
According to the previous formulae, determination of the average coefficient of thermal expansion requires the measurement of two physical quantities, displacement and temperature, which can be accomplished by means of different experimental methods. Standard test methods include push-rod dilatometry [1], laser interferometry [2] and thermo-mechanical analysis [4]. The increasing use of computer-based thermo-mechanical models as well as specific requirements concerning multi-layered thermal barrier coatings used in modern gas turbines and jet engines has determined a greater need for quantitative data, promoting in the last decades the development of advanced optical methods for the measurement of CTE, such as those based on high magnification imaging [3], moiré interferometry [5], electronic speckle pattern interferometry (ESPI) [6, 7], phase-shifting interferometry [8] and optical extensimetry [9]. Recently, digital image correlation (DIC) has also been proposed as an alternative method for measuring the thermal deformation field of thin films [10] and coating materials [11]. In both these studies a megapixel camera working in the visible spectrum has been employed, allowing the CTE to be evaluated from room temperature to approximately 1100 °C. All these techniques differ from each other only in the way the material expansion is measured, since the reference temperatures are always determined by monitoring the air temperature inside the heating device used to exert thermal loading, rather than measuring it directly on the sample surface. Even if a single surface mounted temperature sensor is employed, in reality there is no control on the effective temperature distribution established over the specimen's surface that is assumed to be uniform in temperature and thermal expansion behaviour. Moreover, not all of the above-mentioned methods are suitable for making measurements at elevated temperatures (>1000 °C). Although laser-based interferometric devices can accurately measure a specimen's thermal expansion with high resolution, use of interferometry at higher temperatures is often associated with severe setbacks related to the effect of background radiation and the deterioration of the optical reflective surface with time.
In this paper, a new non-contact optical technique which allows some of the limitations associated with the existing techniques to be overcome is introduced. The proposed method (IIC, infrared image correlation) relies on recording two (or more) infrared images at two (or more) different temperatures of a random dual-emissivity speckle pattern created over a small region of the target surface and post-processing the resulting infrared images by means of a DIC algorithm in order to provide the full-field in-plane displacement map of the thermally loaded sample surface. To prove the feasibility and effectiveness of the proposed method, the CTE in x and y directions of a nearly isotropic brass specimen and an anisotropic unidirectional glass fibre reinforced composite (GFRP) specimen were measured and compared with values obtained by means of a standard push-rod dilatometer. Finally, the uncertainty of CTE measurement by the IIC method is discussed and the main uncertainty sources evaluated.
2. Materials and methods
2.1. Infrared image correlation method
DIC is an optical experimental technique originally developed by a group of researchers at the University of South Carolina in the 1980s [12, 13] and since then applied in numerous applications in the field of experimental mechanics [14]. It directly provides full-field in-plane displacement fields of the test planar specimen surface by comparing digital images recorded in the undeformed (or reference) and deformed states, respectively. The basic approach relies on random speckle patterns sprayed onto the test surface which deform together with it and act as a carrier of deformation information.
In contrast to the conventional DIC method, which is based on digital images acquired by an optical camera operating in the visible range, the proposed method (figure 1) makes use of radiometric infrared (IR) images displaying infrared radiation emitted by the target surface in a specific window of the IR spectrum. Hence, each image represents the apparent temperature distribution of the object being viewed, given that the object in general does not behave as an ideal black body. On the other hand, the dependence of thermal radiation on material's emissivity can be usefully exploited in order to generate a suitable thermal contrast in the IR images, which eventually can be post-processed by means of a digital correlation algorithm in order to retrieve in-plane displacement fields of the thermally loaded sample surface.
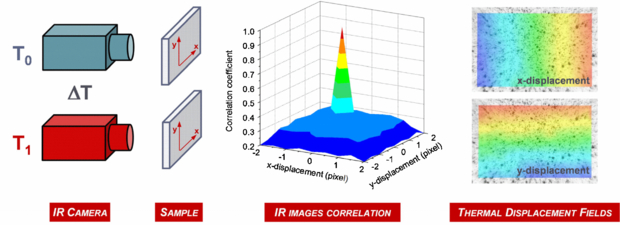
Figure 1. Infrared image correlation (IIC) method: IR images of a randomly structured thermally contrasted pattern created on the target surface are recorded at two different temperatures and then post-processed using a sum-square difference (SSD) correlation algorithm to search for the peak position of the correlation coefficients distribution. The matching procedure is carried out numerically on each subset, allowing the complete in-plane thermal displacement field to be computed.
Download figure:
Standard image High-resolution image2.2. Dual-emissivity random speckle pattern
Image correlation requires a randomly structured surface finishing of the measuring target to allocate pixels in the camera image. As infrared images in the mid-wave infrared range (MWIR) are used, in order to make 'visible' the speckle pattern, the physics of thermal radiation must be exploited. In particular, an IR signature could be obtained by using materials with different emissivity. In addition, several requirements must be met to make the IIC technique effective:
- •the materials used to create the speckle pattern must display good contrast in the MWIR spectral band, otherwise the matching procedure (correlation) would not work;
- •the surface pattern must be able to follow the thermal deformation of the specimen and must not break early nor produce a reinforcing effect on the test sample (i.e. its thickness and stiffness should be negligible with respect to those of the test specimen);
- •the materials used to create the speckle pattern should have a low thermal expansion coefficient (i.e. they must not expand when exposed to relatively large ΔT);
- •the average emissivity of the surface pattern should be as high as possible to prevent spurious reflections that can affect the accuracy of temperature measurements. Reflections also cause a bad contrast in the thermal images preventing matching computation in the areas of reflection;
- •on one hand, the size of the surface characteristics should be small enough to allow a fine raster of calculation subsets during evaluation. On the other hand, the pattern should be large enough to be completely resolved by the infrared camera;
- •the specimen surface must be flat and oriented orthogonally to the axis of the camera.
Several trials were made in order to find the best solution for creating the speckle pattern. Good results were achieved with fine-grained gypsum powders applied over a uniform layer of opaque black paint sprayed onto the target surface in order to create a high emissivity (εpaint = 0.96) background. Gypsum has in fact a very low emissivity coefficient (εgypsum ≈ 0.1) in the 3–5 µm spectral range, producing a high infrared contrast with respect to the black paint used as background. Figure 2 shows an example of dual-emissivity speckle pattern created on the surface of a test specimen made from brass.
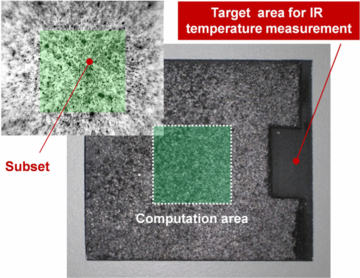
Figure 2. Dual-emissivity random speckle pattern created on a brass sample. A subset size of 25 × 25 pixel with 12 pixel overlapping was typically used for matching computations.
Download figure:
Standard image High-resolution imageThe speckle pattern was applied on the whole specimen's surface except for a small rectangular area that was only black painted. This part of the sample, which is within the field of view of the IR camera and is characterized by a known and uniform emissivity, was used as the target area for the measurement of ΔT. Of course, the shape and length of the black painted area can be varied at will, depending on the degree of control of the heating exchange process (stationary or non-stationary conditions).
2.3. Image correlation analysis
The working principle of IIC can be illustrated synthetically as follows (figure 3). A subset of (2M+1)×(2M+1) pixels centred at point (x0, y0) from the reference infrared image at temperature T0 is first chosen and used to determine its corresponding location in the deformed image (at temperature TN). A sum-square difference (SSD) correlation algorithm is then applied to evaluate the similarity between the reference subset and the target subset. The matching procedure is carried out numerically through searching the peak position of the correlation coefficients distribution. Once the maximum of the correlation function has been detected, the target subset in the two images can be determined, allowing the displacement field to be calculated. In practical implementation, a region of interest (ROI) in the reference image is specified first and divided into evenly spaced virtual grids. In-plane displacements were computed at each point of the virtual grids to obtain the full-field deformation, while the corresponding reference temperatures were provided by the infrared camera. Finally, average CTEs in x and y directions were calculated using equation (2) based on average thermal strains extracted from the thermal displacement fields. The software Aramis by GOM mbH (Braunschweig, Germany) was used to perform image correlation.
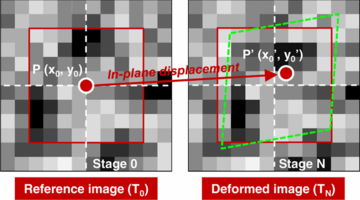
Figure 3. Schematic illustration of a square subset before (stage 0) and after (stage N) thermal loading, the differences of positions of the reference subset centre and target subset centre yield in-plane displacement components.
Download figure:
Standard image High-resolution image2.4. Design of the heating device
A dedicated heating device (figure 4) was specifically designed to carry out the experimental tests. It basically consists of a thermally insulated chamber equipped with an electronic temperature controller. Heat insulation was achieved by using 6 mm thick ceramic sheets made from calcium silicate, which were carefully cut to the desired dimension. The heating source consists of an electrical resistance module mounted underneath the specimen that was retained horizontally on two small thermally insulated cylindrical supports without restraints. To prevent direct radiation, the heating source has been 'obscured' using thermally opaque screens (not shown in the schematic drawing). The heating device was instrumented with a Pt100 thermometer used to control the air temperature inside it. Two further surface type K thermocouples were mounted on the top and on the bottom sides of the specimen for monitoring the bulk temperature and checking for potential thermal gradients across its thickness. Optical access was realized on the top of the chamber using a zinc selenide (ZnSe) window having 98% transmissivity in the MWIR range. It is important to note that, since in the IIC method the temperature distribution on the specimen's surface is directly measured by the infrared camera, the use of a surrounding furnace or environmental chamber would be no more strictly necessary, as the method could in principle be applied also in non-stationary thermal conditions.
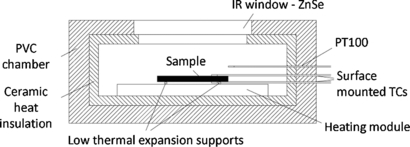
Figure 4. Drawing of the heating device used to carry out the experimental tests.
Download figure:
Standard image High-resolution image2.5. Tested materials
Two different materials have been tested to demonstrate the effectiveness of the IIC method. The first one is wrought brass, the second one is a thermoplastic unidirectional glass fibre reinforced composite with 60% fibre volume content (TEPEX® dynalite 102). It is expected that, while the brass specimen should exhibit nearly isotropic behaviour when subjected to thermal loading, the composite specimen should not, instead manifesting a markedly anisotropic thermal strain field. Both specimens have been prepared by cutting them to similar size, roughly 60 mm ×40 mm × 2 mm (W×L×H).
2.6. Experimental procedure
The imaging system used in our experiments consisted of an InSb cooled 640×512 pixels infrared camera (model Titanium, Cedip Infrared Systems, Croissy Beaubourg, France), operating in the MWIR range and equipped with a 50 mm lens. The IR camera was carefully aligned with respect to the heating device, which was placed on an optical table (figure 5(a)). Preliminary tests were performed to calibrate the temperature values measured across the ZnSe glass (figure 5(b)), taking into account both the IR transmittivity of the window and the actual emissivity of the black paint used as background for the target area. Conversely, systematic effects related to secondary IR radiation from the ZnSe window and to the dependence of the background emissivity on temperature were not evaluated yet, as a relatively small temperature range had been used in the experiments so far.
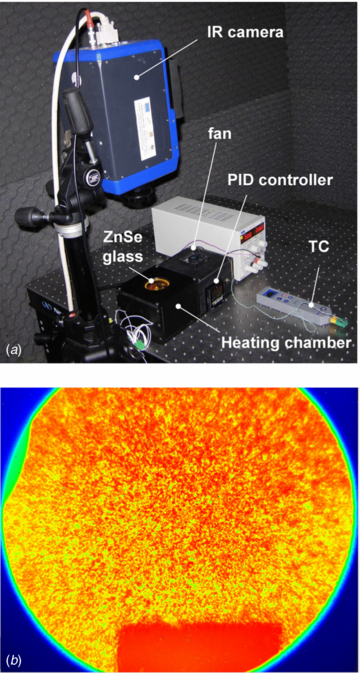
Figure 5. (a) Measurement set-up and (b) infrared image of a sample observed through the ZnSe window.
Download figure:
Standard image High-resolution imageExperimental tests were carried out in steady-state conditions using multiple thermal steps from 30 °C to 70 °C, with 5 °C increments. For each temperature level, a suitable stabilization time (variable from 10 to 20 min) was awaited, allowing thermal equilibrium of the specimen to be reached. Ten infrared images (8 bit grey levels) were recorded at each stabilized temperature level and then stored for further post-processing. The first temperature level was used as reference for the computation of ΔT and ΔL. Each sequence of nine images (one for each temperature step) was then processed numerically in order to retrieve the actual values of ΔT and ΔL. Measurements were repeated ten times to check for repeatability. Mean temperatures were obtained for each step by averaging the temperature values measured by the IR camera within the blackened small rectangular area made on the specimen surface. Relative displacements ΔL in x and y directions were calculated, after image calibration, at a mesh grid of 784 (28×28) points, with subset size of 25×25 pixels and 12 pixel overlapping. Relative displacements computed by means of IIC are influenced by unavoidable small rigid body translations [15] that occur during the thermal expansion of the test specimen, which was placed into the heating device without restraint. This effect must be corrected in order to get pure thermal expansion of the test specimen. This was done by subtracting the displacements of the centre point of the calculation area from each image of the recorded sequence. Conversely, rigid body rotations of the test specimen, which result in contour lines of x and y displacement fields that are no longer parallel with the y- and x-axis respectively, do not affect strain components [11] and were not compensated for in image processing. The displacement measurement accuracy, which can be controlled by adjusting the subset size, was estimated to be 0.02 pixels in our experiments (or 1.48 µm, as the actual magnification of the imaging system was 74 µm/pixel).
In order to reduce the influence of noise generated by the numerical differentiation process, average strain components along x and y directions were computed using a least square routine to fit a plane to the points of each displacement surface and calculating the resulting slopes. Thus, the discrete displacement components at coordinates (x, y) were approximated as

where a0, ..., b2 are constant coefficients. Once the constant coefficients a0, ..., b2 had been obtained by least square fitting, the average thermal strain components in x and y directions were finally computed as

This procedure allowed noise to be averaged out from displacement data.
To validate the experimental and data processing methodologies, the obtained CTE values were compared with those measured on the same specimens by means of a standard push-rod dilatometer (mod. DIL 402 C, Netzsch GmbH, Selb, Germany).
3. Results
Figures 6–9 summarize the main results obtained by applying the IIC method to determine the CTE values on two different types of material.
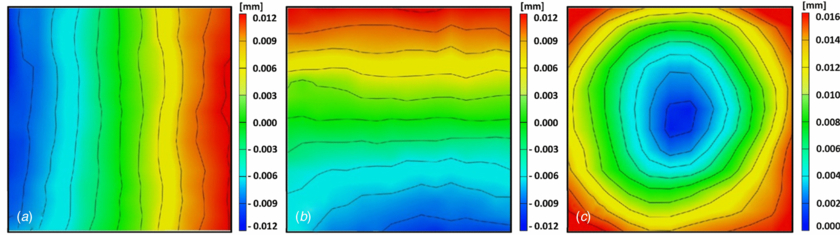
Figure 6. False-colour maps of pure (after rigid body motion compensation) thermal displacement fields measured on the brass specimen at T2 = 70 °C (ΔT = 40 °C): (a) x displacement field; (b) y displacement field; (c) in-plane vector displacement field. The computation area is 355 × 355 pixels.
Download figure:
Standard image High-resolution image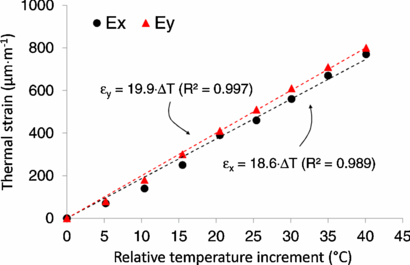
Figure 7. Average CTE values measured on brass between 30 °C and 70 °C.
Download figure:
Standard image High-resolution image
Figure 8. False-colour maps of pure (after rigid body motion compensation) thermal displacement fields measured on the TEPEX® dynalite 102 GFRP specimen at T2 = 70 °C (ΔT = 40 °C): (a) x displacement field; (b) y displacement field; (c) in-plane vector displacement field. The computation area is 355 × 355 pixels.
Download figure:
Standard image High-resolution image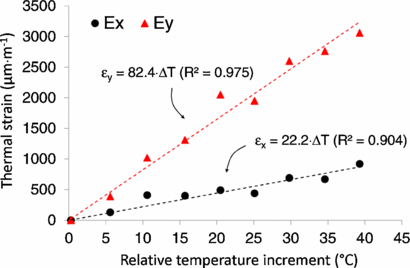
Figure 9. Average CTE values measured on TEPEX® dynalite 102 GFRP between 30 °C and 70 °C.
Download figure:
Standard image High-resolution image
Figure 6 shows false-colour maps of pure (after rigid body motion compensation) thermal displacement fields measured at T2 = 70 °C (ΔT = 40 °C) on the brass specimen. From these plots it can be observed that the specimen expands thermally in a symmetric mode displaying similar maximum displacement values in the two orthogonal directions. To quantitatively determine the average CTE of brass, the experimental data obtained at different temperatures in the range 30–70 °C were fitted by a straight line (figure 7). By comparing the mean CTE values computed along the x and y directions, it can be concluded that brass exhibits, as expected, nearly isotropic thermal behaviour, since the small difference observed between the two values falls well within the measurement uncertainty (see section 4). Similar results were obtained by the authors testing Al alloy samples between 30 °C and 60 °C [16].
Figure 8 shows false-colour maps of pure (after rigid body motion compensation) thermal displacement fields measured at T2 = 70 °C (ΔT = 40 °C) on the TEPEX® dynalite 102 GFRP specimen. In contrast to the behaviour observed for the brass specimen, the thermal expansion of the composite specimen is no longer symmetric, because of the stiffening effect produced by the presence of unidirectional reinforcing fibres. To quantitatively determine the average CTE of TEPEX® dynalite 102, the experimental data obtained at different temperature levels in the range 30–70 °C were fitted by a straight line (figure 9). The experimental data clearly revealed that the GFRP specimen exhibits markedly anisotropic behaviour, as the average CTE computed along the reinforcing fibres direction is about four times smaller than that computed in the transversal direction.
The obtained results are condensed in table 1, where CTE values determined on the same samples by means of a standard push-rod dilatometer are also reported. The comparison shows good agreement, proving the effectiveness of the IIC method in providing CTE measurements in multiple directions in a reliable way without contact with the target surface.
Table 1. Summary of the obtained results and comparison with standard push-rod dilatometry (DIL). Average CTE values ± standard deviation (computed over ten repeated tests) measured between 30 °C and 70 °C (ΔT = 40 °C).
| Brass | TEPEX® dynalite 102 GFRP | ||||
|---|---|---|---|---|---|
| αIIC (µm m−1 °C−1) | αDIL (µm m−1 °C−1) | αIIC (µm m−1 °C−1) | αDIL (µm m−1 °C−1) | ||
| x | 18.6 ± 1.1 | 19.2 | 22.2 ± 1.6 | 21.7 | |
| y | 19.9 ± 1.2 | 82.4 ± 1.4 | 81.2 | ||
4. Discussion
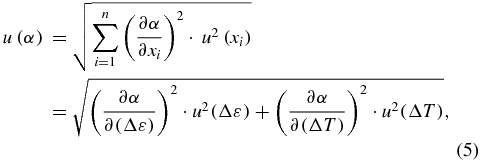
According to equation (2), the accuracy of CTE evaluation by the IIC method can be estimated, as a first approximation, by propagating the uncertainty contributions of Δε and ΔT:
where u(Δε) and u(ΔT) are standard uncertainties associated with Δε and ΔT, respectively. Typically, the accuracy of the displacement estimation using a SSD correlation algorithm is ±0.02 pixels [14]. Therefore, the accuracy of thermal strain computation might be estimated as ±|0.02 + 0.02|/L by forward difference [10], where L1 is the chosen initial length at temperature T1. As in our experiments L1 is 355 pixels, then u(Δε) can be estimated to be 113 ppm. Actually, the uncertainty of thermal strain evaluation is lower, since the linear plane fitting process smooths out noise significantly. A more appropriate estimation for u(Δε) can be obtained by considering the standard deviation of the two slope coefficients determined through the fitting process (a1 and b2 in equation (4)). This led to an average value of 51 ppm for u(Δε). The accuracy of the radiometric measurement of temperature by means of a calibrated infrared camera is typically ±1 °C. Therefore u(ΔT) is roughly 0.58 °C if a symmetric rectangular probability distribution is subjectively assumed. Since the experimental tests were conducted under well-controlled environmental conditions (i.e. inside the heating device), actual temperature values measured within the target area showed very limited variability (typically, a standard deviation of ±0.16 °C at 70 °C was obtained in our tests on the whole blackened area).
By applying equation (5), it follows that the expected combined uncertainty of CTE measurement will be ±1.3 µm m−1 °C−1 for a ΔT of 40 °C (note that this value might be reduced drastically by increasing ΔT).
Taking into account the estimated combined uncertainty, it can be concluded that average CTE values measured by means of the IIC method are compatible with those obtained by standard push-rod dilatometry (table 1).
Moreover, it can be observed that actual deviations of CTE values in repeated measurements (table 1) fall well within the expanded uncertainty bands at 95% confidence level (± 2.9 µm m−1 °C−1, computed with a coverage factor k = 2.26 and based on a t-distribution with nine degrees of freedom).
A closer examination of the results reported in figures 7 and 9 reveals that CTE values measured on TEPEX® dynalite 102 GFRP generally display higher scattering from the linear fit when compared to those measured on brass, as confirmed by the lower values of the correlation factor R2. This behaviour might be explained by considering that the composite material has a much more inhomogeneous microstructure that could locally affect the strain distribution. This effect is quite evident when comparing the false-colour maps of pure thermal displacement fields shown in figures 6(a) and 8(a), which have similar absolute displacements.
In contrast to other experimental methods employed for assessment of materials CTE, IIC makes use of the actual temperature measured directly on the specimen surface, rather than relying on the nominal temperature regulated by the heating controlling system, thus eliminating systematic errors caused by non-uniform temperature distributions on the measuring target.
One main benefit of the proposed approach is the possibility of determining average CTE values in multiple directions with a single test. This is an important feature when dealing with materials characterized by markedly anisotropic behaviour, as is the case with most composite structures. Figures 6(c) and 8(c) show the vector displacement fields obtained at 70 °C (ΔT = 40 °C) for the brass and GFRP specimen, respectively. The quite different behaviour of the two materials with respect to their thermal expansion response is clearly revealed by comparing the vector displacement fields, from which the degree of anisotropy can be easily assessed (table 1).
The IIC method can also be applied for measuring the CTE of non-planar surfaces (i.e. 3D geometries) by employing two image acquisition systems (stereoscopic setup) instead of one, allowing all three components of the displacement vector to be determined by tracking the motion of each image point in the field of view.
In addition, since IIC is a full-field technique, it might also be used to assess the true coefficient of linear expansion (usually referred to as thermal expansivity) of a material subjected to an unsteady thermal flow, mapping the temperature distribution and computing the derivatives dL/dT at specific sections of the sample surface. Future work is envisaged to demonstrate the practical feasibility of this challenging task. Currently, on-going research is focused on the optimization of the measurement set-up. This will encompass, in addition to enhancement of the spatial resolution of the imaging system by using a close-up lens, several aspects which include optimization of the dual-emissivity speckle pattern (to be able to apply the method also at elevated temperatures), identification of the effects produced by secondary sources of IR radiation and assessment of the influence of image brightening with temperature.
5. Conclusions
In this paper a new method for the determination of the coefficients of thermal expansion of rigid solid materials has been presented and discussed. The method, which has been called infrared image correlation (IIC), is based on performing a DIC between thermal images acquired at different temperatures by means of an infrared camera. First results reported in this paper prove the effectiveness of the proposed approach that can be applied either to carry out reference measurements in the laboratory or to evaluate thermal stresses and strains on structural components in the field.
Acknowledgments
The work was partially financed under the research project 'Centro Ricerche Tecna Territorio-–PIT 22' POR SICILIA 2000-06-–Misura III.15 Azione C n. 1999.IT.16.1.PO.011/3.15/5.2.13/0017.