

Abstract
Fe2MnSi fails to follow the Slater–Pauling rule. This phenomenon is thought to originate from either: (i) an antiferromagnetic arrangement of Mn ions at low temperature and/or (ii) chemical disorder. An important insight on this issue could be achieved by considering Fe2MnSi1−xGax compounds, thoroughly studied here by means of magnetization, neutron diffraction and density functional calculations (DFT). Our results indicate that chemical disorder (and not the antiferromagnetic arrangement) is responsible for the deviation of the Slater–Pauling rule on Fe2MnSi-based Heusler alloys. Furthermore, evidences suggest that Ga substitution into Si site favors the Fe/Mn disorder, further enhancing the observed deviation.
Export citation and abstract BibTeX RIS
1. Brief survey on  Heusler alloy

The parent compound of our series is Fe3Si. This crystallizes on a  cubic structure, DO3-type consisting of a fcc-lattice [1]. This structure may be described by a unit cell with four cubic interpenetrating sublattices, in which the corresponding origins are placed at (0, 0, 0), site A (1/4, 1/4, 1/4), site B (1/2, 1/2, 1/2) and site C (3/4, 3/4, 3/4), where the Si atoms occupy the position (0, 0, 0) and the Fe ions the other three. Once Mn ions are added in iron sites Fe3−xMnxSi alloys, for x < 0.75, these tend to occupy the B site and the system is ferromagnetic, in agreement with Korringa–Kohn–Rostoker Green-function method of DFT [2]. However, for large dopings, x > 0.75, the chemical disorder changes the crystal structure and the material becomes L21-type. This last is very similar to DO3, except that Fe ions in the A site are replaced by Mn [2]. For this range of composition, a spin reorientation occurs at TR, as a result of an antiferromagnetic coupling and canted spins schemes [3]. In addition, this range also favors the appearance of a half-metallicity, as predicted by density of states (DOS) calculations [2, 3].
Several authors have explored the magnetic and structural properties as well as the chemical disorder effects on the parent compound Fe2MnSi Heusler alloy [2, 4–8]. Varaprasad [9] and Srinivasan [10] experimentally described the influence of disorder on the spin polarization of other Heusler alloys. Important findings are that the majority of the A site is occupied by Fe atoms (at a fraction of 94%), while B contains Mn atoms (at a fraction of 88%) [8, 11, 12]; and therefore chemical disorder is likely to play an important role on the observed properties. In addition, as mentioned earlier, this compound presents a spin reorientation at  K, below which Mn magnetic moments tend to couple antiferromagnetically, reducing the total magnetization [8]; but iron magnetic moments remain ferromagnetically coupled.
In an earlier work by our group [13], it was verified that Fe2Mn(Si,Ga) does not follow de Slater–Pauling rule and therefore there are two possible reasons to this deviation: the antiferromagnetic arrangement of Mn ions below TR and/or chemical disorder. In order to elucidate the root cause of the deviation, (and because eliminating chemical disorder is not trivial) we eliminated the Mn antiferromangnetic ordering by means of gallium substitution on the silicon site. This approach works because the full gallium analog, Fe2MnGa, is a ferromagnetic material [13]. A thorough study of these materials (Fe2MnSi1−xGax) by means of magnetization, neutron diffraction and DFT allows to evaluate the influence of disorder on the deviation of the Slater–Pauling rule and the decrease of spin polarization
2. Experimental and theoretical procedures
Polycrystalline ingots of Fe2MnSi1−xGax Heusler alloys (x = 0.02, 0.12 and 0.50—and from now on named as Ga002, Ga012 and Ga050, respectively), were synthesized in an arc furnace under Ar atmosphere. The mass of the high purity reactants were mixed in stoichiometric quantities, with exception of Mn, which was added in excess of 3% to compensate possible losses during the melting process. The ingots were wrapped in tantalum foils, sealed in a quartz tube filled with argon and annealed for 3 days at 1323 K and quenched in water resulting in single phase samples as verified by x-ray and neutron diffraction. Magnetization data as a function of temperature and magnetic field were acquired using commercial superconducting quantum interference devices (SQUID) from Quantum Design at Oak Ridge National Laboratory, USA. Further details on samples preparation and structural characterization can be found on [13].
Neutron powder diffraction data were measured at the Powgen time-of-flight diffractometer at Oak Ridge National Laboratory, USA, using a central neutron wavelength of  Å. Diffraction data were analyzed by the Rietveld method employing the FULLPROF suite of programs [14].
Density functional theory (DFT) [15, 16] calculations were performed using the Vienna ab initio simulation package (VASP) [17, 18]. The core potentials were described the projector augmented wave (PAW) method [19]. The spin polarized generalized-gradient approximation (GGA) [20], with the Perdew–Burke–Ernzerhof (PBE) functional, was adopted to describe the exchange and correlation interaction among electrons. A plane wave basis set was employed with an energy cutoff of 350 eV. The calculations were performed using a ( ) cubic supercell with 128 atoms. The irreducible part of the Brillouin zone was sampled by a (
 ) Monkhorst–Pack grid. The structure was fully optimized until the forces were smaller than 0.01 eV
  . In all simulations the experimental lattice parameter was adopted.
3. Magnetization measurements
Magnetization as a function of temperature and under several values of applied magnetic field was measured, as depicted on figure 1 for (a) 50 Oe and (b) 50 kOe. For lower values of magnetic field, a large difference between ZFC and FC magnetization curves is observed at low temperatures; most notably below spin reorientation temperature  K (x = 0.02), 48 K (x = 0.12) and 15 K (x = 0.50). Note that Si/Ga substitution promotes a decrease on TR. In addition, for higher values of applied magnetic field, TR further shifts towards lower values of temperature and the ZFC and FC curves collapse. From these data (and other values of applied magnetic field—not shown), a phase diagram could be reassembled, as presented on figure 1(c). Note that at high magnetic field of 50 kOe, the Mn antiferromagnetic arrangement of Ga002 and Ga012 samples is still observed, while no such transition is seen on the Ga050 sample. For the sake of completeness, the Curie temperature TC was found at 185 K (x = 0.02), 175 K (x = 0.12) and 115 K (x = 0.50); where TC was defined as the temperature where the
  derivative reaches a minimum value. The obtained values are satisfactorily in agreement with the previously reported values [13].

Figure 1. Magnetization as a function of temperature for (a) low and (b) high values of magnetic field. The corresponding magnetic phase diagram on (c), in which the spin-reorientation of Mn ions at low temperatures is suppressed. This suppression is achieved for the Ga050 sample at 50 kOe of the applied magnetic field.
Download figure:
Standard image High-resolution imageThe saturation value of the magnetization Ms is the difference between spin-up and spin-down occupied states at low temperatures and high magnetic field; and this value can be estimated from M versus 1/H curve, since  . This result is on figure 2, where a comparison among theoretical Slater–Pauling values and experimental ones are shown. Note that there is a deviation from the Slater–Pauling rule, even for x = 0.50, where there is no longer antiferromagnetic arrangement of Mn ions (at this value of magnetic field). We conclude, from these magnetic measurements, that the deviation from the Slater–Pauling rule on Fe2MnSi-based materials does not depend on the antiferromagnetic arrangement; but, indeed, it is due to the chemical disorder.

Figure 2. Saturation value of the magnetization Ms, obtained from the condition  , and the Slater–Pauling rule.
Download figure:
Standard image High-resolution image4. Neutron diffraction
Since the zero field magnetic character of the samples under consideration is very similar (all of those have Curie temperature, spin-reorientation, deviation from Slater–Pauling rule, etc) we will present a detailed analysis of the neutron powder diffraction pattern of a single sample: Ga002.
The room temperature neutron powder diffraction is presented on figure 3(a). Upon decreasing temperature, at 185 K, Ga002 undergoes a magnetic phase transition to a ferromagnetic state and consequently all magnetic scattering, will appear on the location of existing crystallographic peaks, as can be seen on the 120 K measurement shown on figure 3(b). Further decreasing the temperature, at 66 K, Ga002 has a spin reorientation and Mn ions couple in an antiferromagnetic fashion [8]; and thus, the assumed magnetic structure had to be modified, as can be seen on figure 3(c)—measured at 20 K. The inset of figure 3(c) shows that below TR new peaks appear as a signature of the antiferromagnetic coupling; however, these new peaks have also a low intensity.
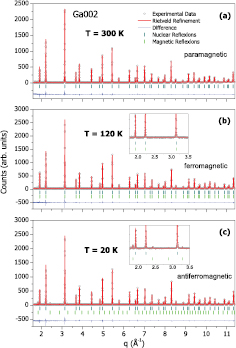
Figure 3. Neutron powder diffraction patterns and their refinement for the Ga002 sample. These data were obtained at (a) 300 K, (b) 120 K and (c) 20 K, which correspond to paramagnetic, ferromagnetic and antiferromagnetic states, respectively. The inset of panel (c) shows the peak of the AFM phase. All peaks were crystallographically and magnetically indexed. The circles are the observed pattern, the red line the calculated and the blue line the difference between calculated and observed data. Blue and green vertical bars represent the crystallographic and magnetic reflections, respectively.
Download figure:
Standard image High-resolution imageThe lattice parameter a of this structure as a function of temperature could be obtained from a Rietveld analysis of the neutron powder diffraction, for the three samples. Considering V0 as the volume of the unit cell at 50 K, its relative change  could be obtained, as presented on figure 4. The unit cell volume only presents a small hump around the Curie temperature (for Ga002 and Ga012-see the arrows); and no remarkable feature around the spin reorientation temperatures.
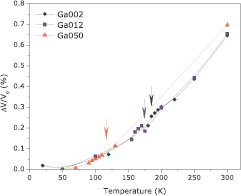
Figure 4. Relative volume change as a function of temperature, considering V0 the volume at 50 K. These data are from the Rietveld analysis of the neutron powder diffraction data. Arrows indicate the Curie temperature for each composition.
Download figure:
Standard image High-resolution imageRietveld analysis of neutron powder diffraction also allowed the determination of the occupation of each site in each compound. As mentioned before, Si atoms occupy (0,0,0) site, while sites (1/4,1/4,1/4) and (1/2,1/2,1/2) are occupied by Fe and Mn ions, respectively. Since (3/4,3/4,3/4) and (1/4,1/4,1/4) are equivalent sites and we could not determine the specific magnetic structure, we consider occupation 2 of the site (1/4,1/4,1/4), and ignored the occupation of site (3/4,3/4,3/4). The neutron scattering cross section of Mn and Fe ions are quite different for neutron experiments (1.75 and 11.22 barn respectively) and, therefore, it is possible to refine any chemical disorder in those sites. We assume here that Ga ions substitute Si into the site (0,0,0) and all refinements show that these two ions occupy only this site. The results of this study allow us to write the real composition of the compounds. Ga002: Fe2.03Mn0.97Ga0.04Si0.96, Ga012: Fe1.90Mn1.10Ga0.12Si0.88 and Ga050: Fe1.93Mn1.07Ga0.49Si0.51.
5. Density functional theory
In spite of the antiferromagnetic arrangement of Fe2MnSi, we have considered, for the present calculation, a parallel configuration among Mn ions, a situation that can be achieved under an extremely high magnetic field [21]. The calculated magnetic moments are 0.22  and 2.54
  for Fe and Mn, respectively. These values are in good agreement with other DFT methods, see [7] and [2]. In any case here, the primary goal is to ascertain the effects of disorder and how it affects the polarization, band gap and magnetization of this system. Remember, from the experimental results previously presented along this effort, we have concluded that the antiferromagnetic arrangement on Fe2MnSi-like compounds is not responsible for the Slater–Pauling deviation; but, instead, disorder is indeed responsible for this deviation.
From the experimental conclusion above placed (neutron powder diffraction data), in which there is no (detected) sp-3d swap; as well as, from [7], that vacancies and anti-sites have high formation energies, the present calculation then focus only on Fe–Mn swaps. The formation energy of a FeA,C-MnB swap is given by  , where Edis and Eord are the total energies of the disordered and ordered systems. Negative values indicate that the disordered state is more stable (the subscript
  represent the site in which the ion resides).
The present calculations considered the unit cell shown on figure 5; and figure 6(a) displays the calculated formation energies as a function of disorder concentration. We found an interesting effect in which the disorder promoted by Fe–Mn swap is favorable up to a threshold of 17%, above which disorder is no longer favorable. In addition, 7% of disorder promotes the lowest value of formation energy and therefore samples of Fe2MnSi may have a Fe–Mn disorder close to this value. To understand the mechanism behind this self-stopping effect, we have calculated the formation energies (for 3.125% of disorder) as a function of distance between the swapped atoms. For Fe–Mn atoms as far as 7.0 Å, the formation energy is −79 meV; but if the distance decreases to 2.80 Å, the formation energy increases to −6 meV—see figure 6(b). It can be deduced that, Fe–Mn swapped ions are stabilized by increasing distance, and this distance is optimized by the swap concentration. For high values of disorder concentration, it is no longer possible to keep Fe–Mn apart from each other and then the formation energy increases.
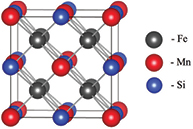
Figure 5. L21 crystal structure of Fe2MnSi full Heusler alloy.
Download figure:
Standard image High-resolution image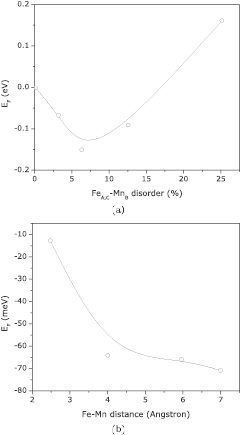
Figure 6. Formation energy (a) for FeA,C-MnB swaps and (c) as a function of Fe–Mn distance, considering 3.125% of disorder.
Download figure:
Standard image High-resolution image6. Influence of chemical disorder on the spin polarization: conclusions from DFT and neutron powder diffraction
The neutron powder diffraction allowed the estimation of the fraction of X and Y into their correct position. More precisely, Fe ions must be placed only on site (1/4,1/4,1/4), while Mn ions only on (1/2,1/2,1/2); these are presented on figure 7. Indeed, there are disorder into the system since (1/4,1/4,1/4) sites are not fully occupied with Fe ions; and other ions into this site can be either Mn or Si. The same effect occurs as well on (1/2,1/2,1/2), but regarding Mn.
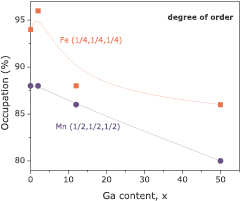
Figure 7. Occupation of Fe-(1/4,1/4,1/4) and Mn-(1/2,1/2,1/2) sites as a function of Ga-content. Note the increasing of disorder with Ga content.
Download figure:
Standard image High-resolution imageDFT calculations also ratifies the conclusion of the last paragraph, and thus on figure 8-left axis we show how disorder affects Fe2MnSi polarization, defined as  , where
  is the total density of states for spin up (down). As can be seen, Fe2MnSi (with parallel orientation of Mn–Mn ions), is fully polarized for the ordered state; however, increasing disorder, polarization is monotonically reduced. At 12% of disorder, which is comparable with the disorder found in our samples, the polarization is reduced by 10%—a value large enough to justify the deviation from the Slater–Pauling rule. The Fe2MnSi band gap is 0.55 eV, in good agreement with other calculations [7], and it is depicted, as a function of disorder, on figure 8-right axis. It is important to note that even the smallest amount of disorder is enough to promote a finite value of density of states at the Fermi level, since
  .
.
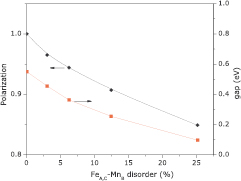
Figure 8. Left axis: polarization  , where
  is the total density of states for spin up (down). Right axis: DOS gap as a function of disorder. Both results are related to Fe2MnSi compound (with parallel orientation of Mn–Mn ions).
Download figure:
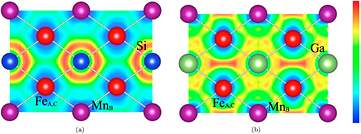
Standard image High-resolution imageAs mentioned earlier, from neutron powder diffraction data, we found that disorder increases with Ga content (see figure 7); this can be understood by considering the DFT calculations. To this purpose, we have considered the 2D electron localization function (ELF) [22], which can be used to qualitatively analyze the nature of the chemical bonds. Thus, figures 9(a) and (b) show the ELF projected onto the (1 1 0) plane of the L21 cubic structure for Fe2MnSi and Fe2MnGa, respectively. The electron distribution dramatically changes comparing these two compounds: the ELF for the former shows electrons more localized between the Fe(Mn)–Si bonds, which is indicative of a covalent character; while this picture for Fe2MnGa shows that electrons are concentrated at the Ga–Ga bonds, presenting then a weak hybridization between Fe(Mn) and Ga. The weaker Fe(Mn)–Ga bonding, in comparison to Fe(Mn)–Si bonding, contributes thus for a higher degree of Fe–Mn disorder as one introduce Ga.
Figure 9. Electron localization function (ELF) for (a) Fe2MnSi, where the electron localization is close to the Fe(Mn)–Si bond, and (b) Fe2MnGa, where the electron concentration is at the Ga–Ga bonds. From these results we conclude that Fe(Mn)–Ga bonding is weaker in comparison to the Fe(Mn)–Si one. On the qualitative colored scale on the right, red (blue) means the highest (lowest) probability to find the electron on that position.
Download figure:
Standard image High-resolution image
7. Conclusions
Fe2MnSi full Heusler alloy fails to follow the Slater–Pauling rule. This may be due to: (i) its antiferromagnetic arrangement at low temperature and/or (ii) chemical disorder. In order to fully understand the mechanism responsible for this deviation of the Slater–Pauling rule, we considered a similar compound, however, fully ferromagnetic: Fe2MnGa; and then some concentrations of Si/Ga substitution, namely Fe2MnSi0.98Ga0.02 (Ga002), Fe2MnSi0.88Ga0.12 (Ga012) and Fe2MnSi0.50Ga0.50 (Ga050). Remarkably, the spin-reorientation responsible for the antiferromagnetic arrangement at low temperatures is suppressed, at 50 kOe, for the Ga050 sample; but it still does not follow the Slater–Pauling rule. Thus, chemical disorder is the predominant factor promoting the observed deviation. Indeed, neutron powder diffraction measurements indicated that the degree of disorder increases by increasing Ga content; and density functional theory calculations show that the chemical disorder destroys the spin polarization of these Fe2MnSi-based Heusler alloys.
Acknowledgments
The authors thank Brazilian agencies CNPq, CAPES and FAPERJ for financial support. Portions of this research were conducted at ORNL's Spallation Neutron Source and the Center for Nanophase Materials Sciences. Both of these are sponsored by the Scientific User Facilities Division, Office of Basic Energy Sciences, US Department of Energy.