

Abstract
Understanding the nature and characteristics of the intrinsic defects and impurities in the dielectric barrier separating the ferromagnetic electrodes in a magnetic tunneling junction is of great importance for understanding the often observed 'barrier-breakdown' therein. In this connection, we present herein systematic experimental (SQUID and synchrotron-radiation-based x-ray absorption spectroscopy) and computational studies on the electronic and magnetic properties of Mg1−xFexO thin films. Our studies reveal: (i) defect aggregates comprised of basic and trimer units (Fe impurity coupled to 1 or 2 Mg vacancies) and (ii) existence of two competing magnetic orders, defect- and dopant-induced, with spin densities aligning anti-parallel if the trimer is present in the oxide matrix. These findings open up new avenues for designing tunneling barriers with high endurance and tunneling effect upon tuning the concentration/distribution of the two magnetic orders.
Export citation and abstract BibTeX RIS
1. Introduction
The ability to manipulate the spin of charge carriers has resulted in the giant magnetoresistance effect and magnetic tunnel junction (MTJ), and further realization of non-volatile magnetoresistive random access memories [1–4]. Among the oxide complexes with high dielectric constant, MgO based MTJs [2, 3, 5–7] are generally preferred since it enhances spin polarization of charge tunneling via an additional spin-filtering mechanism [3, 8]. Although many studies have been carried out on the functional properties of Fe/MgO/Fe MTJs, an understanding for the often observed barrier breakdown and how lattice defects radically modify the paradigm of wave function engineering in the Fe/MgO/Fe MTJs remains [9]. In light of MgO's intrinsically tunable magnetic properties (upon controlling the intrinsic lattice defect structure) [10–14] and high solubility of impurities elements, MgO offers an ideal platform for unraveling the interplay between the tunneling and magnetic (both defect- and dopant-induced) properties therein.
Intrinsic ferromagnetic oxides are different from dilute magnetic semiconductors (DMSs) in that impurities with partially occupied d- or f- shells are absent in the oxide matrix [10–14]. While the underlying mechanism for ferromagnetic ordering in intrinsic metal oxides is still under debate, reported studies widely suggest that a magnetic moment arises from the unpaired 2p electrons at oxygen sites surrounding a cation vacancy—wherein in the case of insulating rock-salt structured MgO, where each cation site is surrounded by an octahedron of O 2p, a magnetic moment up to ca. 1.5 μB/defect site can be attained [15–19].
Looking at dilute magnetic complexes, the mechanism for ferromagnetic ordering in this class of materials has (among other) been described by Zener- and bound magnetic polaron model [10, 20, 21]. Following comprehensive computational studies on the ground state magnetic configuration of CdMnTe, GaMnAs, ZnMnO and GaMnN, Dalpian and Wei have in [22] explained that the position of impurity (transition metal) d levels with respect to the valence band edge of the host semiconductor plays an important role in stabilizing ferromagnetism in DMSs. In the case of electron induced ferromagnetic ordering an expansion of exchange splitting of conduction band is required by, for example, reducing the symmetry as positive exchange splitting is small in semiconductors [22].
The low Curie temperature in DMSs may relate to the percolation limit of ferromagnetic coupling and dominated short-range magnetic exchange interaction between impurities [23, 24]. Moreover, superparamagnetic blocking phenomenon in wide bandgap DMSs promote relaxation time in magnetization process and the system shows hysteresis loop even when Curie temperature are suppressed by well separated spinodal decomposition clusters at low impurity concentration [24–26].
Although the magnetic properties of transition metal doped wideband gap oxide complexes have been widely investigated. The interplay between defect- and dopant-induced ferromagnetism and their combined contribution, given their concentration and intermittent distance, to the long range ferromagnetic ordering across, the otherwise diamagnetic, oxide matrix is to date not fully understood.
We present herein an in-depth experimental and theoretical study on the interplay between intrinsic lattice defects and 3d impurity ions and their impact on the magnetic ground states in Fe doped (0 to 4 at.% Fe) MgO thin films. Figure 1 illustrates how our experimental approach is suited for investigating the dynamics between the two magnetic entities (defect- and dopant-induced) at the interface between the dielectric oxide barrier and ferromagnetic electrodes in a MTJ. Specifically, it questions how the tunneling barrier height, which defines the tunneling probability of a particle with a certain wave function, scales with the magnetic properties of the dielectric barrier. Typically, the thickness of the oxide barrier in the MTJ doesn't exceed 3 nm. However, in order to ensure sample quality and reproducibility we have in this study chosen to grow (through inkjet printing technique) oxide complexes of 20 nm thickness [27]. The growth conditions have been optimized to allow higher magnetization by introducing lattice defect in the oxide matrix that favorably interact with the Fe impurity ions. Details on local variations in the magnetic and electronic properties were fingerprinted by combining experimental SQUID and synchrotron based soft x-ray absorption spectroscopy (XAS) with first-principles calculations performed within the density functional theory (DFT) using full potential projector augmented wave method as implemented in the VASP package [28, 29]. The combination of XAS and DFT calculations has previously been shown to be powerful for identifying ultra-dilute dopants in MgO [30].

Figure 1. Typical device structure of a magnetic tunneling junction comprised of a dielectric barrier sandwiched between two ferromagnetic electrodes. The schematic diagram highlights the possibility to improve the endurance and tunneling effect of the tunneling junction upon tuning/optimizing the concentration and distribution of the two magnetic orders: (i) defect- and (ii) dopant-induced in the oxide matrix that in turn may alter the magnitude of the magnetization of the tunneling barrier.
Download figure:
Standard image High-resolution image2. Experimental details
Mg1−xFexO ink were prepared by dissolving magnesium acetate tetrahydrate and Fe(OAc)2 in methoxyethanol, with [Fe2+]: ([Mg2+] + [Fe2+]) = 0, 0.5%, 1%, 2%, and 4%, respectively. Acetic acid was added to improve the solubility of acetates in methoxyethanol (total cation concentration of ink: 0.25 mol L−1). The intrinsic and Fe-doped MgO thin films were deposited on Si substrates at 80 °C by a inkjet-printer equipped with Xaar 126 drop-on-demand print-head (drop volume of 50 picoliter). Post deposition heat treatment was carried out in three steps to avoid undesirable/uncontrolled structural and phase transition: (i) as-printed films were cured at 120 °C for 10 min, followed by (ii) annealing at 450 °C for 2 h and (iii) annealing at 600 °C for 2 h.
The local compositional stoichiometry of the samples was confirmed by x-ray photoelectron spectroscopy (XPS PHI 5400 ESCA; AlKα, at 1400 eV) and energy dispersive x-ray spectroscopy (Oxford Inca EDXS on a dual-beam FIB/SEM system Nova 600 NanoLab and Oxford D7021 EDXS on a high-resolution Hitachi SEM S-3000 N), respectively [12]. The silicon substrates were found, prior to the depositions, to be purely diamagnetic both at liquid helium and room-temperature (confirmed by SQUID—Quantum Design MPMS2 Magnetometer), with no trace of any magnetic impurities. The film thickness was confirmed by cross-section analysis using a dual beam UHR SEM/FIB system, see figure S1 in supplementary (stacks.iop.org/JPhysCM/28/156002/mmedia). XRD analysis (SiemensD5000; CuKα:1.5406 Å) revealed (i) the thin film samples are predominantly amorphous, and (ii) Fe doping stabilizes a crystal phase (with growth along (200)), see figure S2 in supplementary.
3. Results and discussion
3.1. SQUID and soft x-ray spectroscopy analysis
Figure 2(a) presents field dependent magnetization loops for intrinsic and 4 at.% Fe doped MgO thin films (demonstrating an increase in the net magnetization by 690%). The observed variation in the saturation magnetization (Ms) with increasing dopant concentration from 0.7–4.86 emu cm−3, summarized in figure 2(b), indicates that the combined effect of dopants and intrinsic defects can contribute significantly toward both strengthening and deterioration of the long range ferromagnetic ordering (M(H) loops of all oxide samples are presented in figure S3 in the supplementary information)9. The oxide thin films showed low magnetic coercivity (ca. 17 Oe for x = 4 at.%), a typical soft magnetic behavior found for oxide ferromagnetic semiconductors. The diamagnetic term/background was determined from magnetic measurements on bare silicon substrates before the deposition and has been subtracted from all the samples. Given the sensitivity of the magnetic property and to avoid contamination with any uncontrolled magnetic impurity, all the magnetic measurements reported herein were carried out prior to any other characterization (XRD, elemental mapping and spectroscopy analysis).

Figure 2. SQUID analysis of the magnetic properties of intrinsic and Fe doped MgO thin films. (a) Typical room-temperature field dependent magnetization loops for the intrinsic and 4 at.% Fe doped MgO thin films, data have been corrected for the diamagnetic background arising from the Si substrate. (b) Variation in saturation magnetization with increasing Fe concentration (line is only a guide to the eye).
Download figure:
Standard image High-resolution imageXAS measurements were performed at beamline 6.3.1.2 and 8.0.1 at the Advanced Light Source at energy resolution 0.2 eV (O K-edge) and 0.4 eV (Mg K-edge), respectively. The XAS spectra were recorded in total electron yield detection mode (TEY) by measuring the sample drain photocurrent. The energy of the O K-edge spectra were calibrated using a standard TiO2 reference, while the energy of the Mg K-edge spectra were calibrated by comparing the relative energy position of the absorption edge in the intrinsic MgO to that reported in the literature [31].The O K-edge absorption spectra presented in figure 3(a) reflect oxygen 1s excitation into unoccupied O 2p states of MgO arising from atomic orbital hybridization of both the nearest and second nearest O–Mg (Fe) atoms [12, 32]. Spectral feature A and B are found to counteract in that A becomes more pronounced with increasing dopant concentration while B diminishes in intensity by the same. A detailed look into the lower energy (pre-edge) region of the 4 at.% Fe doped sample (inset figure 3(a)) confirms the existence of pre-edge feature A around 530 eV and shoulder feature B around 533 eV (separated by 2.7 eV). The post-edge spectral features (C-G), on the other hand, become more resolved with increasing dopant concentration whilst undergoing a spectral shift towards lower energies. This may be explained by the enhanced crystallinity of the oxides: (amorphous)MgO → (amorphous + crystalline)MgFeO, with increasing dopant concentration as confirmed by XRD analysis (figure S2 in the supplementary information)10.
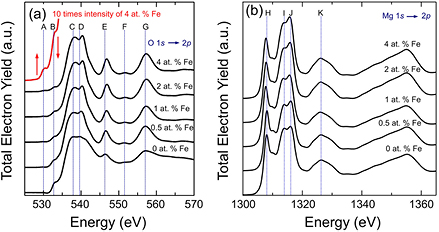
Figure 3. (a) Evolution in the local charge symmetry as a function of increasing Fe impurity concentration. O 1s XAS of intrinsic and Fe doped MgO thin films in the excitation range 525–570 eV. Inset: detailed presentation of the pre-edge energy region in the 4 at.% Fe doped sample (at ×10 magnification). (b) Corresponding features of Mg K-edge XAS including the atomic orbital hybridization from the neighboring O 2p orbitals (as indicated by features H–K).
Download figure:
Standard image High-resolution imageThe modest variations in Mg K-edge spectral features with increasing dopant concentration indicate that the oxygen symmetry surrounding the cation sites remains the same over the impurity concentration range considered herein (see figure 3(b)). These results are well in line with previous XAS studies on Mg1−xFexO reported by Liu et al which showed that the oxide complex sustains a cubic structure up to x = 0.5 above which it undergoes a transformation from cubic to spinel-like structure [33].
The typical O K-edge absorption spectrum of intrinsic Fe2O3 has 'twin-peaks' around 530 eV reflecting eg and t2g (separated by ca. 1.3 eV) that arise from 3d → eg, t2d crystal field splitting [34]. In this present case, the energy separation (Δ = 2.7 eV) between feature A and B in figure 3(a) concludes the absence of such crystal field splitting indicating that Fe is fully confined within the MgO matrix, i.e. it is fully diluted without formation of any FeO domains. Instead, insight on the origin of B can be obtained from the studies of charge compensation in cuprate superconductors where the holes compensating impurity charge lie in the unoccupied O 2p band, and energy difference (Δ) between the charge donor induced spectral feature and acceptor feature corresponds to a charge transfer gap, re-normalized by core-hole excitonic correlation [35–37]. This analogy suggests that O 2p–Fe 3d charge transfer to become more pronounced with increasing dopant concentrations, as O 2p acceptor states (at 533 eV) would be substantially reduced [12, 33].
3.2. Computational analysis
MgO supercells comprised of 216 atoms with periodic boundary condition were constructed to model the contribution of cation defects- and Fe impurities to the magnetic ordering in MgO. Both the internal atomic positions and lattice volume were considered in the structural relaxation process of each atomic configuration. For computations of crystalline MgO phase diagram, we refer to a comprehensive first principles study previously reported by Joshi et al [38]. Although the amorphous phase of MgO is not considered here, one can simulate the effect by starting from a crystalline MgO supercell and sampling atomic configuration space with random defects [39]. The self-consistency criteria in computations include 10−5 eV for electronic relaxation and 0.02 eV Å−1 for structural relaxation with a Γ-point only k-mesh. The energy cutoff for the plane-wave basis set was set to 520 eV. In DFT calculation, self-interaction correction (beyond local density approximation and generalized gradient approximation (GGA)) is important [40, 41]. Rotationally invariant DFT + Hubbard U (U = 6 eV) approach was employed for localized Fe d orbitals to improve accuracy in the projection of multi-electron systems [41, 42] and to identify ultra-dilute dopants in MgO [30].
Figure 4 presents the computed (on a Mg108−yFexO108 supercell) evolution in the electronic structure of MgO (O- and Mg-p partial densities of states—PDOSs) for various Fe dopant (x) and Mg vacancy (y) concentrations. As evident from figure 4(a), Mg vacancies induce strong localized unoccupied states closely above the Fermi energy. Further, upon Fe doping a pre-edge feature evolves (reflecting O-p and Fe-d orbital hybridization) around 2.5 eV which becomes more pronounced with increasing Fe doping. Note, this observation is comparable to feature A in figure 3(a). Spectral features in the energy range of 5–25 eV in figure 4(a) agree qualitatively with features B–F in figure 3(a). No additional dopant induced unoccupied states are observed in the Mg-p PDOS (figure 4(b)) in the energy range of 0–5 eV, and the overall spectral features correlate well with those in XAS (figure 3(b)).
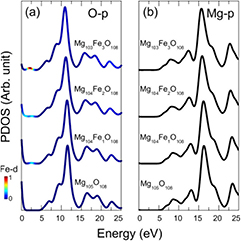
Figure 4. DFT partial densities of states of Mg105O108, Mg104Fe1O108, Mg104Fe2O108, and Mg103Fe3O108 supercells. (a) O-p PDOS with the strength of Fe-d orbital contribution presented in color and (b) Mg-p PDOS. A Gaussian smearing of 0.8 eV has been applied, and Fermi energy is set at 0 eV.
Download figure:
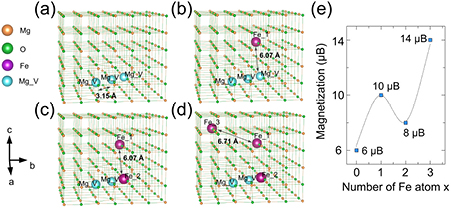
Standard image High-resolution imageFollowing detailed DFT calculations we found the cation vacancies and Fe impurity ion to induce a moment of 2 μB/vacancy (Mg107O108) site and 4 μB/ion (Mg107Fe1O108), respectively. The computed total spin densities in Mg108−yFexO108 resulted in a net magnetic moment ranging from 6 to 14 μB depending on the intermittent distance between the cation defects and impurity ions. The Mg105O108 supercell shown in figure 5(a) contains three Mg vacancies (Mg_V) with each two adjacent Mg vacancies separated by 3.15 Å. Since each Mg vacancy carries a magnetic moment of 2 μB the Mg105O108 supercell with no Mg vacancy cluster yields a total magnetic moment of 6 μB. In the Mg104Fe1O108 supercell with no Mg vacancy clusters, where the probability for a Fe ion to be close to a Mg vacancy is small, the net magnetic moment increases to 10 μB and is composed of magnetic contribution from both the lattice defects and the impurity ion (if a Fe impurity ion, Fe_1, is introduced at 6.07 Å from the outermost vacancy site as shown in figure 5(b)). However, in Mg104Fe2O108, the net magnetic moment is reduced to 8 μB if a second Fe impurity (at cation site 6.07 Å from Fe_1, as shown in figure 5(c)) forms a trimer with two Mg vacancies as suggested in [43]. In this case, the magnetic moment of Fe aligns anti-parallel to the moment induced by the O 2p states, and the antiferromagnetic coupling results in a negative spin density (figure S4 in the supplementary information). This trimer formation mechanism naturally explains the experimentally observed dip around 2 at.% Fe doping in figure 2(b). If a third impurity ion (6.71 Å away from Fe_1) is introduced (Mg103Fe3O108) its magnetic moment aligns parallel to that of other Fe impurities and contributes towards further strengthening of the net magnetization to 14 μB. Since the cation vacancy concentration in the system is finite, the effect of the two competitive magnetic phases becomes less pronounced with increasing impurity concentration, wherein the contribution from the impurity ions to the net magnetization starts dominating despite the small opposite magnetization of O atoms near the Mg vacancies. On the other hand, the net magnetization is expected to increase with increasing dopant concentration within the dilute doping region. Therefore, another critical doping level exists at higher Fe concentration that favors the formation of long-range antiferromagnetic order. However, this Fe concentration lies at a much higher doping concentration than the dilute doping region considered in this study. Figure 5(e) summarizes our theoretical findings and predicted variation of net magnetization in MgO with increasing Fe doping at different Mg vacancy concentrations.
Figure 5. Computed variation in the net magnetization in Mg108−yFexO108 with increasing Fe concentration. (a)–(d) The atomic configuration of Mg105O108, Mg104Fe1O108, Mg104Fe2O108, and Mg103Fe3O108 with Mg vacancies (labeled as Mg_V) and up to three Fe impurities, respectively. (e) The computed net magnetization of the Mg108−yFexO108 supercells for various Fe dopant (x) and Mg vacancy (y) concentration corresponding to (a)–(d) atomic configurations.
Download figure:
Standard image High-resolution image
4. Conclusion
Our study reveals defect aggregates comprised of basic and trimer units (Fe impurity coupled to Mg vacancies) and the existence of competing magnetic orders in the oxide matrix, with spin densities aligning anti-parallel. The two orders compete and interact with each other dynamically, and depending on their distribution across the oxide lattice and relative distance, a reduction or enhancement in net magnetization can be realized. This emphasizes the ability to control magnetic properties of dielectric barrier in MTJs by singly controlling the defect- and doping-induced ferromagnetism. Such approach offers significant advantages over introducing additional charge carriers (magnetic impurities) into the oxide lattice which may adversely affect the tunneling efficiency as electrical characteristics of dielectric barrier are altered. Detailed computational studies validate the robustness of the ferromagnetic phase in the intrinsic and doped oxide complexes and are consistent with the experimental findings on magnetic properties reported in figure 2 (SQUID) and figure 3 (XAS).
Acknowledgment
The ALS and NERSC are supported by the U.S. Department of Energy under Contract No. DE-AC02-05CH11231. MK acknowledges additional DOE funding support under Contract No. DE-SC0006931. The work at Northeastern University is supported by the US Department of Energy contract number DE-FG02-07ER46352, and benefited from Northeastern University's Advanced Scientific Computation Center (ASCC). M K acknowledges postdoctoral fellowships from the Swedish Research Council (VR) and Axel Hultgren's Memorial Fund. The authors would like to thank Wolfgang Voit for his help with establishing the ink-jet printing capability at KTH, and Roman Puzniak at the Institute of Physics (Warsaw, Poland) for his timely help with additional magnetic measurements of the thin film samples. The Work at KTH is supported by Carl Trygger's foundation, Hero-M Center of Excellence, and Swedish Agency VINNOVA. MF acknowledges the Chinese foundation CSC for a doctoral study scholarship. H L acknowledges the Singapore National Research Foundation for support under NRF Award No. NRF-NRFF2013-03.
Footnotes
- 9
See supplemental material at (stacks.iop.org/JPhysCM/28/156002/mmedia) for figure S1: high resolution cross-section SEM image of the Fe doped MgO thin film, figure S2: XRD pattern of the Fe doped MgO thin films, figure S3: variation in the magnetization in the intrinsic and Fe doped MgO thin films as a function of increasing externally applied magnetic field, figure S4: the total energy of an Fe dopant and two Mg vacancies as function of their distance.
- 10
See footnote 9.