

Abstract
DNA is known to condense with multivalent cations and positively charged proteins. However, the properties and energetics of DNA superstructures, such as chromatin, are poorly understood. As a model system, we investigate histone H1 condensation of DNA with tethered particle motion and force-extension measurements. We show that after the addition of H1 to DNA, a concentration dependent lag time is followed by the DNA spontaneously condensing. The trigger for this condensation phase transition can be modeled as sufficient H1s having bound to the DNA, providing insight into the 30 nm fiber condensation upon H1 binding. Furthermore, optical tweezers force-extension measurements of histone H1 condensed DNA reveals a sequence of state transitions corresponding to the unwinding of superhelical turns. We determine the complete, experimental, multi-state free energy landscape for the complex using Crooks fluctuation theorem. The measured force-versus-extension and free energy landscape are compared to predictions from a simple, theoretical model. This work encourages the theoretical description of DNA/protein structure and energetics and their role in chromatin and other, more complex, systems.
Export citation and abstract BibTeX RIS
1. Introduction
Charged semiflexible polymers interacting with multivalent counterions collapse into toroidal condensates. This phenomenon has been observed for DNA complexed with a variety of counterions [1–13], including H1, for actin [14, 15] and for xanthan [16]. Such toroids have also been found in theoretical and simulational studies of semiflexible polymers with self-attraction [17–22] and in simulations of charged polymers in the presence of explicit counterions [23, 24]. Nature routinely exploits DNA condensation via positively-charged proteins. For example, eukaryotic cells package DNA, via various histone proteins, into a hierarchy of superstructures called chromatin. More specifically, the addition of histone H1 leads to the formation of the superhelical chromatin 30 nm-fiber [25]. Understanding the energetics of DNA/protein superstructures would allow for better models of DNA/protein condensation leading to a better understanding DNA packaging and regulation in general.
We measure the condensation transition of DNA upon the introduction of histone H1. We find that as the DNA incubates in histone H1-containing buffer, no change in the mean or standard deviation of the extension is observed until a sudden condensation event occurs. We measure this effect for a range of H1 concentrations and find that the time until this condensation event occurs (the lag time) increases with decreasing H1 concentration. This observation leads to the suggestion that the spontaneous condensation event is triggered by a sufficient number of H1s becoming bound to the DNA. This provides an intriguing possibility for 30 nm fiber condensation [25]: The transition of a region of DNA from condensed to decondensed could be controlled by a few H1s regulating the equilibrium state, providing a 'switch' for gene control.
We then investigate the response of this condensed structure to force. We present force-versus-extension curves, obtained using optical tweezers [22, 26–28], of a 4200 base-pair segment of DNA complexed with linker histone H1 [2, 29, 30]. We show that DNA-H1 forms a superhelical toroid, a cartoon of which is shown in figure 1.
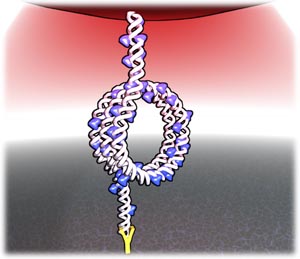
Figure 1. Cartoon of a
 -turn DNA (white) toroid decorated by histone H1 (blue). A 4200 bp DNA's anti-digoxygenin- functionalized 5' end is attached by a digoxigenin-anti-digoxigenen bond toa digoxigenin coated glass slide (bottom). The DNA's biotin-functionalized 3' end is attached by a streptavidin-biotin bond to a streptavidin-coated polystyrene bead (large sphere at top). An optical trap (red) pulls the structure in the axial direction, perpendicular to the glass slide. Force-versus-extension measurements are made by moving the glass coverslip away from and towards the trap-center, respectively pulling and relaxing the DNA-protein structure.
Download figure:
Standard image High-resolution imageFigure 1 shows DNA (white) decorated by H1 (blue) with the structure condensed into a superhelical toroid. Some of the DNA is not in the toroid, as it is being restrained by the coverslip and the optical trap pulling on the bead. The DNA:H1 toroid structure shown has similar properties to the nucleosome—the energetic cost of DNA bending is offset by DNA:histone contacts. The difference between the toroid and the nucleosome is that for the nucleosome, the DNA binds to the core histones at the center of the structure, sterically limiting the number of turns. In the case of the H1 toroid, the histones are spread along the DNA, resulting in no limit to the number of turns. H1-DNA toroids resist tension up to about 1.2 pN, but then shrinks in radius, releasing a length of unwound DNA, until the bending energy of the tighter radius becomes too great, at which point one turn of the superhelix suddenly unravels, simultaneously relaxing the radius. With increasing extension, successive transitions occur, each involving the loss of one turn, except at the last, where
 -turns are lost. Thus, we observe a sequence of transitions between superhelical states, distinguished by different numbers of turns. Within each state, we establish the experimental force-versus-extension relation. Hence, measurements of DNA protein complexes are capable of measuring energy and structure. In addition, we employ Crooks fluctuation theorem (CFT) [31–34] to determine the free energy differences between states, and, thus, the multi-state free energy landscape of a superhelical toroid for the first time. In addition, we compare the force-versus-extension and the free energy landscape to predictions from a simple model of a superhelical toroid.
2. Methods
2.1. Tethered bead samples
A flow cell was incubated for 1 h with an antidigoxigenin containing buffer of 100 mM NaCl, 100 mM NaP and 20 µg mL−1 antidoxigenin (Sigma Aldrich). The antidigoxigenin non-specifically binds to the coverslip. One milliliter of wash buffer (100 mM NaCl, 100 mM NaP, 0.1% Tween, 1 mg mL−1 non-fat dry milk, ∼0.05 mg mL−1 Sodium Azide) was flowed into the flow-cell and incubated for one hour. This process coats the surface with casein to prevent bead sticking. A bead and DNA solution of streptavidin-coated, 1.26 μ m-diameter microspheres (Spherotech) at 20 fM and 10 pM 4200 basepair DNA with biotin and digoxigenin labels at opposite ends in wash buffer is then incubated for one to 20 h. Before use, the samples were rinsed by flowing 2 mL of wash buffer to remove unattached beads. Video microscopy with particle tracking identified beads singly-tethered to the flow-cell's coverslip by observation of their Brownian motion.
2.2. Purification of mouse histone H1
The pet-11d vector containing wild-type mouse H10 was obtained from Professor Jeff Hansen. The H1 containing vector was transformed into E. coli BL21 cells and induced with 0.6 M IPTG (American Bioanalytical) at an OD of 0.6. The induced cells were grown for an additional 4 hours, then harvested and centrifuged. The pellet was resuspended in a lysis buffer (25 mM Tris HCl, 2.5 mM EDTA, 1 M NaCl) and sonicated. Cellular debris was centrifuged while H1 remained soluble in the supernatant. The supernatant was diluted to 300 mM NaCl using a no salt buffer (25 mM Tris HCl, 2.5 mM EDTA). This causes a precipitant to form containing DNA and histone H1. The precipitant was centrifuged and resuspended in 8 M urea. The H1 dissolves but the DNA does not and the DNA is centrifuged away. The supernatant containing H1 was placed on a HiTrap SP HP column. This was washed with 8 M urea plus 300 mM NaCl and eluted with 8 M urea plus 600 mM NaCl. Elution was then dialyzed into PBS (0.01 M phosphate buffer, 0.0027 M KCl and 0.137 M NaCl) pH 7.3.
2.3. Histone H1: DNA condensation lag time measurement
Fluid flow into the observation flow cell was driven at a constant rate by a computer controlled syringe pump (Harvard Apparatus, Micro-Liter OEM Syringe Pump Modules), inducing a viscous force on the bead proportional to the flow velocity [35] and consequently extending the DNA molecule [36, 37]. The dead-time of our microfluidics flow cell, namely the time between flowing in buffer and the arrival time of buffer at the viewing location, was calibrated using food coloring, the presence of which strongly affects the total light intensity viewed in the microscope. Fluid mechanics dictates a higher flow rate at the center of the channel than at the coverslip surface and hence uncertainty about when liquid arrives at the tether. To minimize this uncertainty, high flow rates were used initially to compress all delays as much as possible. At the flow rates used in these measurements, when a new buffer was introduced, the total intensity of the microscope image transitioned quickly (in less than 1 s), permitting us to approximate the arrival of a H1 as essentially instantaneous. Twenty seconds after the introduction of the protein, the flow speed was reduced to a rate corresponding to a viscous force of 0.3 pN, applied to the bead and thus the DNA. This force was chosen to minimally perturb the DNA while at the same time providing readout of the DNA's length more simply and more rapidly than tethered particle motion without flow. Throughout the period of flow, the bead's position was monitored via video microscopy and tracked in software [38].
2.4. Force extension measurements
All force-extension measurements were carried out in the presence of 1.5 µM histone H1. Prior to the introduction of H1, a singly tethered bead was centered in the optical trap by means of a piezo-stage (NanoMAX 311, Thorlabs) and held in a non-condensed state by means of a force in the axial direction of about ∼1 pN [39, 40]. Using an axial pulling geometry minimizes the possibility of bead-coverslip or DNA-coverslip interactions in condensed states. The calibration was performed with a previously published method [40], where power spectrum measurements are taken over the range of coverslip displacements used during the measurement and the background signal dependence on coverslip displacement is measured and accounted for. Histone H1 at 1.5 µM was introduce as described above. After other beads on the screen were observed to condense, the trapped bead, still held uncondensed by our optical tweezers trapping beam, was re-centered above its tether attachment point. Force-versus-extension measurements were then performed repeatedly by moving the piezoelectric stage back and forth in the axial direction at a constant speed of 500 nm s−1.
3. Results
3.1. DNA condensation after addition of histone H1
Images from an example DNA condensation measurement with matching cartoon interpretations are shown in figure 2. Before the introduction of H1, the bead performs Brownian motion constrained by its tethering DNA, shown in figure 2(a) with the cartoon depicting the many positions available for the bead. Once the flow is introduced, the DNA is extended by the flow force on the bead, as shown in figure 2(b). After some time, in spite of the flow pushing the bead to the right, the bead spontaneously moves to the left, seen in figure 2(c). A red marker at the same position in figures 2(b) and (c) highlights the difference in bead position between these two images. To quantify the condensation behavior, we tracked the bead's position in each frame of a movie of the condensation measurement, such as those shown in figure 2.

Figure 2. Bead images viewed through a 100× microscope (left) and corresponding cartoons (right), during H1-induced condensation under flow. (a) The bead undergoes Brownian motion, constrained by its DNA tether, corresponding to times before −40 s in figure 3. The cartoon shows the multiplicity of positions available to the bead in the absence of flow. (b) Flow is initiated and the bead is pushed to the right by the viscous flow force, corresponding to times after −40 s in figure 3. The cartoon shows the bead pushed to the right as a result of the flow. (c) The DNA condenses, causing the bead to be pulled back towards the DNA's tether site, corresponding to times after the sharp decreases in bead position in figure 3. The cartoon shows condensed DNA with a relatively small residual tether length.
Download figure:
Standard image High-resolution image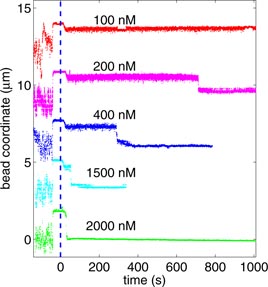
Figure 3. Typical tracking data for the bead coordinate versus time before and after the introduction of H1, for several concentrations of H1. For clarity, traces are displaced relative to each other by 3 µm. At early times—i.e. before H1 is introduced into the flow cell—Brownian motion constrained by the DNA is observed. At −40 s, a syringe pump introduces a flow of H1 solution which results in a sudden increase in extension and a reduction in Brownian motion. At 0 s, the H1 solution enters the flow cell. Multiple flow-cell volumes of H1 solution are flowed through the flow cell until the flow is stopped at 20 s, ensuring complete turnover of the solution surrounding the tether of interest. Except for the 100 nM H1 concentration trace (red), which does not show condensation during the times shown, the bead moves to the DNA's tether site after a concentration dependent lag time.
Download figure:
Standard image High-resolution imageFigure 3 shows several example tracking measurements during DNA condensation obtained for H1 concentrations from 100 nM to 2 µM. The bead coordinate is the tracked position of the bead in the x or left-to-right direction. Focusing on the 200 nM example trace, shown in purple in figure 3, it can be seen that at early times the bead performs Brownian motion over a range of ∼2 µm. At −40 s, a high flow is introduced to quickly deliver the new histone H1-containing buffer. The vertical, blue, dashed line at 0 s represents the time at which the new buffer was calibrated to arrive at the tether. The flow is reduced at 20 s, resulting in a small decrease in bead-coordinate and a noticeable increase in the variance of the bead coordinate. Because the bead is now under less force, it is less constrained and Brownian motions occur over a greater range of extensions. As the bead incubates in H1-containing buffer, there is no noticeable change in the the bead coordinate's mean or variance until the DNA suddenly condenses at ∼700 s for the 400 nm H1 case.
Similarly, for all concentrations greater than 100 nM, after a concentration dependent lag time, there is a sharp decrease in the bead coordinate, as each bead studied returns to approximately its mean position before the introduction of flow. This observation implies that the length of the DNA is drastically reduced in a condensed state, as shown in the cartoon of figure 2(c). The lag time is taken as the time from when the H1 reached the tether (0 s) to the time of the condensation event, with the latter time defined to be the first tracked bead position that lies outside the preceding, measured position distribution by more than seven standard deviations.
These condensation transitions occur either as a single abrupt event, over a time of ∼0.5 s—a 'sharp' transition—or as a series of similarly abrupt, but smaller, steps—a 'stepped' transition. Examples of both types of transition can be seen in figure 4, where the bead coordinates of three condensation events are shown, measured in the same movie at an H1 concentration of 400 nM.

Figure 4. Three tracked beads' coordinates versus time for condensation events observed at an H1 concentration of 400 nM, measured at a movie frame rate of 5 frames per second. Condensation events display both 'sharp' and 'stepped' events. 'Sharp' condensation events, such as the top and bottom traces, are complete within 1 s. 'Stepped' condensation events, such as the middle trace, show a pause at an intermediate length, before undergoing full condensation. In spite of these bead measurements being in the same sample during the same flow event, clearly the condensation times vary from ∼290 to ∼330 s.
Download figure:
Standard image High-resolution image4. Simple H1-DNA binding model for condensation
As shown in figure 5 for concentrations less than about 500 nM H1, the time to condensation (tc) appears approximately inversely proportional to the H1 concentration. This observation suggests a simple model for H1-induced condensation of DNA in this concentration range, namely that H1 binding is a Poisson process and that condensation occurs only after a critical number (Nc) of H1 binding events have occurred.
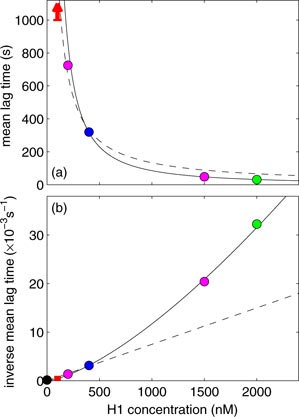
Figure 5. The mean lag time (a) and the inverse of the mean lag time (b) with respect to concentration of H1. Color code matches figure 3. For 100 nM H1, a condensation event was not seen during the measurement for 1000 s. This time is treated as a lower bound for the condensation time and is shown as an arrow in (a) and as a bar in (b). Beads at [H1] = 0 nM have been observed to not condense for 5 h, giving a similar lower bound for the lag time. A linear fit (dashed line) agrees at low concentrations, whereas a quadratic fit (solid line) shows agreement at all concentrations.
Download figure:
Standard image High-resolution imageIn this model, H1 molecules bind to DNA at an on-rate equal to kon [H1], where [H1] is the H1 concentration and kon is the H1-DNA association rate constant. In our simple model, we neglect the off rate. If the on rate (kon [H1]) is much greater than the off rate, koff, the DNA will transition to a toroid before any H1s have a chance to unbind. A more significant H1 off rate would manifest itself in longer transition times than predicted at low concentrations of H1. Measurement of these times would allow for an estimation of koff. However, at low concentrations, we observe no evidence for deviation from linear behavior, as can be seen in figure 5. We infer therefore that koff is too small to be measured in these experiments and is well-approximated by zero. For simplicity, koff is neglected from our discussion. Condensation occurs after Nc H1 molecules become bound at a lag time of tc. These quantities are then related via

or

Thus, this simple model is consistent with an inverse relationship between the lag time, tc and the concentration of H1, [H1].
Because H1 binding is assumed to be a Poisson process, the variance in the number of binding events in tc is also equal to Nc, i.e.
 . Thus, we may expect the variance in the lag time to be approximately

It follows that the ratio of the square of the mean lag time to the variance in the lag time is approximately
Thus, we may obtain an experimental estimate for Nc by measuring lag times. For example, using five measurements of the condensation time obtained at an H1 concentration of 400 nM, which were measured at the same time in the same microscope screen, we determine a mean lag time of 314 ± 7 s and a variance of 553 ± 260 s2. This result suggests that 178 ± 63 or greater molecules of H1 must bind to the DNA in order for condensation to occur. At higher H1 concentrations than 400 nM, evidently the data (figure 5) deviate from a linear relationship between inverse lag time and concentration. This observation suggests that H1 binding may show cooperativity at larger H1 concentrations. In fact, the solid curve in figure 5 is the best fit to a quadratic. The cooperativity mentioned here is an increased binding rate of H1 due to the concentration of H1 in solution. The mechanistic origin of this cooperativity is unknown.
4.1. DNA-H1 toroid force-versus-extension
We now investigate this structure with force-versus-extension measurements using optical tweezers. A representative force-versus-extension trace, obtained for naked DNA, is shown in figure 6(a). This trace is consistent with the worm-like chain (WLC) model [22, 26–28], illustrated as the solid black line, which shows forces less than 0.4 pN to extensions of 1000 nm. The fluctuations in figure 6(a) are the result of Brownian motion within the optical trap. However, in the presence of 1.5 µM histone H1 (figures 6(b)–(e)), the DNA-H1 complex shows a non-zero force of about 1.2 pN, from zero extension up to about 1100 nm, previously referred to as the plateau region [26], even though the force is not strictly constant. Beyond 1100 nm, the force-versus-extension of DNA-H1 is indistinguishable from that of naked DNA at comparable extensions. A key feature of the plateau region is the presence of a number of sudden jumps in force-extension, in addition to Brownian fluctuations. Similar features were reported in earlier studies of the force-versus-extension of DNA in the presence of other multivalent cations [22, 26, 27], but not fully understood.
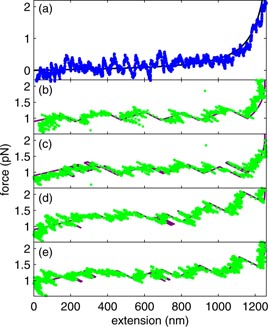
Figure 6. Example force-versus-extension traces for a 4200-base-pair fragment of DNA. (a) Blue circles correspond to a force-versus-extension trace, obtained for pulling naked DNA. The black line is the worm-like chain (WLC) model for a contour and persistence lengths of 1390 nm and 42 nm, respectively. (b)–(e) Green circles correspond to individual force-versus-extension traces, obtained in the presence of histone H1 for decreasing extension (b and c) and increasing extension (d and e). The purple lines through these data correspond to the model described in the text.
Download figure:
Standard image High-resolution imageIn individual traces, jumps occur at slightly different extensions and forces and are of slightly different lengths. However, a regular pattern emerges from a two-dimensional, false-color histogram of the number of times a particular force-extension pair is realized in the ensemble of measurements, as shown in figure 7(a). Figures 7(b) and (c) show the histogram for pulling only and relaxing only, respectively. It is especially clear from figures 7(b) and (c) that the force-extension distribution shows six distinct regions of high probability—six states—both for pulling and for relaxing. Six states can also be seen in the summed distribution of figure 7(a), but, because of overlaps, somewhat less distinctly. To quantify the force-versus-extension for each putative state, we fit a quadratic polynomial to the collected force-versus-extension traces in the neighborhood of the state in question. The best fit curves, including the transitions between states, determined as described below, are shown as the black curves in each of figures 7(a)–(c) and provide a good description of the most probable force-versus-extension.
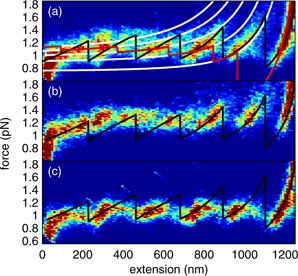
Figure 7. False-color force-extension histograms. (a) Histogram for pulling and relaxing traces, using 0.015 pN × 11 nm bins. Each bin is colored according to the number of counts, with blue, teal, yellow and red for 0, 22, 32 and 50+ counts, respectively. The black, stepwise curve (reproduced in (b) and (c)) is the experimentally- determined force-versus-extension curve for the experimentally- determined minimum-free-energy state. The white curves are the force-versus-extension curves for states with (from left to right)
 ,
,
 ,
,
 ,
,
 and
and 0 superhelical turns, according to the theoretical model described in the text. The red, stepwise curve corresponds to the throretical force-versus-extension curve for the theoretical minimum free energy state. The parameter values used to generate the red and white curves were LC = 1390 nm, which is the contour length for 4200 bp DNA, ε0 = −0.9 pN and κ = 200 pN nm−1, which is the bending modulus of naked DNA. (b) Histogram for the pulling traces, with magnitudes doubled. (c) Histogram for the relaxing traces only, with magnitudes doubled.
and
and 0 superhelical turns, according to the theoretical model described in the text. The red, stepwise curve corresponds to the throretical force-versus-extension curve for the theoretical minimum free energy state. The parameter values used to generate the red and white curves were LC = 1390 nm, which is the contour length for 4200 bp DNA, ε0 = −0.9 pN and κ = 200 pN nm−1, which is the bending modulus of naked DNA. (b) Histogram for the pulling traces, with magnitudes doubled. (c) Histogram for the relaxing traces only, with magnitudes doubled.
Download figure:
Standard image High-resolution imageTo investigate whether individual traces can be described in terms of states, we implemented a simple algorithm that assigns each point on an experimental trace to the state corresponding to the nearest quadratic fit. The results of this procedure are shown as the purple lines in figures 6(b)–(e). Although Brownian fluctuations add noise, individual experimental force-versus-extension traces are generally consistent with the state model. All together, our results support the hypothesis that there are six states sampled sequentially during each pulling and relaxing cycle. Back-stepping, or returning to the previous state for a brief time, is observed, such as in figure 6(c) at 1100 nm extension, further bolstering the claim of reversible states.
We have developed a simple model, that permits us to interpret the observed states and to describe the experimental force-versus-extension curves semi-quantitatively. Our starting point, based on the previous observation of H1 toroids [41], is the expression, adapted from reference [42], for the free energy (F) of a histone DNA-H1 complex, partially wound into a helical toroid, while the remaining, unwound DNA-H1 is stretched to an extension x:
where LC is the DNA-H1 contour length, κ is the bending modulus of DNA-H1, R is the helical toroid's radius, H is its helical pitch,
 , α is one half of the winding angle of the DNA-H1 in the toroid, β is the toroid tilting angle [42], f is the force-versus-extension of unwound DNA-H1 of length LC−2αR and ε0 is the DNA-H1 self interaction energy per unit length, which is the only way that H1 enters the model. The periodic terms in equation (5) lead to minima in F spaced in α by integer multiples of π [42]. An analysis of equation (5) reveals that, for a range of realistic parameter values (κ ≃ 200 pN nm−1, f ≃ 1.2 pN, R ≃ 30 nm, R ≫ H/2π), minima in F occur near
 where n is an integer. Accordingly, in order to achieve an analytically tractable result, we approximate equation (5) as

Equation (6) explains the states observed experimentally: different states correspond to different, discrete values of n. To predict the extensions at which each state is realized and the corresponding force-versus-extension curve, we determined the value of R that minimizes equation (6) for each value of n. Between jumps, the superhelix shrinks in radius, thus releasing DNA, permitting the extension to increase. This minimum free energy (Fn) determines the force-versus-extension for the
 -turn state via fn = −dFn/dx. The forces, fn are shown in figure 7(a) as the white curves, which correspond to n = 6, 5, 4, 3 and 2 from top to bottom. The value of fn for the state with the lowest free-energy is highlighted in red. Finally, the rightmost red curve shows the WLC result for completely unwound DNA-H1 (n = 0). For these and a range of nearby parameter values, the state corresponding to n = 1 is not the lowest free energy state at any extension and therefore we do not plot its force-versus-extension. This means that when the DNA condenses from the fully extended state in these measurements, the DNA condenses directly to the
 -turn state, not the
 -turn state.
There are important features in common between the experimental (black) and theoretical (white and red) force-versus-extension curves in figure 7: Both show six states and the transitions between them. The theoretical curves (white) also overlap with the high probability regions of the experimental force-extension histograms. On this basis, we identify the sequence of states realized experimentally for increasing extension as n = 6, 5, 4, 3, 2 and 0, as given by theory. For toroids in which the DNA packs hexagonally across the toroid's cross-section, the force required to unravel one turn is predicted to increase about threefold as the number of turns in the toroid increases from two to seven, as a result of the increasing number of strand-strand contacts per turn in this range [22]. However, our measurements show that the unwinding force is approximately constant. We conclude that 4200 base-pair DNA-H1 is not hexagonal in cross-section, but rather forms a superhelix with only one additional contact for each additional turn.
One important difference between experiment and theory, however, is that the slopes of the force-versus-extension curves are predicted to be smaller than observed, except for the
-turn state. As the number of turns (n) increases and the extension decreases, the model diverges further and further from experiment. At low extension and high n, the model predicts that the DNA is almost entirely in the form of a toroid. Increasing extension results in the toroid shrinking in radius and releasing DNA. The experimental data suggests that the toroid is more resistant to changing radius under force than our model predicts. Possibly, the linear free energy reduction with increasing DNA in the toroid (the first term of equation (6)) is too simplified; one might expect higher order interactions than simply nearest neighbor for bound DNAs. Secondly, recent measurements of DNA bending have found that high bending angles occur at a much higher frequency than the worm-like chain model would predict [43, 44]. Another difference between experiment and theory is that each state is predicted to be stable at a smaller extension than is found experimentally, suggesting that the toroid free energies are actually lower relative to the free energy of the 0-turn state than given by equation (6). Most likely, the energy of bending the DNA into a toroid is overestimated by the worm-like chain model [43, 44], the second term of equation (6). Because the bending free energy of DNA and the interaction free energy of multiple DNAs is unknown, we use the simplest models available and achieve semi-quantitative agreement.
4.2. Determination of experimental toroid free energy
Recently, methods have been developed to determine free energy differences on the basis of force-versus-extension measurements [31–34]. For the distribution of the work (W) required to go from one state to another, Crooks Fluctuation Theorem (CFT) [31] informs us that

where ΔF is the free energy difference between the two states, PF(W) is the probability distribution of the work in the forward direction and PR(W) is the probability distribution of the work in the reverse direction. It follows that ΔF is given by the value of W at which PF(W) is equal to PR(−W).
To measure the work involved in transitioning from one state m to the next state m − 1 for each trial, we first designated a fiducial extension for each state, corresponding to the extension of maximum state occupancy. Thus, these extensions correspond closely to the peaks in the histogram of figure 7(a). The following analysis determines the free energy difference between neighboring states at the extensions of the fiducial markers. We obtained the work by properly integrating the area under each experimental force trace that starts in state m at its fiducial extension and finishes in state m − 1 at its fiducial extension. (The work that must be used in applying the CFT is correctly determined by integrating under the experimental force-versus-stage-extension curve [34].) The work for the reverse transition was obtained similarly, but starting in state m − 1 and finishing in state m. The integration may be carried out either by integrating the data directly (green traces in figure 6) or by integrating the state fits (purple traces in figure 6) (in hope of reducing the effect of Brownian noise). In fact, both procedures yield similar results for the probability distributions of the work.
Figures 8(a)–(e) shows the work distribution for each of the five transitions. Shown in green is the distribution obtained on pulling [PF(W)]; in red is that for relaxing [PR(−W)]. In every case, the two distributions overlap. For convenience, we fitted the distributions to Gaussian functions, shown as the solid black lines in figure 8. We then identified the work at the crossing point as the free energy difference between the two states in question. Thus, application of CFT determines experimentally the free energy differences: F5 − F6 = 331 pN nm. F4 − F5 = 243 pN nm, F3 − F4 = 255 pN nm, F2 − F3 = 230 pN nm and F0 − F2 = 314 pN nm. Given a value for F0, the free energy of each state at its fiducial extension follows immediately. These results are summarized in figure 9, assuming F0 = 224 pN nm at 1249 nm, marked as the open square in the figure.
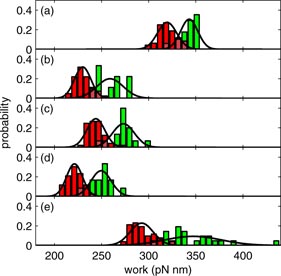
Figure 8. Probability distributions of the work, obtained, using the state fits, on pulling [PF(W), green] and relaxing [PR(−W), red] for the transitions between (a) the n = 6 and n = 5 states, (b) the n = 5 and n = 4 states, (c) the n = 4 and n = 3 states, (d) the n = 3 and n = 2 states and (e) the n = 2 and n = 0 states. The solid lines are Gaussian fits to these distributions.
Download figure:
Standard image High-resolution image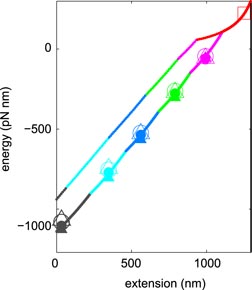
Figure 9. Experimental and theoretical free energy landscapes plotted versus tether extension. Free energies at fiducial extensions found using CFT are plotted as solid and open circles in the case that the state fits and raw data were used to evaluate the work, respectively. The fiducial unwound state with a free energy of 224 pN nm at 1249 nm is shown as the open square. The solid (dashed) line shows the experimental (theoretical) lowest free energy curve with the red, magenta, green, blue, cyan and purple sections corresponding to the range of extensions within which the zero,
,
,
,
and
-turn state, respectively, exhibits the lowest free energy.
Download figure:
Standard image High-resolution image
The solid and open circles in figure 9 correspond to the free energy determined from the state fits and data traces, respectively. Clearly, both free energy estimates agree.
With the free energy of each state known at its fiducial extension, the free energy at any extension can be found by integrating the state's quadratic fit from the fiducial extension to the extension of interest. The minimum free energy curve so-obtained is shown as the solid line in figure 9. The red, magenta, green, blue, cyan and purple sections correspond to the range of extensions within which the zero,
,
,
,
and
-turn state, respectively, exhibits the lowest free energy. This curve is the helical toroid's complete, experimentally-determined, free energy landscape. The steps in the black curve of figure 7 correspond to the extensions at which the lowest free energy state transitions from one value of n to another. Shown in figure 9 as the dotted lines is the theoretical minimum free energy, according to equation (6). Again, the red, magenta, green, blue, cyan and purple sections of this curve correspond to the range of extensions within which the zero,
,
,
,
and
-turn state, respectively, shows the lowest free energy theoretically. Although we chose the value of the DNA-H1 self interaction energy per unit length (ε0 = −0.9 pN) to reproduce the experimental plateau force, the corresponding theoretical free energy (using the same value of ε0) may be seen to be significantly higher than our experimentally determined free energy.
5. Discussion
We have shown that DNA condenses spontaneously once sufficient H1 has bound. The reason a large lag time was measurable in these experiments and has not been observed previously is that H1 is much larger than molecules typically used in these experiments, such as spermidine and cobalt hexamine [1–13] and therefore has a much longer binding time. We investigated the condensation transition over a range of concentrations. Not only was a lag time measured, but a distribution of lag times, allowing us to determine the number of kinetic events that make the transition possible. The variance of the lag time was quite large, giving a standard deviation roughly 10% of the mean lag time. This number of events, 178 ± 63 H1 binding events, is particularly interesting. DNA has empirically been found to condense when 90% of the DNA's charge is neutralized [45]. Knowing this and the charge of the DNA and H1, the number of H1s necessary to condense the DNA can be estimated. DNA has a charge of e−1 per phosphate, or e−2 per base-pair, while H1 has a charge of e+50. The strand of DNA in this experiment is 4200 base-pairs and would therefore require 151 H1s to condense DNA. This prediction is within error of our determined number of H1s. Taking DNA condensation as a model for higher order condensation transitions, such as 30 nm fiber condensation, a small number of H1 binding events controlling the transition would provide a 'switch' for gene regulation. The uniform coating of H1 on DNA results in uniform DNA:DNA interactions. If the DNA were to form an extended hairpin-like structure, then the unwinding force would be expected to be constant with changes in extension. However, the DNA forms an n-turn toroid, which allows more DNA:DNA interactions than a hairpin. As the n-turn toroid is stretched, the radius decreases and the force increases as DNA is released similar to pulling on a garden hose wrapped in a loop. This change in length with stretching gives a continuous change in force. However, when the energy to shrink the toroid further becomes too great, instead of shrinking the toroid, a discrete transition occurs releasing a full loop of DNA.
We also investigate the response of this condensed structure with optical tweezers. By averaging multiple pull-relax cycles, measurements of the force-versus-extension of DNA complexed with linker histone H1 reveal a multi-state system with a sequence of transitions between superhelical states, distinguished by different numbers of superhelical turns. Comparison of the measured force-versus-extension to the predictions of a simple theoretical model of a superhelical toroid reveals semi-quantitative agreement. In addition, Crooks fluctuation theorem was used to find experimentally the free energy differences between states containing different numbers of turns and thus the complete free energy landscape of the DNA-H1 complex, which was also compared to theoretical predictions. In this case, using parameters that yielded reasonable agreement between the experimental and theoretical plateau forces, namely ε0 = 0.9 pN nm and κ = 200 pN nm−1, there are noticeable discrepancies between the experimental and theoretical free energies. Therefore, to accurately account for our measurements, an improved theoretical description is needed.
Acknowledgments
We thank E Dufresne, K Herbert, R Ilagan, P Koo, C O'Hern and N Read for enlightening discussions and D Rhodes and J Hansen for reagents. We acknowledge the NSF via PHY 1305509, the Raymond and Beverly Sackler Institute for Biological, Physical and Engineering Sciences and the Yale Institute for Nanoscience and Quantum Engineering for support. DJS was supported by an NSF Graduate Fellowship.