
Abstract
The characterization of hydration water in proteins is important to understand their structure, function and folding properties. A calculation of the shape parameters reveals considerable asymmetry in the shapes of globular proteins. The present study suggests a generalized approach for the calculation of radial distribution of hydration water by accounting for the shape asymmetry in proteins. The surface and radial distribution function is analyzed for three groups of high resolution globular proteins and nonglobular proteins. This generalized approach depicts a considerable difference in the hydration water distribution pattern around aspherical proteins as compared to the earlier method and this difference is more pronounced for nonglobular proteins. The peaks for normalized RDF are found to be sharper compared to those of bulk water. The normalized RDF of hydration water exactly coincides with that of the bulk beyond 8.0 Å. The radial distribution of hydration water as a function of the water–protein distance matches with the experimentally observed distribution of hydration water around myoglobin. The results reveal that the distribution of hydration water is dependent on the shapes of proteins and hence a generalized approach should be used for the calculation of hydration water distribution around proteins, especially for nonglobular proteins.
Export citation and abstract BibTeX RIS
1. Introduction
Understanding the role of water in a protein's interior is important in unraveling the complexities that govern folding, structure, dynamics and functional specificity of proteins [1, 2]. While bound water molecules occupy the internal cavities and stabilize the structure of a protein by extensive internal protein hydrogen bonding, hydration water is approximately the first layer of water molecules that exhibits a heterogenous dynamics due to interaction with both the solvent-exposed protein atoms and the topological irregularities of the protein surface [3, 4]. Thus, hydration water participates in various processes, which include enzyme catalysis [5], protein folding and dynamics [6, 7], protein–protein recognition [8, 9] and drug design studies [10]. Despite the importance of water in biomolecules, the characterization of hydration water is a challenging task for both experiments and simulations. Evidences from x-ray crystallography [11, 12], NMR [13], neutron scattering [14], dielectric relaxation [15, 16], magnetic resonance dispersion [17], time-resolved fluorescence [18] and molecular simulations [19, 20] have probed the detailed atomic resolution and structure of hydration water on the protein surface. These studies reveal that the structure, diffusion rates, concentration and intramolecular vibration modes of hydration water are distinctly different from that of bulk water, which is far away from the protein surface and has no interactions with the protein [21].
Hydration water on protein surfaces may be detected in high-resolution (∼1.0 Å) crystal structures of proteins, while bulk water is mobile and highly delocalized throughout the protein. Thus, experimentally it is difficult to observe and characterize hydration water against a prominent background of bulk water. However, an accurate description of the surface/local properties of water is mandatory for differentiating the structure and dynamics of hydration water from that of the bulk. Computationally, this is reflected in a wide variety of water models such as TIP3P [22], TIP4P [23], TIP5P [24], SPC [25] and SPC/E [26], none of which correctly describes the physico-chemical properties of hydration water. Molecular Dynamics (MD) simulations are thus limited by i) the need of improved models to represent appropriate potential functions for the hydration water and ii) the availability of computational resources. In this context, crystal structures of proteins may provide a suitable input to investigate the structural properties of hydration water. The structure of hydration water may be investigated from the surface distribution function (SDF) and radial distribution function (RDF) of water. The SDF provides a direct measure of the local density of water around the protein surface [27], while the RDF gives the distance-dependent density of water relative to a particular water molecule. Earlier studies on the hydration water distribution have neglected the shapes of proteins and considered all proteins to be spherical. However, an analysis of the shape parameter reveal a considerable degree of spatial anisotropy in globular proteins [28]. In this article, we evaluate the distribution of hydration water molecules for the globular and nonglobular proteins. These proteins are classified into four different groups based on the shape parameters i) the asphericity parameter, Δ, which is a measure of the average deviation from the spherical symmetry and ii) the shape tensor, S, which provides the overall shape of a protein. Compared to the earlier approach, the results of this study depict a considerably different hydration water distribution pattern for aspherical globular proteins, while the distributions are identical for those that are spherical or approximately spherical. Thus the distribution pattern of hydration water is dependent on the shape of proteins.
2. Materials and methods
The x-ray crystal structure of 398 high resolution proteins are compiled from the Protein Data Bank (PDB). The structure of simple monoatomic liquids, in which the molecules are treated as particles interacting via a spherically symmetric potential function, may be characterized in terms of pair distribution function or radial distribution function, g(r). ρbg(r)dr is the probability of finding a second particle in the volume element dr provided a particle is located at r. This probability is given by [29, 30]
where N represents the total number of particles, ρb is the bulk density and 4π r2dr denotes the spherical volume element. The pair distribution function, g(r) may be viewed as the factor which is multiplied with the bulk density to give a local density about a particle as

The probability of finding molecules between r and r + dr about a central molecule may be calculated using equations (1) and (2) as
where n is the number of molecules between r and r + dr. Thus, the pair distribution function, g(r) may be represented in terms of the local density, ρ(r), about a central molecule which is expressed as
2.1. Surface distribution function
The surface distribution function (SDF) for hydration water around protein is related to the average density of water molecules around the protein surface and may be calculated by considering the protein atoms at the center and finding the density of water molecules around the protein surface at a water–protein distance, l. Earlier studies on the distribution of water considered proteins to be spherical [31], but an analysis of the shape parameters suggests considerable asymmetry in the shapes of globular proteins [28]. Single chain or multi-chain proteins with spherical shape are few in number; most globular proteins are either oblate or prolate. Thus, the average number density of surface water molecules as a function of the water–protein distance i.e. SDF may be expressed as
where, a, b and c are the three principal semi-axis lengths of the inertial ellipsoid, which characterizes the shape of a given protein. The characteristic inertial ellipsoid is defined as an ellipsoid whose principal moments of inertia and principal axes coincide with that of the protein [32]. This inertial ellipsoid may be defined in terms of the inertial tensor, T [28]
where, N is the total number of atoms in a given protein, riβ denotes the βth component of position coordinates of the ith atom in three-dimensional space and β, γ = x, y, z. The eigenvalues, λi, are calculated from the inertial tensor, which defines the values of the three semi axis lengths of the inertial ellipsoid and are related as  , where αi = a, b, c [33]. The density of the spherical shell is obtained as a special case with a = b = c. The eigenvalues obtained from the inertial tensor may be used to calculate the asphericity parameter, Δ and the shape tensor, S, which collectively characterize the shape of a given protein. The asphericity parameter that gives the average deviation from spherical symmetry of a protein may be calculated as [28, 34]
where d is the dimensionality of the space. For d = 3
where  . I is the unit tensor and
  is the mean eigenvalue of the inertia tensor defined as,
The value of Δ denotes the average deviation from spherical symmetry and varies between 0 implying a spherical shape, (when a = b = c) and 1 implying a rodlike shape (when a = b = 0). The shape tensor, S, determines the prolateness or oblateness of a protein and is given by [28, 34]
or
The positive value of S denotes a prolate shape and negative implies an oblate shape. The S value ranges from −0.25 for a perfect oblate shape (a = b > c) to 2.0 implying a perfect prolate shape (a = b < c).
2.2. Radial distribution function
The radial distribution function (RDF) may be related to the density of water molecules as a function of the water–water distance. The raw RDF i.e. average number density of water molecules around a tagged water molecule is given by
where nww is the number of water molecules in shell of thickness drw around a tagged water molecule; rw denotes the distance between the oxygen atom of the tagged water molecule and any other water molecule.  gives the raw distribution of water (i.e. actual number of water molecules around a tagged water molecule) and is related to the water–water interactions. The interactions between the protein atoms and the surface water modifies the distribution of surface water, which is different from that of the bulk water, where only water–water interactions are considered. The presence of the protein molecule restricts the volume occupied by water molecules near the protein surface and alters the normalized density as compared to that of the bulk water. The raw counts of water molecules within each radial shell are converted into an expected value for the raw RDF. The density normalization factor of water as a result of water–protein interactions may be calculated by dividing each shell into infinitesimal volume elements (cells) and density of water for each shell around the tagged water molecule may be expressed as
where ncell represents the number of cells in each shell around the tagged water molecule; li is the distance of ith cell from the protein surface (as shown by l1, l2, l3 etc. in figure 1) and ρwp(li) is the density of water due to water–protein interactions (SDF) in the ith cell at a distance of li from the protein surface. The term ρwp(li) is averaged over the total number of cells present in a shell to give the density normalization factor of water for a shell around the tagged water. Both the raw RDF and the density normalization factor are averaged over the number of water molecules in each crystal structure and the total number of crystal structures as
where P is the total number of crystal structures in a data set and Wp gives the total number of water molecules in protein p. The normalized radial distribution function (normalized RDF) may be represented in terms of the relative density of water, calculated as

Figure 1. Pictorial representation for the calculation of density normalization factor of water. l1, l2, l3 etc. represent the distance of each cell in a shell (which is at a distance of rw from the tagged water molecule) from the protein surface.
Download figure:
Standard image High-resolution image3. Results and discussions
Hydration water in the vicinity of proteins are visualized by high-resolution cryogenic x-ray crystallography. A data set comprised of 398 proteins, obtained from the Protein Data Bank (PDB) [35] with the resolution of ⩽1.0 Å is chosen to analyze the distribution of hydration water around the globular proteins. In x-ray crystallographic structures each water molecule has an occupancy index, with a maximum value of 1.0, implying the presence of water in the protein, while an occupancy factor less than 1.0 indicates the absence of that water in some of the protein molecules. This work on the distribution of hydration water considers the sum of the occupancy for each water molecule rather than counting the actual number of water molecules. The distribution of the shape tensor, S and the asphericity parameter, Δ for 398 high resolution globular proteins is illustrated in figures 2(a) and (b) respectively. We find that 17.6% of these proteins have S value from 0 to 0.01 with spherical shapes, S values of 33.9% of proteins ranges between 0.01 to 0.1 and 21.4% of proteins have S values greater than 0.1. Distribution of Δ values shows that 59.5% of proteins have Δ values less than 0.1 and 39.5% of proteins have a Δ value greater than 0.1. These results indicate that most globular proteins are predominantly prolate, while some are spherical. This is in accord with the earlier findings [28]. To investigate the effect of shape on the distribution of water molecules on the surface of a protein, the chosen data set of globular proteins are classified into three groups depending on the shape parameters, S and Δ. These groups are: (i) Group I comprises of 143 proteins, which are approximately spherical with −0.01 ⩽ S < 0.01 and Δ ⩽ 0.1, (ii) Group II consists of 54 proteins which are marginally prolate, with 0.1 < S ⩽ 0.35 and 0.1 < Δ ⩽ 0.3 and (iii) Group III comprises of 25 proteins, which are mostly prolate with S > 0.35 and Δ > 0.3. Oblate-shaped proteins are less in this data set.
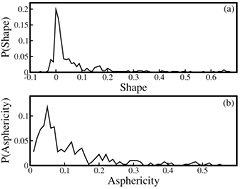
Figure 2. Distribution of (a) the shape tensor, S, and (b) the asphericity parameter, Δ for 398 high resolution globular proteins.
Download figure:
Standard image High-resolution imageNonglobular proteins: Apart from these three groups of proteins, an additional data set comprised of 117 nonglobular proteins is compiled from the PDB. Since very few nonglobular proteins have been characterized at atomic resolution, the resolution of these proteins is low (i.e. between 1 and 2 Å). The asphericity of proteins in this data set is Δ ⩾ 0.6.
For a set of 105 high resolution globular proteins [31], the SDF of water calculated as a function of the water–protein distance is valid only for proteins with perfectly spherical shapes or with negligible deviations from the spherical symmetry. Even the data set of 105 high resolution globular proteins includes few proteins which deviate from the spherical shape as is observed from S and Δ values. For example, 1HJE (S = 1.18 and Δ = 0.71), 1ETM (S = 0.64 and Δ = 0.52), 1OB4 (S = 0.94 and Δ = 0.63), 1OB7 (S = 0.63 and Δ = 0.51) and few others are with S > 0.2 and Δ > 0.1. However, for proteins of arbitrary shapes, the surface distribution of water may be calculated accurately by considering the shape of the protein in terms of the characteristic inertial ellipsoid. Thus this generalized approach may be extended to include spherical proteins where all the three axes of the ellipsoid are equal. Throughout this article, the method outlined by Chen et al is referred to as the earlier approach, while our calculation procedure is termed as the generalized approach.
The average number density of water molecules is plotted in figure S1 of the supplementary material (stacks.iop.org/JPhysCM/26/335102/mmedia) as a function of water–protein distance for Group I proteins. The density of the water molecules around the protein surface is calculated by both the earlier approach and the generalized approach. The radial density profile for the water–protein distance from 3.2 Å to 4.1 Å is magnified in the inset of the figure. Group I proteins display identical water density for both methods. Since the proteins are mostly spherical, all three axes of the characteristic ellipsoid (a, b, c) of Group I proteins are equal. The radial distribution of water is also evaluated as a function of the water–water distance to validate the applicability of the generalized approach for analyzing the water distribution of globular proteins. The raw distribution and density normalization factor of water are plotted as a function of the water–water distance (RDF) for Group I proteins in figure S2 of the supplementary material (stacks.iop.org/JPhysCM/26/335102/mmedia). Since the raw RDF gives the raw count of water molecules within each radial shell of water with respect to a tagged water molecule and is related to the water–water interactions, it is independent of the shape of protein and constitutes a universal feature of the protein solvation. However, the density normalization factor originates from the water–protein interactions and is calculated from the SDF for both approaches. Group I proteins do not show any difference in their density for both approaches. Both SDF and the normalized RDF show identical water density for both approaches as depicted in figures S1 and S2 of the supplementary material (stacks.iop.org/JPhysCM/26/335102/mmedia). This suggests that the results from the generalized approach matches well with those of the earlier one for proteins which are either perfectly spherical or have negligible deviations from the spherical symmetry.
To explore the difference in the distribution of water molecules caused by the asphericity of proteins, the SDF and RDF of Group II, Group III and nonglobular proteins are evaluated. Figure S3 of the supplementary material (stacks.iop.org/JPhysCM/26/335102/mmedia), figures 3(a) and (b) compares the water density calculated using the earlier approach and the generalized approach as a function of the water–protein distance for Group II, Group III and the nonglobular proteins, respectively. The density range corresponding to 3.2–4.1 Å of the water–protein distance is magnified in the insets of the respective figures so that the difference in density for the second shell around the protein surface may be clearly noted. The water density for Group II, Group III and the nonglobular proteins is found to be considerably different in the generalized approach as compared to the earlier one. The SDF for Group II, Group III and the nonglobular proteins depicts two maxima at the radial distances of 2.75 Å and 3.65 Å due to hydrogen bonding between the water molecules and the polar atoms of the protein and van der Waals interactions between the proteins and the water molecules respectively. But the number density of water is found to be less in the earlier approach as compared to the generalized approach. The observed difference in density arises because of the different number of water molecules present in spherical and ellipsoidal shells.
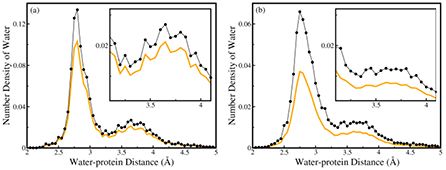
Figure 3. The density of water as a function of water–protein distance for (a) Group III and (b) nonglobular proteins, calculated using earlier approach (orange line) and generalized approach (black dotted line). In the insets of (a) and (b), the number density of water ranging from 3.2 Å to 4.1 Å water–protein distance is magnified.
Download figure:
Standard image High-resolution imageThe number density of the water molecules is larger in the ellipsoidal shell as the ellipsoidal shell accounts for the actual number of water molecules present at a particular distance from the protein surface. From figure 4, it may be noted that an ellipsoidal shell around a prolate-shaped protein characterizes the exact volume and the density of water at its surface, while a spherical shell underestimates the density of water at the same distance from the surface of the protein. It may be observed from figure 4, that at regions where the spherical shell intersects with the ellipsoidal shell, the earlier approach accounts for the actual density of water only at those overlapped sections. In all other regions of the same shell, it counts the water molecules which are actually present at higher distances the from protein surface. Since at higher distances, especially greater than 4 Å from the protein surface, the number of water molecules is less, the earlier approach leads to a reduced density of water molecules. The difference in density is more pronounced in the case of the nonglobular proteins (figure 3(b)), which record maximum deviation from the symmetrical spherical shape. The figure shows that distribution of hydration water in the vicinity of protein surface is underestimated by the earlier approach. Since most globular proteins are not spherical, the shape asymmetry of proteins should be taken into account for analyzing the distribution of water near the protein surface.
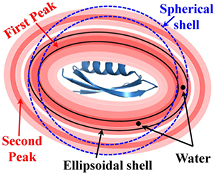
Figure 4. Schematic representation of the spherical and the ellipsoidal shells around a protein having prolate shape. Water distribution around prolate-shaped protein is presented in red color where intensity of red color is related to the density of water around protein surface. The higher the intensity, the higher the density of water. The darkest colored region near the surface corresponds to the first peak in the SDF and the second darkest colored region represents the second peak in the SDF. To validate the accuracy of the generalized approach over the earlier approach, two water molecules (just for example) are shown in black color at the same distances from the protein surface. The ellipsoidal shell accounts for both water molecules for the calculation of SDF, while the spherical shell accounts for only one water molecule.
Download figure:
Standard image High-resolution imageThe normalized RDF for the nonglobular proteins is compared to that of pure bulk water in figure 5. From the figure it is evident that although the maxima and minima appear at the same water–water distance, peaks for hydration water are relatively sharper compared to those found in the crystal structures. Previous studies [31, 36] on the distribution of bulk water reveals that hydration water behaves like pure bulk water beyond 8.0 Å where the normalized density approaches 1.0. Interestingly, the generalized approach reproduces this result, while the earlier approach reveals a different behavior of the density distribution function, as compared to pure bulk water.

Figure 5. Normalized RDF of water in Group III proteins (black line) calculated using generalized approach and the RDF for pure bulk water at 298 K (orange dashed line) [36].
Download figure:
Standard image High-resolution imageThe shape of the protein affects the radial distribution function of water, especially notable for Group II and Group III proteins. Since the raw RDF is related to the water–water interactions only, the raw distribution of water is independent of the shape of the protein and constitutes an universal feature of the protein solvation. However, the raw distribution of water should be modified because of the presence of the protein molecules causing water–protein interactions. A density normalization factor is introduced for this modification, which depends on the SDF of water around the protein surface. Thus shapes of proteins play a significant role in the calculation of the density normalization factor and hence affect the normalized RDF of water. The raw density of water and the density normalization factor is plotted as a function of the water–water distance for the earlier approach and the generalized approach in figure S4(a) of the supplementary material (stacks.iop.org/JPhysCM/26/335102/mmedia) and figure 6(a) for Group II and Group III proteins, respectively. The inset of the respective figures highlights the difference in the density for the water–water distance range 6–10 Å. The figures indicate that the density normalization factor for the RDF is different for both approaches. This difference is more pronounced for Group III proteins where deviation in shape is more compared to that of the Group II proteins. The earlier approach does not account for the shape asymmetry of proteins and hence underestimates the number density of water resulting from water–protein interactions. This results in a lower density normalization factor for the earlier approach as is evident from the figure S4(a) of the supplementary material (stacks.iop.org/JPhysCM/26/335102/mmedia) and figure 6(a).

Figure 6. (a) Raw RDF (blue line) and density normalization factor calculated using earlier approach (orange line) and generalized approach (black dots) for Group III proteins; (b) normalized RDF calculated using earlier approach (orange line) and generalized approach (black dotted line) for Group III proteins. Inset figures of (a) and (b) magnify the density of water ranging from 6 Å to 10 Å water–water distance.
Download figure:
Standard image High-resolution imageThe normalized RDF is obtained from the ratio of the raw RDF and the density normalization factor. The normalized RDF of water for Group II and Group III proteins is calculated and plotted in figure S4(b) of the supplementary material (stacks.iop.org/JPhysCM/26/335102/mmedia) and figure 6(b) respectively. The first peak arises due to the interactions between the oxygen atom of water and the hydrogen bond acceptor groups on the protein surface, while the second peak is due to the interactions between the water molecules with the non-hydrogen atoms of the protein. The location of the second peak specifically depends on the type of the protein atom. The density of the water molecules is calculated from the earlier approach and the generalized approach as a function of the water–water distance. The difference in the value of the normalized RDF in the water–water distance range 6–10 Å is highlighted in the inset of figure S4(b) of the supplementary material (stacks.iop.org/JPhysCM/26/335102/mmedia) and figure 6(b).
To explore the effect of shape on the radial distribution function, raw RDF and the normalized RDF for the nonglobular proteins are plotted in figure 7. Nonglobular proteins exhibit maximum deviation from the spherical shape thus depicting a notable difference between the earlier and the generalized approach. The earlier approach underestimates the number density of water resulting from water–protein interactions and hence shows a lower density normalization factor for the nonglobular proteins. The normalized value of the density of water should be 1.0 at higher distances. The earlier approach reveals a higher value of the normalized density compared to the generalized approach. This confirms that the shape of the protein is an important factor for the estimation of the distribution of hydration water around the protein surface and hence should be taken into account during the calculation.
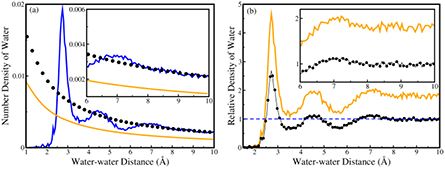
Figure 7. (a) Raw RDF (blue line) and density normalization factor calculated using earlier approach (orange line) and generalized approach (black dots) for nonglobular proteins; (b) normalized RDF calculated using earlier approach (orange line) and generalized approach (black dotted line) for nonglobular proteins. Inset figures of (a) and (b) magnify the density of water ranging from 6 Å to 10 Å water–water distance.
Download figure:
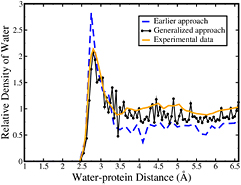
Standard image High-resolution imageThe radial distribution function as a function of water–protein distance is calculated for myoglobin (S = −0.03 and Δ = 0.088) using earlier and generalized approach and compared with the experimental data of radial distribution function [37] in figure 8. The radial distribution function calculated using the generalized approach is found to agree with that obtained from the experiments, while the earlier approach shows a different water distribution as compared to the generalized approach and the experimentally obtained data. Figure 8 depicts a higher value for first peak in earlier approach, while beyond water–protein distances of 3.5 Å the earlier approach shows decreased relative density of water as compared to the generalized approach and the experimental data. Density fluctuations are observed because distribution profile is analyzed for a single protein and this density is not averaged over a set of proteins. This study presents a generalized procedure for calculating the SDF and RDF of hydration water in the vicinity of proteins of any arbitrary shape.
Figure 8. Radial distribution function as a function of distance of water from protein surface calculated using earlier approach (blue dashed line), generalized approach (black dotted line) and obtained from experimental data of myoglobin [37] (orange line).
Download figure:
Standard image High-resolution image
4. Conclusions
Globular proteins form maximally compact structures and hence their shapes are expected to be mostly spherical. However, a calculation of the shape parameters, S and Δ reveals a considerable asymmetry in the shapes of globular proteins. In the present study, we propose a generalized approach to calculate the distribution of hydration water around proteins by explicitly accounting for their shapes. The SDF and RDF of hydration water around high resolution globular and nonglobular proteins, are evaluated as a function of water–protein and water–water distances, respectively, using both the approaches. The results indicate that the earlier approach does not account for the shape asymmetry of proteins and hence underestimates the number density of water molecules around proteins. The generalized approach exhibits a different water distribution pattern around aspherical proteins compared to the earlier approach, and this difference increases with the increase in deviation from the spherical symmetry. Comparison of the RDF for hydration water and bulk water reveals that the normalized RDF of hydration water depicts maxima and minima at the same water–water distance as that of bulk water but the amplitude and sharpness of these peaks is more for hydration water. Beyond 8.0 Å the normalized RDF of hydration water calculated using the generalized approach depicts the same density as that of the RDF of bulk water, while the normalized RDF calculated using the earlier approach fails to reproduce the density of bulk water at water–water higher distances. The distribution of water around myoglobin protein calculated using the generalized approach is found to match with the experimental data. Since the earlier approach does not account for the spatial anisotropy in proteins, the generalized approach provides an exact method for the calculation of the distribution of hydration water around proteins of arbitrary shapes. The present study may help in calculation of the water distribution pattern around proteins of arbitrary shapes and hence in developing accurate models of hydration water near the protein surface.
Acknowledgments
The authors gratefully acknowledge the Delhi University Research Grant for financial assistance. P Rani acknowledges the University Grants Commission, India for providing financial support in the form of a Senior Research Fellowship.