
Abstract
Sodium niobate (NaNbO3, or NNO) is known to be antiferroelectric at temperatures between 45 and 753 K. Here we show experimentally the presence of the ferroelectric phase at temperatures between 100 and 830 K in the NNO crystals obtained by top-seeded solution growth. The ferroelectric phase and new phase transitions are evidenced using a combination of thermo-optical studies by variable angle spectroscopic ellipsometry, Raman spectroscopy analysis, and photoelectron emission microscopy. The possibility for strain-induced ferroelectricity in NNO is suggested.
Export citation and abstract BibTeX RIS
1. Introduction
The discovery of very promising piezoelectric properties in perovskite-type solid solutions of (K,Na)(Nb,Ta)O3 has enabled the development of technologically important lead-free piezoelectrics and stimulated renewed scientific interest to the end members of these solutions including NaNbO3 (NNO) [1]. Although NNO belongs to a family of ABO3-type perovskite-structure ferroelectrics (FEs), it is antiferroelectric (AFE) in the broad range of temperatures between 45 (250) and 753 K [2–4]. The temperature of the FE phase transition varies from 45 to 250 K depending on the direction of the temperature change. In contrast to the usual phase transition from the high-temperature cubic centro-symmetric paraelectric (PE) phase to the low-temperature FE phase with lower crystal symmetry (e.g. tetragonal), experienced by normal FEs on cooling, NNO exhibits a sequence of 6 phase transitions between 7 phases. Additionally to the well-documented PE U-, T1-, T2-, and S-phases, AFE R- and P-phases, and FE N-phase, the presence of a metastable incommensurate (INC) phase at 410–460 K, of a monoclinic Pm phase at 250–410 K, a FE Q-phase below 410 K, a quantum PE phase below 200 K, and the coexistence of the FE N-phase with the AFE P-phase below 245 K have been reported [5–9]. Besides this uncertainty, the phase transitions in NNO are sensitive to synthesis routes and size of crystals [10–18].
In contrast to normal FEs (such as e.g. BaTiO3), all NNO phases below 913 K involve oxygen octahedral rotations or tilts. The detailed recent studies have shown that at room temperature, instead of the monoclinic Pm phase, the AFE orthorhombic P-phase with space group Pbcm can coexist with the polar orthorhombic Q-phase with space group P21ma [19, 20]. The Pbcm polymorph has a tilt system with three independent tilts (a−a−b+/a−a−b−/a−a−b+) leading to a 2 × 2 × 4 supercell of the basic perovskite subcell. The P21ma polymorph exhibits a simpler octahedral tilt system leading to a smaller 2 × 2 × 2 unit cell. A compound octahedral tilt system has been found for the S-phase, and two possible structural models have been suggested for the R-phase differing only in the tilt systems [21].
The complexity of the phase transitions, the coexistence of polymorphs and difficulties in determining their exact structure are closely connected to delicate differences between tilt schemes in NNO. It is worth mentioning that theoretical studies of the influence of tilts on ferroelectricity in perovskites are at the very beginning [22, 23]. In contrast to a common belief that the tilts can destroy FE order, it is shown that the FE order is rather destroyed by the A-site antipolar displacements, which influence the tilts [22]. The experimentally observed disappearance of FE behavior in the A-site doped NNO is in line with these conclusions [12].
Our experiments indicate the existence of the FE phase in the temperature range of 100–830 K and show the presence of the FE domains in high-purity top-seeded solution grown NNO crystals. The phase transitions and the existence of the FE phase are identified by inspecting thermo-optical behavior using variable angle spectroscopic ellipsometry (VASE). The phase transitions revealed by VASE are confirmed by Raman spectroscopy. The presence of the FE domains is confirmed using photoelectron emission microscopy (PEEM). We suggest that the FE order in the NNO crystals can be stabilized due to the presence of thermal strain.
2. Experimental details
The NNO single crystals were grown by top-seeded solution growth (TSSG) using Na2O−Nb2O5 melts. According to the Na2O−Nb2O5 phase diagram [24], for the composition [0.36(Nb2O5) + 0.64(Na2O)] (i.e. with a 28 mol% excess of Na2O with respect to stoichiometric NNO), growth of NNO crystals is possible at a liquidus temperature of 1373 K. Our TSSG experiments using such a composition indicated that the actual nucleation temperature was about 100 K higher. The crystals were grown in air from 200 g of melt placed in a platinum crucible (volume of 100 ml) and using cooling at a rate of 0.05−0.15 K h−1 over a temperature interval of about 30 K. The final cooling to room temperature was realized at a rate of 15 K h−1. The seeds could be obtained after a few runs. The resulting crystals were colorless, with sizes to 5 × 5 × 5 mm3. Due to the nature of the Na2O flux used in the present work, it should be noted that no foreign ions are introduced into the high-temperature solution and thus into the grown NaNbO3 crystals. Residual impurities originating from the starting materials, the crucible and the ceramics in the furnace are typically at a level of 10 ppm.
The randomly oriented surface of the crystals was epitaxially polished in order to perform accurate optical, Raman and electron spectroscopy measurements. The optical properties of the crystals were studied by variable angle spectroscopic ellipsometry (VASE) on a J A Woollam ellipsometer working in the range of photon energies 0.75–9.0 eV. The ellipsometric angles were measured in the reflection mode at different angles of incidence. The measured spectra were analyzed using a WVASE32 software package [23]. The generalized multioscillator isotropic model was employed. The optical constants were determined as a function of photon energy at several fixed temperatures, and the region of transparency of NNO was defined. The temperature dependence of the index of refraction n(T) was investigated using a fixed photon energy (2 eV) located in the transparency region of NNO. These thermo-optical studies were carried out during thermal cycling in the temperature range of 300–973 K. For comparison and as a reference, thermo-optical behavior of BaTiO3 crystal was inspected.
The Raman spectra were measured using a RENISHAW Raman microspectrometer RM1000 equipped with grating filter (NeXT) to block the Rayleigh scattering close to the exciting line. The radiation (line of 514.5 nm, power ∼5 mW) from the Ar laser was focused to ∼4 μm spot on the sample surface and used for excitation. For temperature measurements the sample was placed in a Linkam cell (300–700 K) or in a He cryostat (100–300 K). The heating and/or cooling ramp was <5 K min−1 with a dwell time of about 5 min before each measurement. The total temperature range was 100–700 K and the spectra were recorded in steps of 20 K. Care was taken to collect the Raman signal from the same spot at all temperatures.
The spectra were then carefully fitted with a sum of independent harmonic oscillators amplitude Aj, frequency ωj and FWHM γj, multiplied by the corresponding Stokes temperature factor:
The energy-filtered photoelectron emission microscopy(PEEM) mode of the NanoESCA instrument (Omicron NanoTechnology GmbH) at the SAFMAT centre, Institute of Physics, was used in order to directly verify the presence of the FE phase and the FE domains in the NNO crystal. The photoelectrons of various kinetic energies were excited by a UV lamp (Hg, line 5.2 eV). The PEEM images were taken with an energy filter set to a fixed kinetic energy. This enhanced the spatial contrast of electron counts, which depends on the variation of the work function on the surface.
3. Results and discussion
3.1. Thermo-optical behavior
The index of refraction n in the transparency range of perovskite-structure FEs is known to be extremely sensitive to changes in crystal structure and FE polarization in these materials. The studies of temperature dependence n(T), or thermo-optical behavior, can thus reveal both the structural phase transitions and the presence of polarization. This is illustrated in the inset in figure 1, where n(T) obtained on cooling in a crystal of the classical FE BaTiO3 is shown as an example. In particular, the high-temperature PE state is characterized by a linear increase of n on cooling. The phase transition from the PE state to the low-temperature FE state is accompanied by a steep drop of the index n. In contrast to the PE state, the index n decreases on cooling in the FE state. The negative sign of the temperature derivative dn/dT is typical for the PE state and the positive sign of dn/dT is characteristic for the polar phase [26–28]. The change of sign of dn/dT at the PE–FE phase transition has been observed also in polycrystalline and epitaxial FE films [29].
For the studies of the thermo-optical behavior in NNO, the as-polished crystal was heated to 973 K, which is considerably higher than the temperature of the transition to the cubic PE U-phase. The index n was measured on cooling to room temperature (figure 1). The negative sign of dn/dT at the temperatures T > 627 K is consistent with a non-FE state. Indeed, the four PE phases and the AFE R-phase are known to exist in NNO at these temperatures. The phase transitions between the high-temperature phases are manifested by peaks or humps in n(T) superimposed on the global increase of n on cooling. The temperatures of these anomalies are in good agreement with the previously reported temperatures of the phase transitions as indicated in figure 1. Importantly, the negative sign of dn/dT is observed at the temperatures between 627 and 720 K corresponding to the well-established AFE R-phase. Moreover, the sign of dn/dT does not change at the PE–AFE S−R phase transition.
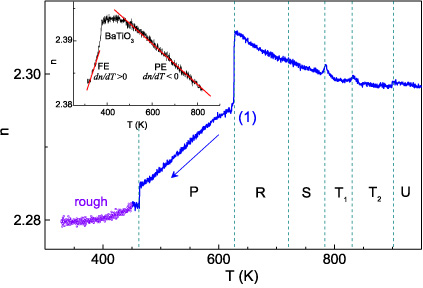
Figure 1. The index of refraction n as a function of temperature T measured during the first cooling of the NNO crystal. Dashed lines indicate the temperatures of the phase transition. The arrow shows direction of temperature change. Also, the region where the surface roughness dramatically increased is marked. Inset shows n(T) measured on cooling in BaTiO3 crystal at photon energy 2 eV.
Download figure:
Standard image High-resolution imageAt the temperature T = 627 K, an abrupt drop of n is observed. It is followed by the change of sign of dn/dT on further cooling: from the negative sign above 627 K to the positive one below 627 K. Such a behavior of n can indicate a FE phase transition, in contrast to the expected transition to the AFE P-phase. Another drop of n is found at ∼462 K. The temperature of 462 K agrees well with that at which the transition to the INC-phase has been reported [5]. Remarkably, we observed a dramatic roughening of the crystal surface below this temperature. Such a roughening usually accompanies the PE to FE phase transition and the formation of the FE domains. The roughening of the NNO crystal surface is much more considerable compared to that in single crystals of BaTiO3 and PbTiO3. The roughening caused a strong increase in depolarization of the reflected light and led to poor measurement accuracy. The crystal was polished once again in order to proceed with additional measurements.
The index n measured on heating after the re-polishing (denoted as the second run here) exhibited completely different behavior in comparison with the first run (figure 2, curve (2)). The magnitude of n is considerably smaller, and the two new anomalies are seen at the temperatures 375 and 512 K. These anomalies cannot be assigned to any previously reported transitions. The anomaly associated with the P−R transition is shifted to the higher temperature of 638 K (compared to 627 K in the first run). The sign of the derivative dn/dT is positive also above 638 K (compared to the negative sign in the first run). This indicates changes in polarization state. The most intriguing feature is a strong interference manifested as oscillations of the index n in the range of temperatures between 512 and 638 K. The interference can originate from periodic structures with the characteristic dimensions of the order of hundreds of nanometers in the direction normal to the crystal surface. Interestingly, such periodic structures may form as a result of charge separation and charge accommodation at the FE domain walls [30].

Figure 2. The index of refraction of the NNO crystal as a function of temperature measured during the second (curve 2) and third (curve 3) temperature sweeps. The index measured during the first cooling (curve 1) is also shown for comparison. The arrows show direction of the temperature change.
Download figure:
Standard image High-resolution imageThe heating during the second run was terminated at the temperature of 773 K (just above the temperature of the known S−R transition) and followed by cooling (third run) (figure 2, curve (3)). The dependence n(T) obtained on the third cooling differs from those obtained both in the first and the second runs. Compared to the first cooling, the thermo-optical behavior in the third cooling is dominated by a FE-like decrease of the index n. The anomalies (drops in n) are observed at the temperatures of 632 and 449 K, which are close to those in the first cooling. The anomalies are considerably less expressed in the third run.
The fourth measurement run was performed on heating to the temperature 573 K, which is below the temperature of the known P−R transition and above the reported temperature of the INC transition. The observed increase of n on heating resembles the FE-like behavior in the third cooling (figure 3, curve (4)) except for the two anomalies at the temperatures 425 and 520 K instead of the one at 449 K. The sign of dn/dT is positive also in the fifth cooling run (figure 3, curve (5)). The temperatures of the anomalies are 455 and 431 K. It is worth noting that compared to the fourth run the magnitude of the index n is smaller at the temperatures below 413 K in the fifth run.

Figure 3. The index of refraction of the NNO crystal as a function of temperature measured during the fourth (curve 4) and fifth (curve 5) temperature sweeps. The arrows show direction of the temperature change.
Download figure:
Standard image High-resolution imageIn the sixth heating run the temperature was raised to 973 K, which is above the temperature of the transition to the PE U-phase. As seen from figure 4, the sign of dn/dT is positive on heating to the temperature of about 830 K, corresponding to that of the PE T1−T2 phase transition. Although anomalies around 450–460 K and at 628 K agree well with those observed in the first cooling, the positive dn/dt and the smearing of the anomalies at the high temperatures above 628 K are in contrast to the first run. Compared to the first run, the magnitude of the index n is considerably smaller in the sixth run at the temperatures below 830 K.

Figure 4. The index of refraction of the NNO crystal as a function of temperature measured during the sixth (curve 6) and first (curve 1) temperature sweeps. The arrows show direction of the temperature change.
Download figure:
Standard image High-resolution imageThe temperature dependence of n(T) measured on cooling after the heating to 973 K appeared to be similar to that in the first cooling from 973 K. At the temperatures below 462 K, the dramatic surface roughening took place. Moreover, the formation of cracks and disintegration were observed in some crystals on cooling below 460 K after heating to 973 K.
The temperatures TOP of the anomalies in the behavior of n(T) upon thermal cycling are summarized in table 1 together with the known temperatures TPT of the phase transitions in NNO. The temperatures TOP below 640 K, i.e. around and below that of the R−P transition, vary considerably depending on the thermal history of the crystal. This evidences the existence of a metastable state in the range of 300–640 K, which is in contrast to the previously reported narrower range of 410–460 K. The dramatic roughening of the crystal surface at T < 460 K and the interference at T < 640 K indicate possible formation and reconfiguration of domains with different crystal structures or orientations, and/or different polar states. The surface roughening is accompanied by a giant decrease of the magnitude of the index n, which is typical for the FE phase transition. Also the sign of dn/dT is positive at T < 640 K, and it changes from the negative to positive at 640 K < T < 830 K after thermal cycling. This FE-like positive sign of dn/dT suggests the presence of the FE phase in the broad range of temperatures. Taken together, the results of the thermo-optical studies imply that the FE phase coexists with the AFE or PE phases at the temperatures from 300 to at least 830 K.
Table 1. The characteristic temperatures TOP of the thermo-optical behavior and TR of the Raman spectra in the NNO crystal compared to the known temperatures TPT of the phase transitions [1–9].
| TOP (K) | TR (K) | ||||||||
|---|---|---|---|---|---|---|---|---|---|
| Phase | TPT (K) | (1) | (2) | (3) | (4) | (5) | (6) | (1) | (2) |
| U | |||||||||
| 913 | 902 | ||||||||
| T2 | |||||||||
| 848 | 830 | 830 | |||||||
| T1 | |||||||||
| 793 | 783 | 785 | |||||||
| S | |||||||||
| 753 | 720 | ||||||||
| R | |||||||||
| 633 | 627 | 638 | 632 | 627 | 670 | 650 | |||
| P | 512 | 520 | 510 | 515 | |||||
| 460 | 462 | 449 | 455 | 462 | |||||
| INC | |||||||||
| 410 | 425 | 431 | |||||||
| 375 | 350 | 350 | |||||||
| 250 | 130 | ||||||||
| N | |||||||||
3.2. Raman spectroscopy
The Raman spectra were acquired at different temperatures in the crystal once heated to 973 K, cooled to room temperature, and polished. According to the thermo-optical studies, the crystal contains the FE Q-phase after such a treatment. The temperature was varied in the following sequence: 300 K → 100 K → 700 K → 100 K → 300 K. The spectra obtained on heating (100 K → 700 K) and cooling (700 K → 100 K) are presented in figure 5.

Figure 5. Temperature dependence of reduced Raman spectra obtained on heating and cooling.
Download figure:
Standard image High-resolution imageThe Raman spectra obtained at the high temperatures above 650–670 K and the spectra obtained at the low temperatures below 130–250 K (depending on the direction of the temperature change) are similar to the previously reported ones [5]. They confirm the well-documented presence of the high-temperature R-phase and the low-temperature N-phase in our crystal. The spectra measured in the intermediate range of temperatures 130 (250)–650 (670) K are very complex. The spectra and the phase transitions in this temperature range disagree with those reported in [5].
As seen from the intensity maps (figure 6), the phase transitions take place on heating at the temperatures TR = 670, 510, 350–380, and 250 K. The temperature TR = 250 K is consistent with that reported for the P−N transition. The three other temperatures are close to the temperatures TOP revealed by the thermo-optical studies during the second heating from 300 to 773 K, namely: TOP = 638, 512, and 375 K. Thus the presence of the phase transitions revealed by the thermo-optical analysis is confirmed by the Raman spectroscopy data. As mentioned above, these transitions cannot be assigned to any of the known transitions in NNO. The temperatures TR obtained on cooling are TR = 130, 350, 515, and 650 K. The observed difference in the temperatures TR = 130 K and TR = 250 K, corresponding to the P−N transition, agree with the thermal hysteresis of this transition found in many NNO crystals. The differences between other temperatures TR detected on cooling and heating are considerably smaller.

Figure 6. Raman response map as a function of temperature.
Download figure:
Standard image High-resolution imageA more careful inspection of the Raman mode frequencies determined from the fit (figure 7) reveals considerable differences between the states of NNO approached on cooling and heating in the temperature range of 130 (250)–650 (670) K. For instance, the changes in the high-frequency (500−700 cm−1) bands, which have been ascribed to Nb–O stretching vibrations [5], are obviously more abrupt and dramatic on heating than on cooling. The continuous temperature evolution of the bands on cooling resembles that ascribed to the presence of the INC-phase [5]. In contrast, our thermo-optical and Raman observations indicate a more complicated sequence of the two phase transitions which can take place around 350–380 K and 510–515 K and become progressively more smeared upon thermal cycling. Also the behavior of the lowest-lying bands (frequency lower than 100 cm−1) in the intermediate temperature range depends on thermal cycling and differs noticeably from that reported in [5]. The Raman spectra for the wavenumbers 100−350 cm−1 and the temperatures 130 (250)–670 K are very rich and complicated. The analysis and assignment of the modes in this region are challenging if not impossible tasks.
The Raman spectroscopy studies of the NNO crystal confirm the presence of the high-temperature R-phase and the low-temperature N-phase, and the metastable state in the intermediate range of temperatures. The temperatures TR of the transitions determined from the Raman spectroscopy data are consistent with those detected in the thermo-optical studies.
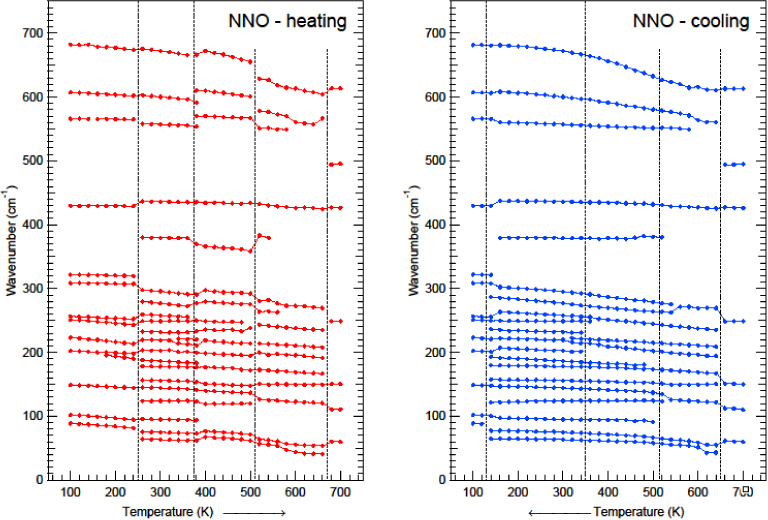
Figure 7. Temperature dependence of Raman peak frequencies (points) detected on heating and cooling. Lines are visual guides.
Download figure:
Standard image High-resolution image3.3. PEEM
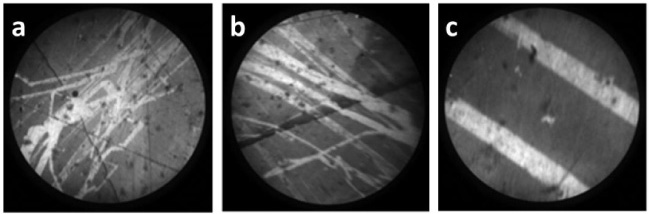
The PEEM analysis reveals regions of strong contrast on the surface of the NNO crystal at room temperature. Figure 8 illustrates typical examples. The images were taken at different positions on the sample surface.
Figure 8. Energy-filtered PEEM images of the NNO crystal. The field of view is (a), (b) 100 μm and (c) 40 μm.
Download figure:
Standard image High-resolution image
The bright elongated regions have widths from a few to tens of micrometers. The NanoESCA measurements with high lateral resolution exclude a contrast due to possible non-stoichiometry in such relatively large regions. Moreover, inversion of the PEEM contrast was found at higher kinetic energies. This is typical for variations in work function due to the presence of the FE polarization and domains [31].
Previously, well-ordered FE stripe domains with a strong work-function contrast have been observed by PEEM on the surface of the single-crystal BaTiO3 [31]. The direction of FE polarization in such domains is normal to the sample surface, enabling the PEEM contrast. Somewhat weaker contrast, random distribution, and irregular shape of the detected domains in NNO differ from the observations in BaTiO3. However, these features of NNO agree well with the multiphase state evidenced by the thermo-optical and Raman studies. We assign the bright regions to inclusions of the FE phase in the AFE media. A more detailed PEEM investigation of such domains in NNO will be reported elsewhere.
3.4. Multiphase state
The self-consistent results of our thermo-optical, Raman, and PEEM studies strongly suggest the existence of the FE phase in the NNO crystal at the temperatures up to at least 830 K.
It should be mentioned that the high optical transparency of the NNO crystal ensures that the ellipsometry and Raman techniques probe the state of a near-surface layer with the thickness of a few micrometers. The obtained results cannot be ascribed to purely surface effects. Moreover, the observed roughening, cracking, and disintegration indicate clearly the changes inside the body of the crystals. Importantly, the thermo-optical behavior inspected on cooling from 973 to 670 K and the Raman spectra obtained above 650–670 K and below 130–250 K agree with the well-documented behavior in NNO. Thus the results of our combined study are relevant for bulk NNO.
The main peculiarity of the studied crystals is the metastable multiphase state existing in the intermediate range of temperatures between 130 K (250 K) and 640 K (830 K). The exact temperature boundaries depend on the thermal history of the sample. This multiphase state is characterized by the presence of the polar phase. The progressive decrease of the index n observed during thermal cycling indicates progressively increasing volume fraction of the polar phase. Also the characteristic temperatures corresponding to phase transitions in the intermediate temperature range are sensitive to the thermal history of the sample.
Obviously, the thermal cycling enhances the formation of the FE phase. We suggest that the FE phase is induced by thermal strains in NNO resembling the strain-induced ferroelectricity in epitaxial NNO films [32–35]. However, an exact mechanism responsible for the stabilization of the FE phase in NNO requires further investigations.
4. Summary
The properties of the top-seeded solution grown NNO crystals were investigated in the range of temperatures 100–973 K using variable angle spectroscopic ellipsometry (VASE), Raman spectroscopy, and photoelectron emission microscopy (PEEM). The thermo-optical behavior and the Raman spectra evidence the existence of the metastable multiphase state, indicate the presence of the polar phase, and reveal new phase transitions in the range of temperatures between 130 K (250 K) and 640 K (830 K). The presence of the FE domains is confirmed by PEEM imaging. The formation of the FE phase is suggested to be induced by thermal strain in the crystals.