
Abstract
Measurements of the positronium (Ps) energy and formation fraction in reflection and transmission from a thin meso-structured silica target have been conducted using single-shot positron annihilation lifetime spectroscopy and Doppler spectroscopy. The silica sample is made using glancing angle deposition of vaporized SiO2 on a suspended thin carbon foil. Optical access through the silica sample facilitates measurement of the longitudinal Ps energy, and the Ps energy in the reflection geometry is found to decrease with positron energy as expected, with a minimum achievable Ps energy of 0.203(12) and 0.26(3) eV for the transverse and longitudinal directions, respectively. In the transmission geometry cooling of Ps becomes evident at the minimum positron impact energy required for the positrons to penetrate the carbon foil and enter the meso-structured silica. The minimum energies for this geometry are 0.210(12) and 0.287(14) eV in the transverse and longitudinal directions, respectively, and the minimum achievable Ps energy is found to be limited by the thickness of the structured silica target, since the same energy was found in both geometries.
Export citation and abstract BibTeX RIS

Content from this work may be used under the terms of the Creative Commons Attribution 3.0 licence. Any further distribution of this work must maintain attribution to the author(s) and the title of the work, journal citation and DOI.
1. Introduction
Positronium (Ps) [1, 2] (the exotic bound state of an electron and a positron) has been studied extensively since its discovery and is of great interest to a range of fields, such as the studies of QED [3], astrophysics [4], and the characterization of porous materials [5, 6]. The particle–antiparticle structure results in the decay of Ps via annihilation mainly into either two or three γ-ray photons depending on its spin state, with characteristic lifetimes of 125 ps and 142 ns for the n = 1 singlet (para-Ps) and triplet (ortho-Ps) spin states, respectively. Ps is known to be created if positrons are implanted into a wide range of media, including gases [7] and insulating solids [8]/liquids [9]/zeolites [10], and it may also form in the low density electron cloud at the surface of metals [11]. The fraction of ortho-Ps formed per impinging positron can be found from the annihilation γ-ray energy spectrum [12] (the energy of photons stemming from direct annihilation, para-Ps annihilation, and pick-off annihilation is 511 keV, while that of ortho-Ps annihilation in vacuum is a continuous spectrum up to and including 511 keV) or the Ps lifetime spectrum in which the detection of a delayed annihilation photon is attributed to the annihilation of ortho-Ps. The latter technique can be employed either using a continuous bombardment of positrons [6, 11] or a pulsed beam of many positrons for single-shot positron annihilation lifetime spectroscopy (SSPALS) [13], which was used in this work. It has the advantage of being able to reveal transient phenomena related to the sample or the Ps itself [14]. Positron annihilation lifetime spectroscopy is likewise an important tool for depth profiling of layered materials [15]. It is also used to study the pore surface composition of, e.g. porous polymers [16], and it is widely used within Ps physics to optimize the morphology of a given sample for Ps formation and cooling. Such optimization utilizes the fact that the Ps annihilation lifetime in porous silica changes with the pore size, and a high degree of interconnectivity between pores increases the diffusion of Ps to the vacuum [17].
Numerous experiments depend on the availability of a large amount of cold Ps, including gravitational measurements on Ps [18, 19] and antihydrogen [20, 21], Bose–Einstein condensation of Ps [22], and the already accomplished production of the dipositronium molecule [23]. Converting positrons to Ps at maximum efficiency while minimizing the Ps energy has therefore been the aim of several studies [24–26]. Porous silica has proven to be a good choice due to the large Ps yield from the bulk combined with a low surface pick-off annihilation rate for an efficient collisional cooling in the pores [27]. Most previous experiments have focused on Ps formation in reflection geometry, i.e. Ps is emitted from the same surface as the positron beam impinges. In this work the formation of Ps in transmission through meso-structured silica thin film targets (almost identical to the samples of [28]) is studied. Thin silver foils have been used previously to produce Ps in transmission [29], however, for efficient conversion these foils must be heated to 800 K, which is impractical in many applications and is avoided in the present set-up.
The transmission geometry is practical in experiments where further transport of Ps or its ionization products is required. For instance, in a multiphoton ionization experiment, the energy of the ionization products can be measured via their time-of-flight in a magnetic bottle spectrometer if guided away from the interaction region [30]. The Ps formed in transmission can also be transported away from the formation region by external fields. If the lifetime of Ps is extended by Rydberg excitation subsequent to the formation in transmission, the Ps can be utilized to measure the gravitational free-fall of Ps [19], to produce antihydrogen inside a Penning trap by antiproton charge exchange [31], or to fill a stellarator for electron–positron plasma studies [32]. Variable energy Ps beamlines using the scheme of acceleration via an optical lattice [33] would benefit greatly from Ps formation in transmission, as would the incorporation of Ps inside macro cavities for Ps Bose–Einstein condensation [22]. Since transmission targets also allow optical access along the beam axis they can be used for experiments in which the laser orientation is important, such as state selective excitation with circularly polarized light. Furthermore, as noted in [24], the implantation of positrons from the back of a thin film in a transmission geometry is expected to enhance the fraction of Ps that actually cools down to the minimum energy expected from the sample morphology [26], since more Ps atoms experience the maximum number of collisions before exiting the film.
Presented here are the first energy measurements of Ps formed in transmission through a structured silica thin film. The energy of the Ps was measured via Doppler spectroscopy at UCL (London) and demonstrates the first laser spectroscopy measurement using transmission-formed Ps. The transmission thin film target allows the UV laser used for the Doppler spectroscopy to be transmitted through the target and probe the Ps velocity component perpendicular to the surface directly. This is utilized both in the transmission and reflection geometries to obtain the perpendicular energy component, by measuring the concomitant Doppler shift of the 1S–2P transition. The energy spread along the direction parallel with the laser is inferred similarly, using the width of the Doppler-broadened transition, and the energy component parallel to the thin film surface is measured by directing the laser along the surface.
2. Experimental section
2.1. Meso-structured silica samples
To convert positrons to Ps in transmission while facilitating collisional cooling, an ultraporous silica thin film is deposited onto a 20 nm amorphous carbon foil using the technique of glancing angle deposition [34] as illustrated in figure 1 of [28]. The film is grown under vacuum at 4 × 10⁻⁷ mbar at a rate of 1 nm s−1 controlled by a quartz crystal monitor positioned normal to the SiO2 flux direction. Based on the results of [28], the off-axis corrected normal thickness of the foil used in the present experiment is chosen to be 1000 nm. The sample rotational speed was set to 6 rpm, while the glancing angle of the deposition is 7° with respect to the sample surface. The resulting thin film is a uniaxial anisotropic meso-structure with columns standing at right angles to the surface, spaced on average by ∼170 nm and with an average diameter of ∼60 nm measured by means of a fast fourier transform and a particle analysis, respectively, using ImageJ [35] similar to the procedure used elsewhere [36]. A thin film similar to the one grown on a carbon foil was grown simultaneously on a Si(100)-wafer for imaging purposes only. Using a focused ion beam (FIB) of Ga+, a thin cross section of the meso-structured thin film was produced and imaged by a scanning electron microscope (SEM) as shown in figure 1(a). The bright columns with the darker spaces in between are clearly seen, and the capping layer on top is carbon to protect the surface from the FIB (some carbon will also enter the film resulting in an apparent increase of the pillar thickness and decrease of the film thickness when viewed in cross section). The film thickness is ∼800 nm found from a transmission electron micrograph (TEM) of the cross section slice, where the carbon capping layer can be distinguished from the structured SiO2. In figure 1(b), the top view SEM image of the meso-structured sample used for the ImageJ analysis is shown. The mean porosity is estimated at a depth of half the thickness by the ratio between areas of dark spaces between columns and the total area to be ∼85% in good agreement with [37]. The average density is found from the bulk density times the porosity to be ∼0.4 g cm−1.

Figure 1. The meso-structured silica thin film imaged by SEM (a) in cross section and (b) from a top view. The layer on top of the film in (a) is carbon deposited to protect the surface from the Ga+ focused ion beam used to cut the cross section slice for TEM imaging that reveals the film thickness.
Download figure:
Standard image High-resolution imageThe target is attached to a target holder mounted on a three-dimensional manipulator with rotation around the z-axis, and the reflection (transmission) geometry is defined by the target being positioned with the silica structure facing towards (away from) the beam source, as shown in figure 2. In the transmission geometry the positrons will therefore penetrate the carbon foil before entering the meso-structured silica thin film, whereas in the reflection geometry the silica film is hit directly by the positrons. In figure 2 the different laser positions used to measure the Ps energy in the parallel (a) and (c) and the perpendicular (b) and (d) directions with respect to the target surface are also illustrated.

Figure 2. The geometries are as shown for Ps formation (a) and (b) in reflection and (c) and (d) in transmission. The transverse Ps energy component is measured with the lasers positioned as in (a) and (c) for the reflection and transmission geometries respectively, and the longitudinal Ps energy is measured with the UV laser going through the silica targets (but the 532 nm laser being parallel to the surface to avoid target damage) as in (b) and (d) for reflection and transmission geometries respectively.
Download figure:
Standard image High-resolution image2.2. Positron beam
Positrons emitted via β+ emission from sodium 22 are moderated using solid neon [38] and magnetically guided to a two-stage, buffer-gas trap [39]. Upon ejection the positron bunch is further time compressed to ∼4 ns FWHM by applying a linear electric potential along the trap electrodes [40]. The pulse frequency is set to 1 Hz, and each bunch contains ∼5 × 10⁵ positrons, which are implanted in the meso-structured silica at an energy set by the negative high voltage bias of the target holder. As the positrons are compressed in time they gain an energy of 100 eV (on average) which should be added to the bias voltage as an offset to get the absolute positron implantation energy. The FWHM of the positron energy profile is about 50 eV.
2.3. Laser system
The laser system is the same as that described in [41], with Ps atoms interrogated spectroscopically by two-photon resonance-enhanced photoionization. The 1S–2P transition was driven by 243 nm radiation, and the excited atoms then photoionized by radiation of wavelength 532 nm.
The 243 nm radiation was produced by doubling the output of a pulsed dye laser (Sirah Cobra-P, operated with coumarin-102 dye), driven by the 355 nm tripled output of a Nd:YAG laser (Continuum Surelite II-10, producing 7 ns duration pulses at 355 nm of up to 160 mJ). The fundamental radiation, which could be scanned between 460 and 490 nm, was frequency-doubled with a BBO crystal, producing pulses of up to 5 mJ around the Ps Lyman-α wavelength, λ0 ∼ 243 nm. The 243 nm pulse energy was varied by controlling the phase-matching angle of the BBO crystal, allowing the UV energy to be kept constant as the wavelength was scanned. The maximal energy available in the UV is more than enough to saturate the 1S–2P transition, and a pulse energy of ∼1.3 mJ was used to probe the Ps energy in the transverse direction, whereas the energy was reduced to ∼400 μJ when the Ps longitudinal energy was probed through the silica sample. The dispersive optical element inside the dye laser oscillator was a series of prisms (SF10 glass), generating laser pulses in the fundamental with a bandwidth of 60 GHz, which became ∼85 GHz after frequency-doubling. This broad bandwidth gave a reasonable overlap with the ∼0.5 THz Doppler-width of the 1S–2P transition. Having been excited to the 2P state the Ps atoms were photoionized by the residual 532 nm radiation produced by the Nd:YAG laser, with pulses of up to 60 mJ. In practice energies of around 20 mJ were used, with the energy controlled by the use of neutral density filters.
The 243 nm laser beam was aligned through the vacuum chamber, traversing horizontally past the Ps-conversion target at a variable distance (either in front or behind the target as shown in figure 2). The 532 nm beam entered the vacuum chamber at an angle of ∼5° to the horizontal, such that it would intersect the UV beam in the Ps-interaction region. Prior to entering the vacuum chamber the 532 nm radiation traversed a ∼2 m long delay path such that both laser beams passed by the target simultaneously. Alignment of the target to the laser beams was precisely controlled using the three-dimensional manipulator at which the target was mounted. The lasers were operated at a repetition rate of 1 Hz, synchronized to the trap cycle and optimized for interaction with the maximum number of Ps atoms.
2.4. Detection technique
The fraction of incident positrons that form ortho-Ps is estimated using SSPALS [13, 42]. The technique measures the time-resolved γ-ray annihilation signal as a positron bunch is implanted into a solid. The signal contains a prompt peak, due to very rapid annihilation of both positrons and para-Ps, followed by delayed events that correspond to the natural decay of ortho-Ps. The spectra is convolved with the time distribution of the incident bunch, as well as the rise and decay times of the γ-ray detector–accordingly, a short positron pulse and a fast detector are essential for resolving ortho-Ps production.
The γ-rays were detected using a PbWO4 scintillating crystal, with a decay time of roughly 10 ns, optically coupled to a fast photo-multiplier tube (PMT). The PMT signal was split through a 50 Ω tee and each output digitized in a 50 Ω terminated channel of a 1 GHz, 2.5 GS s−1, 12 bit oscilloscope (Teledyne Lecroy HDO 4104). By splitting the signal over two independent channels it was possible to record the full waveform without saturation, while simultaneously acquiring the delayed events with high resolution.
After acquisition, both waveforms were spliced together and a constant fraction discriminator algorithm employed to ascertain the implantation time (t0). The inset in figure 3 shows three spectra (each of which is the average of 200 shots), which shows the Ps yield (delayed events) varying with the positron implantation bias. The fraction of ortho-Ps formed in the sample upon positron implantation is proportional to the delayed fraction of the lifetime spectrum [14] (fd), defined as the signal integrated between 35 and 350 ns (relative to t0), normalized to the total signal integral (from − 3 to 350 ns), 
 , where V(t) is the measured detector voltage at a given time, t. To investigate the Ps energy via Doppler spectroscopy it is also necessary to quantify a change in the delayed fraction with respect to the delayed fraction of some background measurement, fb. This is done by employing the parameter
  , which is used in the following sections to infer resonant ionization of Ps.

Figure 3. The variation of the delayed fraction, fd, by positron implantation energy as measured by SSPALS. The insertion shows the measured spectra for three energies (0.3 (blue), 2 (red), and 3 keV (black)) normalized to peak height and averaged over 200 positron pulses. The statistical errorbars are smaller than the size of the points.
Download figure:
Standard image High-resolution image3. Results and discussion
3.1. Ps formation
When low energy positrons are implanted into amorphous or single crystal SiO2, Ps is formed either in the bulk or at the surface and a significant fraction of the incoming positrons are emitted into the vacuum as Ps with energies ranging from approximately 1–3 eV [43]. If the positron energy is increased, the positrons will be implanted deeper into the sample, and less Ps will reach the surface resulting in a lower fraction of 3-γ annihilation events in the decay spectrum, as well as a decreased delayed fraction, fd, in the lifetime spectrum. In porous silica or silica grained powders Ps is known to undergo diffusion in the pores and cool down as a consequence of collisions with the internal surfaces. Accordingly, Ps emitted from the porous network will typically have significantly less energy than those atoms emitted directly from the bulk or the surface (i.e. below ∼1 eV). Ps formed deeper within the network will experience a greater number of collisions, and may thus cool nearer to the limit of thermalization with the silica bulk (for very small pores (diameter less than ∼5 nm), the confinement energy of the pore-atom system can significantly increase the minimum emission energy [26]). Due to the column wall spacing of typically ∼100 nm and the very open structure in the silica films used here, no confinement limit is expected. Instead the finite thin film thickness sets a limit to the minimum achievable Ps energy. Due to the large spaces between the columns (resembling the pores in porous silica samples), the Ps is also expected to have a large diffusion length and thus should reach the surface for emission immediately after the positron implantation.
In figure 3 the delayed fraction, fd, is shown as a function of the positron implantation energy measured in the reflection geometry. In this geometry, the positrons of energy, K in units of keV, will be implanted to a mean depth,  , where A and ν' are empirical parameters, and ρ is the average density of the meso-structured silica film [11]. At this depth Ps is formed and diffuses to the surface. The parameters A = 2.81 μg cm−2 and ν' = 1.7 are usually found to describe the positron implantation [44].
If thermal Ps diffusion to the surface is assumed, and the change of the diffusion coefficient, DPs, with Ps energy is neglected, the ortho-Ps formation fraction will take the form [26]

where the fitted parameters from the data in figure 3 are: the delayed fraction at zero impact energy, f0 = 0.333(7), the positron implantation energy at which the delayed fraction is halved, K0 = 0.346(11) keV, and the delayed fraction at infinite impact energy,  , in accordance with the background found in [14]. The Ps formation fraction,
  , is generally larger than the delayed fraction. Thus employing the conversion from fd to fPs used in [14] in the simplest form where detection of 2γ and 3γ annihilations are equally probable, one finds at zero implantation energy a Ps formation fraction of fPs ≃ 60%. This fraction is in good agreement with the fraction found for similar targets in [28]. The last parameter, ν, is found to be ν = 0.844(17), which is about half of the value stated by others [44, 45]. However, the model assumes thermal Ps diffusion which is not expected to be valid for these silica structures, therefore the value of ν cannot be used to extract the implantation profile nor the diffusion coefficient, as done elsewhere [26].
Ps can be formed in the transmission geometry by rotating the target 180° to have the structured film facing away from the positron source as shown in figure 2. Ps will first form in reflection in the carbon foil at low positron energy. However, as the energy is increased some positrons will fully penetrate the carbon foil and form Ps in the silica sample that is then emitted at the transmission side. This type of Ps formation is expected to be optimal for cooling, since more positrons will be stopped at the bottom of the sample and on average perform more collisions with the columns on its path to the surface. The amount of Ps formed in transmission has been measured and the results are shown in figure 4. The maximum Ps formation fraction in transmission is reached at positron implantation energies ranging from 1.4–2 keV and is about 10%, in good agreement with [28]. The maximum formation fraction is obtained as the optimal trade off between positrons going through the carbon sample and positrons not being implanted too deep into the silica columns. After the maximum Ps fraction has been reached, the usual decrease in the number of emitted Ps atoms due to deeper positron penetration in the columns is seen.
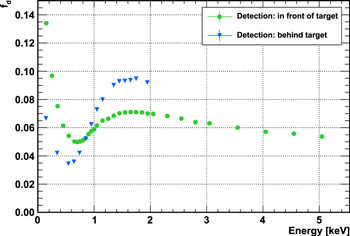
Figure 4. Ps formation efficiency in transmission geometry. The delayed fraction observed at low positron impact energy ( keV) is attributed to Ps reflected from the carbon foil, whereas at higher energies the positrons can penetrate the carbon and form Ps in the meso-structured silica. Positioned in front of (behind) the target, the PbWO4/PMT more efficiently detects the annihilation of reflected (transmitted) Ps, as these are moving towards it.
Download figure:
Standard image High-resolution image3.2. Ps cooling: reflection geometry
The energy of the emitted Ps is measured via Doppler spectroscopy. Both the transverse and the longitudinal energy is measured in (i) reflection and (ii) transmission geometries. First the reflection geometry data is presented, i.e. the situations illustrated in figures 2(a) and (b) for the transverse and longitudinal Ps energy measurements, respectively. The transverse energy of the emitted Ps is probed by the Doppler broadening of the Lyman-α resonance. After optimizing the delay of the lasers to the maximum overlap between the Ps cloud and the laser pulses, the UV laser is tuned over a range of wavelengths from 242.3 to 243.75 nm. The resulting change in the fraction of Ps present at a given wavelength is quantified by S as defined in the experimental section. The background measurement is taken to be the delayed fraction of the annihilation spectrum, foff, as measured when the laser is off-resonance and the delayed fraction at the various wavelengths, λ, is denoted by fd(λ). S was measured as a function of wavelength for various positron implantation energies as shown in figure 5, and a Gaussian is fitted to each of the five resonance peaks. The mean squared velocity,  , of the formed Ps can be found from

where σ is the standard deviation of the Doppler lines estimated by the Gaussian fits, λ0 = 243 nm is the Lyman-α resonance wavelength, and c is the speed of light. The transverse energy of the Ps is then found from the classical expression,  , which has been plotted as a function of the positron implantation energy in figure 6.

Figure 5. The UV laser wavelength is varied over the Lyman-α resonance showing the Doppler broadening for Ps produced in reflection at five positron impact energies.
Download figure:
Standard image High-resolution image
Figure 6. The reflection-formed Ps transverse energy as extracted from the Doppler broadening widths, and plotted as a function of positron implantation energy. The fit is an estimate of the data based on equation (3).
Download figure:
Standard image High-resolution imageIt is clear from these data that some cooling of Ps is seen; the transverse energy of the emitted Ps decreases with increasing positron impact energy. A model for the cooling is provided by [26], where thermal two-dimensional diffusion is assumed:

Using the parameter ν = 0.844 found from the diffusion fit to the data in figure 3, the fit shown in figure 6 is found. The parameters in this fit are the initial energy, Ei = 0.147(14) eV, a parameter, Q = 0.54(16) keV−2ν, related to the number of Ps-wall collisions in terms of positron mean implantation depth, and the minimum achievable energy, Emin = 0.203(12) eV, in the sample. Usually this latter quantity is related to Ps confinement [26], but this is not the case here since the positron implantation depth that would be required for the formed Ps to lose all its energy is longer than the thickness of the structured silica film. Therefore the minimum achievable Ps energy is purely a result of limited cooling due to the finite film thickness and thermalization is not possible. Also, the cooling 'rate', Q, should not interpreted literally, as the diffusion is not expected to be thermal.
To measure the longitudinal energy of the produced Ps, a setup is employed in which the UV laser is transmitted through the target to probe the Ps formed in reflection, and travelling perpendicularly away from the structured silica sample (as shown in figure 2(b)). The measurements are seen in figure 7 and again a Gaussian is fitted to the resonance shapes. This time however, a Doppler shift of the profile occurs and the mean value of the distribution is used to estimate the energy of the Ps along the longitudinal axis while the FWHM (or the standard deviation) gives the energy spread of Ps along that axis. Again the Ps is seen to cool down as the positron impact energy is increased (see figure 8), and equation (3) has again been utilized to estimate the shape of the data. The parameters obtained for the longitudinal cooling are: Ei = 0.40(3) eV, Q = 0.43(10) keV−2ν, and Emin = 0.26(3) eV. It is clear that the initial and minimum energies are higher in the longitudinal direction, but the cooling 'rate', Q, is similar in the two cases. The energy spread in the longitudinal direction is found to be less than 200 meV, possibly with some cooling also.

Figure 7. The Doppler shifted wavelength scans for Ps formed in reflection and for four positron implantation energies. The amplitude of the profiles are larger for lower Ps longitudinal energy, where the laser-Ps interaction time is longer.
Download figure:
Standard image High-resolution image
Figure 8. The reflection-formed Ps longitudinal energy and energy width as extracted from the Doppler shifted resonances, and plotted as a function of positron implantation energy. The fits are estimates of the data based on equation (3).
Download figure:
Standard image High-resolution imageThe overall ability of these targets to cool down the formed Ps is clear from the data presented. However, there is an indication that the minimum achievable energy is higher for these meso-structured silica thin films than has been observed with meso-porous silica [26]. This is expected to be a result of the large column spacing in the sample and the limited thickness compared with the positron implantation depth. If the column spacing were smaller, then the number of Ps-wall collisions experienced for a given distance travelled in the direction perpendicular to the sample surface would increase, and the cooling would be more efficient. On the other hand the large spaces between the columns seems to assure a low initial Ps energy, since a large fraction of the implanted positrons reach deep into the sample before forming Ps (because of the low effective density of the sample), which facilitates cooling even at low implantation energies.
3.3. Ps cooling: transmission geometry
In the transmission geometry cooling is expected to be most efficient just when the positrons pass the carbon foil and enter the meso-structured silica sample. If the supporting carbon foil was very thin a large fraction of the positrons would reach the structured silica film even at low implantation energy, and form Ps at a very localized position because of a small spread in the implantation depth profile. If a Ps diffusion barrier is present at the entrance of the film where the carbon foil is located, the formed Ps will not be able to diffuse to the carbon surface for emission in reflection. Therefore the Ps will diffuse to the transmission surface and all the atoms will experience the maximum number of collisions possible because of the 'deep' and localized implantation with respect to the transmission side. The energy of the emitted Ps should thus correspond to the lowest achievable energy in the reflection geometry, however, the fraction of the formed Ps possessing this energy is maximized in the transmission geometry. As the energy is increased the cooling should become less significant since the Ps is now formed closer to the transmission surface of the sample, and the formation sites are spread over a larger region due to a broader implantation profile.
The Ps transverse energy is measured by the same method as was used in the reflection geometry, but now the UV and green lasers are directed towards the transmission side of the target (see figure 2(c)). The resonance shapes obtained from the UV laser wavelength scans at different positron impact energies are shown in figure 9. Each resonance is fitted to a Gaussian profile, and the Ps transverse energy is extracted as previously. For some fraction of the positrons to penetrate the carbon foil, the positron energy must be at least ∼1 keV (see figure 4), which is the lowest positron impact energy used to form Ps in the transmission geometry. The Ps transverse energy is plotted in figure 10 as a function of positron implantation energy. The measured transverse Ps energies are clearly seen to be lower than for the corresponding positron energy in the reflection geometry. The lowest Ps energy is measured to be 0.210(12) eV at a positron implantation energy of 2.1 keV, and the Ps energy seems to be slightly decreasing for an increased positron energy, although a constant energy cannot be fully ruled out based on the statistics of these measurements. The implantation energies used in this work were such that transmitted positrons were restricted to the first 20% of the meso-structured silica, resulting in a nearly constant Ps energy.

Figure 9. The Doppler broadened Lyman-α resonance found from a wavelength scan of a UV laser directed parallel to the silica sample surface. Ps is formed in transmission and measurements are conducted at five position implantation energies.
Download figure:
Standard image High-resolution image
Figure 10. The transmission-formed Ps transverse energy as extracted from the Doppler broadening widths, and plotted as a function of positron implantation energy. The red line represents a linear fit to the data.
Download figure:
Standard image High-resolution imageThe transmission-formed Ps energy is also probed in the longitudinal direction. As shown in figure 2(d), the green 532 nm laser is parallel to the sample surface, while the UV laser beam passes through the structured silica to measure the Doppler shift of the 1S–2P transition for the Ps traveling towards the laser. A significant fraction (∼90%) of the laser light was reflected, leading to the double peak structures seen in figure 11. A double Gaussian fit is performed to find the peak centroid positions and widths of the two peaks, and the perpendicular Ps energy is found from the shift of the centroid peaks via equation (2), where σ is set equal to half of the peak separation. It is noted that the dip between the two peaks has been shifted slightly, presumably due to a misalignment of the laser to the sample surface, which is why half of the peak separation is used to calculate the Ps energy. The widths of the peaks correspond to the energy spread of the Ps in the longitudinal direction. The longitudinal Ps energy and the energy spread as found from the double Gaussian fits are shown as a function of the positron implantation energy in figure 12, where the correlation between the fitting parameters has been taken into account when calculating the errorbars. The same tendency as seen for the transverse energy is also seen here up to at least 1.7 keV, where the minimum Ps energy of 0.287(14) eV is found. However, as the positron energy is increased further, the Ps energy becomes constant.
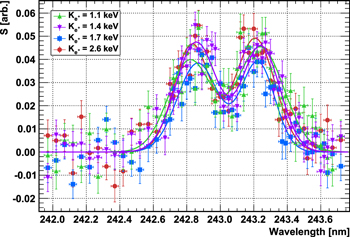
Figure 11. The Doppler shifted wavelength scans for Ps formed in reflection and for four positron implantation energies. The double peak structure in the transmission geometry is present due to reflection of ∼10% of the UV laser, and subsequent ionization at the blue shifted resonance wavelength in addition to the red shifted resonance wavelength for the direct excitation by the laser.
Download figure:
Standard image High-resolution image
Figure 12. The transmission-formed Ps longitudinal energy and energy width as extracted from the Doppler shifted double peak resonance structures, and plotted as a function of positron implantation energy.
Download figure:
Standard image High-resolution image
The minimum achievable energy in the transmission geometry both in the longitudinal and the transverse directions correspond quite well to the minimum energy found in the reflection geometry from the fit to equation (3). This further supports the idea of the minimum energy in the reflection geometry occurring when the number of positrons reaching the bottom of the meso-structured silica film is maximized with respect to the number of positrons being transmitted all the way through the silica structure. It is also noted that the spread in Ps energy in the longitudinal direction is less in the transmission geometry compared to the reflection energy. To optimize this type of material for Ps formation and cooling in transmission, it is essential to increase the probability for the positrons to stop in a localized position deep in the silica structure close to the carbon foil. The spaces between the pillars and the pillars themselves should be smaller to facilitate a larger fraction of Ps being emitted from the bulk pillars into the open spaces. Additionally, a thinner foil at the entrance would decrease the depth inside the pillars at which the Ps is formed thus increasing the probability of emission into vacuum.
4. Conclusions
The Ps formation efficiency as a function of the positron implantation energy has been measured in the reflection and transmission geometries. The reflection-formed Ps fraction was compared to a diffusion model that yielded a positron implantation parameter, ν = 0.844(17), being about half of the value obtained by other studies [44], which is attributed to the lack of Ps thermalization prior to diffusion. The Ps energy in both the transverse and longitudinal directions was measured as a function of positron implantation energy in the reflection and transmission geometries. Significant cooling was found in both geometries and both directions. The cooling of Ps formed in reflection was estimated by means of the cooling model in equation (3), using the estimated value of ν from the diffusion model. There is good agreement with the fits in both directions. The cooling of transmission-formed Ps becomes evident as a slightly decreasing Ps energy in both the transverse and longitudinal direction, but more importantly, the energy is already very low at the implantation energy where Ps starts to form in transmission. This is due to Ps being formed deep inside the meso-structured silica with respect to the transmission surface, and thus a large fraction of the formed Ps will experience a large degree of cooling. The minimum energy found in the transmission geometry is the same as that in the reflection geometry for both the longitudinal and transverse directions. This is seen as evidence that the minimum energy in the reflection geometry corresponds to positrons having reached the bottom of the meso-structured silica sample on average.
An efficient source of Ps emitted at a relatively low energy in transmission has been demonstrated. The fraction of Ps formed in transmission with positron implantation energy of 1.7 keV corresponds quite well to the fraction of Ps emitted in reflection with 3.1 keV implantation energy, which is the energy at which a similar mean implantation depth would be expected from the minimum Ps energy achieved at these two implantation energies. The production of a large amount of Ps is required in a broad range of experiments, which will benefit from production in transmission. Furthermore, the optical access along the axis has proven very useful for probing Ps formed in reflection in the direction perpendicular to the emission surface, and work will continue to develop this type of positron to Ps converter to achieve a higher Ps yield at a lower energy.
Acknowledgments
The authors thank F Lyckegaard for producing the meso-structured silica sample, and R Jawad and J Dumper for technical assistance. This work was funded in part by the Lundbeck Foundation (grant number R49-A5860), the Department of Physics and Astronomy, and the Faculty of Mathematical and Physical Sciences at University College London, the Leverhulme trust (grant number RPG-2013-055) and the EPSRC (grant number EP/K028774/1).