Abstract
We report a linear surface-electrode trap that can be used to form parallel ion strings. By adjusting the balance of the radio-frequency (RF) voltages applied to central and RF electrodes, the RF pseudopotential can be varied from single-well to double-well in the radial direction. Ions located on two parallel lines of the RF potential null are in principle free from excess micromotion if appropriate static voltages are applied. Calcium ions were trapped for the evaluation of the designed electrode. An ion string in the single-well potential and two ion strings in the double-well potential were observed by changing the RF voltages. Such traps could be used for quantum simulation of coupled spin systems.
Export citation and abstract BibTeX RIS

Content from this work may be used under the terms of the Creative Commons Attribution 3.0 licence. Any further distribution of this work must maintain attribution to the author(s) and the title of the work, journal citation and DOI.
1. Introduction
Trapped ions are prominent systems for quantum simulation [1–3] since they can be used to model a quantum system of interest with a different well-controlled quantum system. This is because the initial state can be precisely prepared, the time evolution of the system and the interaction can be accurately manipulated and the readout of the final state can be performed efficiently. Among a number of proposals and demonstrations [1–3], one of the attractive targets for quantum simulation with trapped ions is a quantum spin model which was first demonstrated by Friedenauer et al [4]. The adiabatic evolution of the spin system from paramagnetic to ferromagnetic order has been experimentally simulated with two 25Mg+ ions in a linear Paul trap. An important task is up-scaling the system. Effective spin frustration with three antiferromagnetic spins on a triangle has been demonstrated using a linear chain of 171Yb+ ions [5]. Quantum simulation of the emergence of magnetism using nine ions [6] and engineering frustrated antiferromagnetic interactions between spins using as many as 16 ions [7] have been recently reported also using a 171Yb+ ion string.
Another approach to quantum simulation of interacting spins on a lattice is construction of a real two-dimensional ion array. A large two-dimensional ion array has been realized with Penning traps [8], but the rotating crystal makes individual ion addressing and readout experimentally challenging. On the other hand, an array of Paul traps has been investigated. A relatively large Paul trap array whose site spacing is of the order of 1 mm has been demonstrated with a two-layer trap consisting of a single radio-frequency (RF) electrode with a regular array of holes and a grounded electrode [9]. Sr+ ions and aminopolystyrene microspheres have been used for the evaluation of the trap array. A variety of geometries have been proposed based on surface-electrode traps [10–12]. The magnitude of the spin–spin interaction has been estimated for a trap array with a spacing of the order of 10 µm, where microcoils are integrated into the trap electrodes to generate microwave or RF radiation [10]. Methods for optimizing geometries have been developed by focusing on the maximization of the electric field curvature of individual trapping sites for arbitrary ion heights and separations [12], or through maximization of the ratio between the interaction and decoherence rate [13]. Recently, a trapping lattice consisting of single Yb+ ions has been demonstrated using a microfabricated lattice of ion traps [14]. As for geometry based on a linear surface-electrode trap, multiple parallel traps have been proposed and detailed spin–spin coupling strengths have been estimated [15]. However, to the authors' knowledge, such parallel ion strings of linear surface-electrode traps have not yet been achieved.
Here we report a linear surface-electrode trap that can be used to form parallel ion strings. The trap potential can be adjusted to be either single-well or double-well by varying the RF voltages. Ion separation and the barrier between two potential wells are variable in one trap. The advantage of our scheme is that, in principle, micromotion compensation need only be considered in the plane perpendicular to the trap axis because it is based on a linear trap. We present our trap design, analysis of the trap potential and implementation of the electrode. We demonstrate the change of trap potential from single-well to double-well. We observe parallel ion strings with an ion spacing of several tens of micrometers. A double-well potential along the trap axis has been realized using static potentials [16, 17]; however, a double-well potential produced by a RF potential is performed for the first time. Finally, we discuss the possible cause of perturbation of the trapping potential and the future prospects of the improved implementation.
2. Trap design
2.1. Layout
The trap design is based on our previous linear surface-electrode trap [18]. Figure 1(a) shows a schematic illustration of its cross section near the trap centre. A RF voltage is applied to the two RF electrodes to provide radial confinement. A RF nodal line at which ions are trapped is located above the trap surface on the y-axis. Confinement in the trap axis (z-axis) is achieved by other dc electrodes. In order to produce a double-well potential along the x-axis, the centre electrode in figure 1(a) is divided into three electrodes (figure 1(b)): a centre-RF electrode and two dc electrodes which we call side electrodes. We apply a RF voltage to the centre-RF electrode (VcRF) at a certain ratio in addition to the original RF electrodes (VRF). The application of an additional RF field at a certain ratio in a surface-electrode Paul trap was investigated in [19], where they demonstrated the variable height of the nodal point of the RF field ranging from 200 to 1000 µm. A similar technique was employed to adjust the nodal point in a surface-electrode Paul trap in which an optical fiber was integrated [20]. In the case of our linear surface-electrode trap, an additional RF field applied to the centre-RF electrode produces two parallel RF nodal lines along the z-axis. The RF field from the outer RF electrodes forms a nodal line above the trap surface on the y-axis, which is indicated by a star mark in figure 1(a). Additionally, the field from the centre-RF electrode shown in figure 1(b) is in the positive direction on the y-axis, which reduces the magnitude of the field below the original RF nodal line and increases it above it. The additional VcRF thus makes the RF nodal line lower, but it remains on the y-axis while the field from the outer RF electrode is dominant. As the VcRF/VRF ratio increases, the field from the centre-RF to the next electrode becomes effective and the two parallel nodal lines form near the trap surface.

Figure 1. Schematic illustrations of the cross section of electrodes and electric field near the trap centre. Not to scale. The width of the RF electrodes is actually wider than that of the other electrodes but the outer edges of the RF electrodes are not shown. Arrows indicate the electric field at a single point in time generated by an RF voltage. Star marks indicate the height of the RF nodal line where ions are trapped. (a) Single-well type [18]. Due to the two RF electrodes, an electric quadrupole field is generated above the surface on the y-axis. (b) Adjustable single- or double-well trap. Because of the additional RF field applied to the centre-RF electrode, two RF nodal lines can be generated. The height and separation of these nodal lines are variable by adjusting the ratio between the RF and centre-RF amplitudes.
Download figure:
Standard image High-resolution imageFigure 2 shows the top view of the trap electrode. To confine ions along the z-axis, a positive voltage is applied to four end electrodes. Between two RF electrodes with the width of 820 µm, three electrodes are located as shown in the magnified image of the trap centre. The widths of the side and centre-RF electrodes are 30 µm and 100 µm, respectively. All of the gaps around the RF and centre-RF electrodes are set to be 50 µm to avoid breakdown, while the gaps between the end and middle electrodes are 25 µm.

Figure 2. Upper part: entire image of trap electrodes. A positive voltage is applied to four end electrodes to confine the ions along the z-axis. Lower part: magnified image of the trapping region which is indicated by a rectangle in the upper part. The widths of the RF, side and centre-RF electrodes are 820, 30, and 100 µm, respectively.
Download figure:
Standard image High-resolution image2.2. RF potential calculation
We numerically calculated the secular potential Φ generated by the RF and centre-RF electrodes as we changed the RF voltage ratio VcRF/VRF from 0 to 1.0 using a commercially available solver (Maxwell 3D, Ansys). Figure 3 shows some of the contour plots of QΦ in the x–y plane where Q is the electric charge. In the case that no additional RF field is applied (figure 3(a)), the trap characteristics are the same as for the previous trap [18], in which ions are trapped approximately 400 µm above the trap surface. When increasing the RF voltage ratio, the RF nodal line becomes closer to the trap surface. At the same time, another nodal line appears near the trap surface on the y-axis (figure 3(b)). When the ratio is between about 0.85 and 0.9, these two nodal lines become closer and combine, which is not shown in figure 3. As the RF voltage ratio increases further, the two nodal lines separate in the x-direction as shown in figure 3(c).

Figure 3. Numerically calculated QΦ generated by the RF and centre-RF voltages. The plot is shown up to 3 eV. The white region near the trap surface indicates that QΦ is larger than 3 eV. The separation between contours is 0.03 eV.
Download figure:
Standard image High-resolution imageFigure 4(a) shows both the calculated height of the RF nodal line that is originally located at 400 µm above the trap surface in the case of a single-well potential, and the separation between the two RF nodal lines in the case of the double-well potential. The separation in the y-direction is indicated for RF voltage ratios lower than 0.85. The separation in the x-direction is indicated for ratios higher than 0.95. The height of the nodal lines becomes constant in this range. The potential barrier in the x-direction is estimated to vary from 10 to 50 meV as the RF voltage ratio is changed from 0.95 to 1.0. Figure 4(b) shows the magnitude of the q-parameter in the Mathieu equation obtained by fitting a quadratic curve to the calculated potential. The RF frequency and amplitude are assumed to be 15.5 MHz and 200 Vamp, respectively. When the RF voltage ratio is between 0.85 and 0.95, it is difficult to estimate the q-parameter by curve fitting because the potential becomes flat around the trap centre. Out of this range, the value is estimated to be between 0.2 and 0.25, which is the value usually set in laser cooling experiments.

Figure 4. (a) Numerically calculated ion height and separation of the two RF nodal lines. (b) Calculated q-parameters in the Mathieu equation versus the RF voltage ratio.
Download figure:
Standard image High-resolution image2.3. Static potential design
The static potential must be designed so that the null points of the electric field from the static potential overlap the RF nodes; otherwise, the RF field induces a large amount of micromotion. In our trap geometry, the RF nodes form two straight lines that are parallel to the z-axis. One of these lines passes through a point (−x0, y0, 0) and the other passes a point (+x0, y0, 0), where 2x0 and y0 are the separation of the two RF nodal lines in the case of double-well potential and the ion height, respectively. Here, we compute required voltages to set the static field to zero at these two points, simultaneously forming a confinement potential along the z-axis. Although the effect of the gap between electrodes is not taken into account, it is convenient to calculate the potential analytically [18, 21, 22] when we determine the voltages that satisfy these conditions. We apply static voltages to four end (V1, V2, V3, V4), two middle (V5, V6), and two side electrodes (V7, V8), and add a static voltage (V9) to the centre-RF electrode. We derive the required static voltages using the method of Lagrange multipliers according to [21]. The set of voltages is chosen to minimize the sum of the squares of the voltages

This should be done while satisfying the following condition at (−x0, y0, 0) and (+x0, y0, 0):
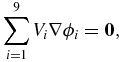
where ϕi is the normalized potential produced by the ith electrode, that is, the potential when 1 V is applied to the ith electrode. Six equations are derived from this condition because the x, y and z components of the electric field should be zero at each point. Furthermore, in order to confine the ions in the z-direction, the set of voltages is subject to
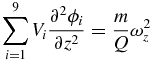
at both (−x0, y0, 0) and (+x0, y0, 0), where m is the ion mass and ωz is the axial trap frequency. Two equations are derived corresponding to the two points. The problem is to minimize the sum of the squares of the voltages subject to eight equations in total. Once the positions of RF nodal lines on the x–y plane and the axial trap frequency are determined, the required static voltages are obtained. For instance, when these values are set so that x0 = 0.06 mm, y0 = 0.18 mm and ωz = 2π × 150 kHz, the end voltages are obtained to be V1 = V2 = V3 = V4 = 4.65 V, the middle voltages V5 = V6 = −10.65 V, the side electrodes V7 = V8 = 0.87 V and the voltage added to the centre-RF electrode V9 = 0.79 V. Figure 5 shows the static potential in the x–y plane calculated above, and the plane containing the RF nodal lines. We note that this is calculated under the gapless approximation; therefore, higher voltages are needed if the size of the gaps is comparable to the electrodes. In this trap geometry, the x- and y-components of the null points of the electric field from the static potential are constant in the region of |z| < 0.1 mm. Out of this region, the x-components change and the null point generated by the static potential shifts from the RF nodal line. If the static electrodes are divided further, fine adjustment along the z-axis becomes possible and the overlapping region becomes larger.

Figure 5. (a) Schematic illustration of the two RF nodal lines around the trapping region. The trap surface lies in the x–z plane. Two star marks indicate the RF nodes on the x–y plane. The RF nodes form two straight lines passing through (−x0, y0, 0) and (+x0, y0, 0) that are parallel to the z-axis. (b) Contour plot of designed static potential in the x–y plane. (c) Contour plot of the designed static potential in a plane at y = y0 that is parallel to the x–z plane.
Download figure:
Standard image High-resolution image3. Experimental setup
The trap substrate is an alumina plate which is 11.5 mm square and 0.635 mm thick. Most of the electrodes used are formed by gold plating. The gold layer thickness is approximately 5 µm. One electrode of the same design is produced by gold sputtering, and has a thickness of approximately 1 µm. The ratio of the thickness to the electrode gap is lower than that for the plating type traps. The electrodes and pads in the ceramic pin grid array (CPGA) are wire bonded with 25 µm diameter aluminum wires. The trap on the CPGA mount is set in a vacuum chamber at 10−8 Pa. Calcium ions are loaded by photo-ionizing an atomic calcium beam that propagates along the z-axis to the trapping region. Photo-ionization is achieved by two-step excitation from the ground state to the continuum via the 4s4p 1P1 state. The wavelengths of the first and second step are 423 and 375 nm, respectively. Ions are laser-cooled and detected using the 4s 2S1/2–4p 2P1/2 transition at 397 nm and the 4p 2P1/2–3d 2D3/2 transition at 866 nm. The beam diameters of 397, 866, 423 and 375 nm are approximately 50, 65, 40 and 40 µm, respectively. All the beams are directed to the trapping region along the x-axis. Fluorescence from the ions is collected with collimating lenses placed at the top of the trap outside the vacuum chamber then detected by an electron multiplying charge coupled device camera.
We simultaneously apply an RF voltage ranging from 120 to 200 Vamp at 15.5 MHz to the RF electrodes and centre electrode at a certain ratio through a helical resonator. To adjust the RF voltage ratio VcRF/VRF, the output of the helical resonator is divided into two, connected to the RF and centre-RF electrodes through mechanically tuned capacitors [20] whose maximum capacitance is 100 pF. A circuit for a bias voltage V9 is also connected to the centre-RF electrode.
4. Results and discussion
We performed ion trapping with several electrodes with the same basic design but different electrode thickness. In each case, at the beginning, we trapped ions at the lower RF voltage ratio ranging from 0.7 to 0.8 in which the RF psudopotential was expected to be single-well. In this range, laser-cooled ions formed an ion string. In the 5 µm thick traps, ions were trapped between 270 and 280 µm above the trap surface at a ratio of 0.7 and between 240 and 270 µm at a ratio of 0.8. The ion height was lower than that for our previous trap [18], which was 400 µm above the trap surface. These values are in agreement with the simulated values shown in figure 4(a). Figure 6(a) shows an image of five calcium ions when the voltage ratio (VcRF/VRF) was set at 0.8. This was obtained when the RF voltage VRF was set to 150 Vamp at 15.5 MHz, the end voltages were static, V1 = V2 = V3 = V4 = 5.72 V, and the middle voltages V5 and V6 and side voltages V7 and V8 were 0 V. The static voltage added to the centre-RF electrode V9 was 4.79 V.

Figure 6. (a) Five calcium ions when the voltage ratio (VcRF/VRF) was set at 0.8. (b) Two, three and four calcium ions on two lines parallel to the z-axis. The RF voltage ratio was set at 1.0.
Download figure:
Standard image High-resolution image
When the RF voltage ratio was increased to 1.0 at which the RF pseudopotential was expected to be double-well, we observed ions on the two lines parallel to the z-axis. Images of two, three and four calcium ions on the two lines parallel to the z-axis are shown in figure 6(b). This was obtained when the RF voltage VRF was set to 120 Vamp at 15.5 MHz, the end voltages were static, V1 = V2 = V3 = V4 = 3.14 V, the middle voltages V5 and V6 were 0 V and the side voltages, also static, were V7 = 4.05 V and V8 = 3.93 V. The static voltage added to the centre-RF electrode V9 was 0.64 V. Without side voltages, ions were not sufficiently laser-cooled and did not form ion strings. The ion height was similar to that in the case of the single-well potential, which was higher than the value we calculated.
The performance of trapping in the double-well potential, in particular, the separation of the two ion strings and the required voltages varied depending on the trap chips. The observed separation, which was estimated to be 120 µm, ranged from 60 µm (figure 6(b)) to 200 µm at a RF voltage ratio of 1.0 in the different trap chips. We also tried trapping using a 1 µm thick trap. Ions were trapped at a ratio of 0.7; however, at higher ratios, it was difficult to find a stable trapping condition. We considered that the disagreement between the simulated and measured performance variation in trap chips could be caused by a stray electric field. Since the potential barrier between the two nodal lines is much shallower than the trap depth of the single-well potential, the actual potential could be strongly affected by stray electric fields. Charging of the alumina substrate between the electrodes would cause such a stray field. Compared to our previous trap [18], the area of alumina near the trapping region was larger because of the gaps of 50 µm between the centre-RF and RF electrodes. Furthermore, the distance between the ions and the trap surface was closer than that for the previous trap. These features make the influence of the surface on the double-well potential larger. To reduce the effect of charging of the alumina surface, the trap structure should be modified; to make the electrode thicker, and/or to make the gap smaller. If the scale of the trap is decreased, the required RF voltage becomes smaller, which means that the possibility of breakdown does not increase. For example, in the case of a half-sized trap, the required RF voltage is less than 100 Vamp and the gaps can be scaled down to 25 µm. In either case, the aspect ratio between the electrode thickness and the gap should be made smaller by employing a different microfabrication method.
Micromotion can be caused by a phase between the RF potentials applied to RF electrode and centre-RF electrode [23]. When we monitored the voltages applied to the RF and centre-RF electrodes, we did not observe a significant phase difference under the present condition. However, since we could not obtain its value with good accuracy, it is probable that a phase difference exists and it causes excess micromotion. In the current setup, we do not perform any compensation for the phase difference. To avoid this problem, an additional electrical circuit such us active locking of the output of the resonator demonstrated in [11] must be employed.
This trap can be used for the generation of effective interacting spin systems in quantum simulation. When a state-dependent force acts in addition to the trap and Coulomb forces, then the ion's internal dynamics and its motional degrees of freedom can be coupled, which gives us the desired spin–spin interaction [1]. We plan to generate the effective spin–spin coupling using the ground state Zeeman sublevels in 40Ca+ ions by a magnetic field gradient. We estimated the coupling strength [15] of a system of two strings each containing two ions at a distance of 120 µm. The trap frequencies ωx, ωy and ωz were assumed to be 2π × 720 kHz, 2π × 980 kHz and 2π × 150 kHz, respectively. Here, ωx is the secular frequency in the double-well potential. When the gradient field of 200 Tm−1 is applied in the z-direction, the intra-string coupling strength and the larger inter-string interaction strength were estimated to be 2π × 59 kHz and 2π × 370 Hz, respectively. This field gradient is achievable by using SmCo permanent magnets. To proceed quantum operation, the coupling strengths should be larger than the heating rate of ions Q2SE(ω)/4mℏω, where SE(ω) is the electric field noise density, ℏ is Planck's constant divided by 2π and ω is the trap frequency of the mode of interest [24]. Recently, significant reduction of the heating rate was performed by argon-ion-beam treatment [25]. They obtained SE(ω) = 2.5 × 10⁻¹³ V2 m−2 Hz−1 at ω = 2π × 3.6 MHz with the ion–electrode distance d of 40 µm. When we consider that SE(ω) is approximately proportional to ω−1d−4 and assume that d = 180 µm, SE(ω) is estimated to be 1.4 × 10⁻¹⁴ V2 m−2 Hz−1. The corresponding heating rate is 12 quanta s−1, which is below the estimated coupling strength.
5. Conclusion
We have designed a surface-electrode trap for parallel ion strings. Unlike the zigzag configuration usually produced in conventional linear Paul traps by increasing axial confinement, micromotion compensation is in principle possible by adjusting static voltages. This is because a double-well potential is generated by RF voltages and each ion is located on one of the RF nodal lines. We have shown how the static potential is designed so that the null points of the electric field from the static potential overlap the RF nodes. We have performed trapping of calcium ions on two lines parallel to the z-axis in a double-well potential. Future work will involve measurement of secular frequencies to evaluate the trap characteristics and demonstration of micromotion compensation.
Acknowledgments
This work is supported by the MEXT Kakenhi Quantum Cybernetics Project, 'Extreme Quantum World Opened up by Atoms' (No. 21104006) and JSPS through its FIRST Program.