


Abstract
Recent studies linking radiation exposure from pediatric computed tomography (CT) to increased risks of leukemia and brain tumors lacked data to control for cancer susceptibility syndromes (CSS). These syndromes might be confounders because they are associated with an increased cancer risk and may increase the likelihood of pediatric CT scans. We identify CSS predisposing to leukemia and brain tumors through a systematic literature search and summarize prevalence and risk. Since empirical evidence is lacking in published literature on patterns of CT use for most types of CSS, we estimate confounding bias of relative risks (RR) for categories of radiation exposure based on expert opinion about patterns of CT scans among CSS patients. We estimate that radiation-related RRs for leukemia are not meaningfully confounded by Down syndrome, Noonan syndrome and other CSS. Moreover, tuberous sclerosis complex, von Hippel–Lindau disease, neurofibromatosis type 1 and other CSS do not meaningfully confound RRs for brain tumors. Empirical data on the use of CT scans among CSS patients is urgently needed. Our assessment indicates that associations with radiation exposure from pediatric CT scans and leukemia or brain tumors reported in previous studies are unlikely to be substantially confounded by unmeasured CSS.
Export citation and abstract BibTeX RIS
1. Introduction
Five epidemiologic studies on cancer following radiation exposure from pediatric computed tomography (CT) scans have shown elevated risks of leukemia and brain tumors [1–5] and other studies are underway [6, 7]. These studies are record-linkage cohort studies on large numbers of patients collected from existing databases (health insurances and hospitals) with limited or no information on potential confounding factors, which may bias the radiation-cancer association. A confounder is associated with the exposure in the source population from which the cases arise and with the disease under study in the non-exposed population, and is not on the causal pathway.
Concerns have been raised about a possible overestimation of radiation-related risks in studies of pediatric CT scans and cancer due to confounding by indication (also called reverse causation) [8–13]. Confounding by indication occurs if the reason for a CT scan is associated with cancer risk.
With regard to CT studies, primary concern is about two sources of confounding by indication, namely sub-clinical tumors and cancer susceptibility syndromes (CSS). Cancer in a subclinical prodromal phase may cause symptoms which necessitate a CT scan. The CT radiation dose is solely associated with detection and not with disease causation. This source of confounding by indication is often amenable to evaluation through the use of an exclusion period. In contrast, CSS are congenital disorders and are associated with increased cancer risk at one or more sites [14]. The potential for confounding arises because CSS patients may have CT scans for early symptoms of the syndrome, diagnostic purposes, monitoring of disease progression, or associated comorbidities [15, 16]. We focus on CSS because we believe they are the potentially most important source of confounding by indication.
In the absence of empirical data, it appears plausible that CSS patients are more likely to have one or multiple CT scans than children without CSS. Because CT scans do not cause CSS, the observed increased risk of cancer following pediatric radiation exposure from diagnostic imaging might be partly due to confounding by CSS. The largest studies published to date did not adjust their risk estimates for CSS. Such data are likely not available, because most countries do not have registries or other easily accessible resources to identify CSS patients. For CSS where the direction of the potential confounding is known but not its magnitude, we use plausible scenarios to assess the magnitude of possible bias in studies of radiation exposure from pediatric CT scans [17].
This report focuses on pediatric CT scans, because children are more radiosensitive than adults. The endpoints of primary concern are leukemia and brain tumors. These diseases are the most common radiogenic malignancies among children, adolescents, and young adults and are the primary focus of published and ongoing epidemiologic studies on cancer risk following pediatric CT scan exposure [18]. Nevertheless, the results of our analyses provide guidance in situations which might be encountered in other epidemiological studies of diagnostic imaging and cancer risk. This article contains information which was published previously [19] and retracted [20] due to an inadvertent error in calculations for two CSS.
2. Methods
In short, we identify CSS predisposing to leukemia or brain tumors and characterize: their prevalence in the general population, the strength of their association with leukemia and/or brain tumors, and their life expectancy. We then calculate the magnitude of CSS-related confounding of relative risk (RR) estimates for leukemia and brain tumors after diagnostic CT scans, under various assumptions for the association between CSS and the frequency of CT scans.
2.1. Identification and characterization of CSS
We identified CSS that are associated with increased risk of either leukemia, or brain tumors, or both, at any age based on two major sources of information: (1) a table of genetic syndromes predisposing to childhood cancer from a thorough systematic review of the literature by a pediatric oncologist who specializes in these syndromes (JM) [14] and (2) a systematic overview of familial cancer syndromes [15]. Thirdly, we consulted with physicians specializing in genetic syndromes at three university hospitals (see acknowledgment) to identify any other rare eligible CSS. Finally, we queried the MEDLINE database for each CSS to determine prevalence, risk of leukemia and brain tumors, life expectancy, and the likelihood of diagnostic imaging (in particular CT scans). We included articles regardless of study design, as well as book chapters and systematic reviews. Articles were identified by name of the syndrome combined with epidemiology OR life expectancy OR systematic review OR leukemia OR CNS tumor OR brain tumors. We typically reviewed the most recent reports and focused on large studies with adequate methodology. Because empirical data on the role of imaging in the diagnosis and monitoring of CSS patients were extremely sparse, we relied on expert opinion to inform scenarios of CT use among CSS patients for those CSS with the highest potential of confounding within the time frame from 1990 to 2012. This interval represents the relevant follow-up period for most published and ongoing studies of cancer after pediatric CT [1–7].
2.2. Quantitative assessment of confounding bias
Most previous and ongoing epidemiologic studies include patients who received at least one pediatric CT scan. We assume that all study participants receive some exposure and thus evaluate potential confounding for higher exposure compared to lower exposure. Axelson's equation [21] was applied to estimate bias of the RR of leukemia or brain tumors by CT-related radiation exposure due to unmeasured confounding by a particular CSS as

where RROBS is the RR of cancer comparing arbitrarily defined high- and low-exposure groups without adjustment for CSS, RRADJ is the corresponding RR adjusted for the CSS, RRCD is the RR of cancer among CSS patients compared with others in the reference population, pHI is the CSS prevalence in the high exposed group, pLO is the CSS prevalence in the low exposed group. Let g = pHI/pLO and f = pLO/p0, where p0 is the CSS prevalence in the general population, so that the CSS prevalence in the high exposed group is a multiple of the prevalence in the low exposed (reference) group (pHI = g * pLO), while the prevalence in the low exposed group is a multiple of that in the general population, pLO = f * p0. If a CSS does not increase cancer risk (RRCD = 1), or if CT use is unrelated to CSS occurrence (pLO = pHI), there is no bias (bias = 1). An evaluation of potential bias for comparison of children with any CT scans compared to the general population (Standardized Incidence Ratio, SIR) can be carried out by setting pLO = p0, i.e. f = 1.
In the absence of empirical data on the uptake of CT scans among children with CSS, we chose 5 and 10 as the maximum values for f and g, respectively, in order to include scenarios where CSS patients receive substantially more CTs than others. For example, f = 5 and g = 10 for a particular CSS means that the prevalence of the CSS in a low exposed category is 5-fold that in the general population, and that the prevalence of the CSS in a high exposed category is 10-fold the prevalence in the low exposed category, i.e. 50-fold the general population prevalence. Even higher values appear unrealistic and are, therefore, not shown although—in theory—they are possible.
We also calculated collective bias from all CSS predisposing to leukemia (and/or brain tumors) by summing their prevalences and calculating the corresponding cancer risk as the mean of CSS-specific risks weighted by CSS prevalence. Finally, we considered life expectancy of all CSS. If life expectancy was severely limited, confounding would also be limited since the contribution of person-years from CSS patients would be very small and cancer events would not contribute to the high exposed categories due to commonly used lagging of exposure metrics by several years in this type of research.
3. Results
3.1. Identification and characterization of CSSs
We identified 31 CSS (table 1), 16 of which are characterized by population prevalence (p0) and estimated risk of leukemia or brain tumors (table 2). In decreasing order of prevalence, Down syndrome, fetal alcohol syndrome, Noonan syndrome, cystic fibrosis and neurofibromatosis type 1 (NF1) are the most common syndromes in the general population (range, 39–160/100 000). Down syndrome, Li–Fraumeni syndrome (LFS), NF1, tuberous sclerosis complex (TSC) and von Hippel–Lindau disease (VHL) carry the highest risks for leukemia or brain tumors. Childhood mortality from these syndromes is generally low so that they cannot be ruled out as potential confounders based on life expectancy (table 1).
Table 1. Cancer susceptibility syndromes with an increased risk of leukemia or brain tumors.
| Synonym | Prevalence | Life expectancy |
Risk of cancer | ||||
|---|---|---|---|---|---|---|---|
| Study design and population | Leukemia | Brain tumors | Credibility/validity | ||||
| Ataxia teleangiectasia | AT | 1–3/100 000 [15] | 20–49 years [48] | Case series of 78 AT patients [49], case report of 1 patient [50], 1 patient [51] | 1 × T-CLL/ 1 × T-PLL/ 5×-ALL 30% develop leukemia | 1 astrocytoma | − |
| 1 medullobalstoma | |||||||
| Biallelic Lynch syndrome | Mismatch repair-deficiency syndrome, Lynch syndrome 3 | <1/100 000 [52] | 1–19 years [53] | Case series of 92 patients [52] | 6 ALL 3 AML 1 CML 1 AL 12% develop leukemia | 32 glioblastoma | − |
| 5 neuroectodermal tumor | |||||||
| 4 medulloblastoma | |||||||
| 3 unspecified | |||||||
| Bloom syndrome | BS, BLM | <1/100 000 [54] | 20–49 years [54] | BLM Registry with 129 BS patients and 205 neoplasms [54] | 12 ALL /25 AML neoplasms | − | |
| Cardiofaciocutaneous syndrome | <1/100 000 [55] | Shortened lifespan due to cardiac involvements [55] | Case reports [56, 57] | 2 ALL | − | ||
| Cowden syndrome | <1/100 000 [58] | Shortened lifespan due to cancer risk [59] | Case reports of 2 patients [60], 1 patient [61], 1 patient [62], 3 patients [63] | 6 Cerebellar dysplastic gangliocytoma (Lhermitte–Duclos disease) 1 Meningioma | − | ||
| Cystic fibrosis | 40/100 000 [64] | 50–69 years [65] | Clinical study with follow- up of 1 ,888 patients [66] | SIR = 2.0 |
++ | ||
| Down syndrome | Trisomy 21 | 160/100 000 [22] | 20–49 years [67] | Retrospective cohort with 2841 patients [23] | All leukemia 0–4 years SIR 56.4 15–19 years SIR 9.88 all ages SIR 17.6 | ++ | |
| ALL 0–4 years SIR 40.7 15–19 years SIR 12.4 all ages SIR 24.4 | |||||||
| AML 0–4 years SIR 153.9 15–19 years SIR 10.3 all ages SIR 20.3 | |||||||
| Dubowitz syndrome | <1/100 000 [68] | Shortened lifespan [69] | Case series with 141 patients [69] | 1 leukopenia | − | ||
| 1 agranulocytosis | |||||||
| 2 pancytopenia | |||||||
| 1 ALL | |||||||
| Fanconi Anemia | FA | <1/100 000 [70] | 20–49 years [70] | Review with 1300 FA patients [71], prospective study with 754/279 patients [72, 73] cross sectional study 145 patients [74] and case reports [75, 76] | Leukemia 6–8.9%; SIR >40 MDS 6.8–10% | 2 medulloblastoma | + |
| 1 Glioma(2nd primary after NHL) | |||||||
| Fetal alcohol syndrome | FAS | 50–200/100 000 [77] | Normal [78] | Review with 13 patients with cancer [77], 1 patient [79] | 1 Leukemia | 1 Medulloblastoma | − |
| Gardner's syndrome | Familial colorectal polyposis | 6/100 000 [80] | 50–69 years [81] | Pooled registry with published reports: 56 families and 213 individuals [82] | Brain tumors: OR = 3.7, medulloblastoma: OR = 13.1 | − | |
| Gorlin syndrome | Nevoid basal cell carcinoma syndrome (NBCCS) | <1/100 000 [80] | >70 years [83] | Case series of 173 patients [84], case reports with 1 patient [85–89] | 3% of the 173 patients had medulloblastoma, case reports reported 5 medulloblastoma and 1 meningioma | − | |
| Incontinentia Pigmentia | Bloch- Sulzenberger syndrome | <1/100 000 [90] | Normal [91] | Case report of 4 females in three generations [92], Case report [93] | Pseudoplatelets, acute granulocytic leukemia | − | |
| Li-Fraumeni syndrome | 2–5/100 000 [94] | Shortened lifespan due to cancer risk [95] | Studies with 24 families [96], 28 families [97] and 24 families [98] | 4 Leukemia OR = 6.0 | 32 Brain tumors OR = 35 (95% CI: 19–60) | + | |
| Neurofibromatosis type 1 | NF1/von Recklinghausen disease | 30–39/100 000 [91] | 70 + years [91] | Clinicopathologic study of 100 patients [99], longitudinal study of 176 patients [100], retrospective study of 104 patients [101], population based study on > 3700 deaths [102], multicentre collaboration of 2108 patients [103], population based study of 135 patients [104], case reports [105, 106], population-based study (N = 1404) [107] | 15–20% of children with NF1 develop OPG 1 glioblastoma 1 medulloblastoma, Brian tumorsSIR = 27.5 (95% CI: 30.2–46.0) | + | |
| Neurofibromatosis type 2 | NF2/Multiple Inherited Schwannoma, Meningiomas and Ependymomas Syndrome | 2/100 000 [91] | 50–69 years [83] | Cross sectional study of 120 patients [108, 109], clinical spectrum 48 patients [110], 63 patients [111], population based study of 406 patients [112], clinical study of 83 patients [113], retrospective study of 283 patients [114, 115] | Bilateral vestibular schwannomas 90–95% | + | |
| Other cranial nerve schwannomas 24–51% | |||||||
| Intracranial meningiomas 45–58% | |||||||
| Nijmegen breakage syndrome | NBS | 1/100 000 [116] | Shortened lifespan due to cancer risk and infections [117] | Registry of 55 patients [117], case series of 8 patients [118], case reports [119–121] | 3 T-cell precursor ALL 1 AML 1 T-cell prolymphocytic Leukemia | 2 Medulloblastoma | − |
| Noonan syndrome | 40–100/100 000 [122] | Normal [123] | Retrospective cohort of 235 patients and 62 family members [124], retrospective cohort of 735 patients [125] | 10% Myeloproliferative disorder, 3 precursor B-ALL,4 Juvenile myelomonocytc leukemia, 3 ALL, 2 CMML, RR = 12 | + | ||
| Rubinstein–Taybi syndrome | Broad thumb- hallux | <1–1/100 000 [126] | Normal [127] | Case reports [128, 129] | 1 ALL | 1 Meningioma | − |
| Severe congenital neutropenia | SCN | <1/100 000 [91] | NM | Registry with 82 patients [130] | MDS and AML | − | |
| Silver–Russel syndrome | 1/100 000 [131] | Normal [132] | Case reports [133, 134] | 1 craniopharyngioma | − | ||
| 1 pilocytic astrocytoma | |||||||
| Sotos syndrome | 7/100 000 [91] | Normal | Case series with 224 patients [135] and 27 patients [136] | 3 ALL 12% develop leukemia | − | ||
| Sturge-Weber Syndrome | SWS/ Encephalofacial angiomatosis | 2–5/100 000 [137] | Normal [138] | Retrospective study with 55 patients [139, 140] | 3 ipsilateral leptomeningeal angioma | ||
| Trisomy 8 mosaicism | T8Ms/Mosaic Warkany Syndrome | <1/100 000 [141] | NM | 15–20% develop leukemia, syndrome often detected at leukemia diagnosis | − | ||
| Trisomy 13 | Patau syndrom | 4/100 000 [142] | <1 years [143] | Case report [144] | 1 Pilocytic Astrocytoma | − | |
| Tuberous sclerosis complex | TSC | 8/100 000 [28, 145] | Shortened [146] | Review [91, 146], retrospective cross-sectional study with 285 patients [29] | SEGA: prevalence estimate: 0.11, (95% CI: 0.09–0.14) |
− | |
| Turcot syndrome | Glioma polyposis | 10/100 000 [91] | Unknown | Registry with 14 families [147] | Increased | CNS: RR all ages = 7, RR 0–29 years = 23 | − |
| Turner syndrome | 50/100 000 females [148] | NM | Cohort study with 3425 patients [148], case report [149] | 1 Leukemia | 7 Meningioma: RR = 12.0 (95% CI: 4.8–24.8) 5 other brain tumors: RR = 2.5 (95% CI: 0.8–5.8) | + | |
| von Hippel–Lindau disease | VHL | 2–3/100 000 [32] | 50–69 years [83] | Follow-up study of 225 patients with VHL-related CNS hemangioblastoma [33] | CNS (hemangioblastoma) 60–90% prevalence | + | |
| Werner syndrome | <1/100 000 [150] | Short but depends on type | Literature review with 189 patients from case reports [150] | Leukemia and pre- leukemia |
Meningioma | − | |
| Xeroderma Pigmentosum | XP | <1/100 000 [151] | Shortened lifespan due to neurological abnormalities [152] and/or skin cancer [153] | Case report of 4 patients [154], case reports of 132 patients [155], systematic study of 830 cases [153] | 1 glioblastoma | − | |
| 3 brain sarcoma | |||||||
| 1 medulloblastoma | |||||||
aReported life expectancies vary greatly with length of follow-up, study inclusion criteria, follow-up methods for medical outcomes and vital status, as well as the calendar period covered by the study. Therefore reported values in single studies should be interpreted with caution. Where feasible, we classified all values as <1, 1–19, 20–49, 50–69, >70; normal; if little information on shortened life-span was available, we reported 'shortened'.
bNontransplanted CF patients or before transplantation for transplanted patients.
cSlightly increased number of SEGAs for recent years due to screening.
dPreleukemia: myelofibrosis, myelodysplasia, refractory anemia with excess blasts.
Abbreviations: AL, acute leukemia; ALL, acute lymphocytic leukemia; AML, acute myeloid leukemia; CMML, chronic myelomonocytic leukemia; CML, chronic myeloid leukemia; MDS, myelodysplastic syndrome; NM, not mentioned; OPG, optic pathway gliomas; OR, odds ratio; RR, relative risk; T-CLL, T-cell chronic lymphocytic leukemia; T-PLL, T-cell prolymphocytic leukemia; yr, year; CI, confidence interval; SIR, standardized incidence ratio; NHL, non-Hodgkin lymphoma; CNS, central nervous system.
Credibility/validity
Table 2. Selected cancer susceptibility syndromes (CSS) by general population prevalence and relative risk of leukemia and brain tumors.
| General population prevalence of CSS (per 100 000) | |||||
|---|---|---|---|---|---|
| <1 | 1– < 5 | 5– < 25 | 25– < 50 | 50–160 | |
| RR(CSS–Cancer) |
|||||
| Low | — | — | — | CF |
— |
| Medium | Gorlin |
— | Gardner's |
— | Noonan |
| Turner |
|||||
| High | — | NF type 2 |
Turcot |
NF type 1 |
Down |
| Sotos |
|||||
| Li-Fraumeni |
|||||
| Very high | Biallelic Lynch |
AT |
TSC |
— | — |
| Trisomy 8 |
VHL |
||||
| Fanconi |
|||||
aLow: RR = 1–2, medium: RR = 2–15, high: RR = 15–50, very high: RR > 50. bRisk of leukemia. cRisk of brain tumors. Abbreviations: AT, ataxia telangiectasia; CF, cystic fibrosis; NF, neurofibromatosis; VHL, von Hippel–Lindau disease; TSC, tuberous sclerosis complex; CSS, cancer susceptibility syndrome; RR, relative risk. Note: Syndromes lacking a quantitative estimate of prevalence or RR are not included in the table, see discussion. RRs for leukemia. Down: RR = 20 [23]. Noonan: RR = 12 [125]. CF: RR = 2.0 [66]. Fanconi: RR = 40 [71]. Trisomy 8: 15–20% develop leukemia [141], annual leukemia incidence up to age 70 years 2/100 000 (Dutch Cancer Registry), i.e. RR = 0.18/[(2/100 000) * 70] = 129. Sotos: 3% develop leukemia [135, 136], annual leukemia incidence up to age 70 years 2/100 000 (Dutch Cancer Registry), i.e. RR = 0.03/[(2/100 000) * 70] = 21. Biallelic lynch: 12% develop leukemia [52], annual leukemia incidence up to age 20 years 5/100 000 (Dutch Cancer Registry), i.e. RR = 120. AT: 30% develop leukemia [49], annual leukemia incidence up to age 50 years 5/100 000 (Dutch Cancer Registry), i.e. RR = 120. RRs for brain tumors. Gardner's: RR = 13.1 [82]. Li_Fraumeni: RR = 40 [96]. Turcot: RR = 23 [147]. Turner: RR = 12 [148]. NF type 1: RR = 37.5 [107]. TSC: 10% develop TSC-specific brain tumors before 20–25 years of age [29], annual brain tumor incidence up to age 20 years 4/100 000, i.e. RR = 0.1/[(4/100 000) * 20] = 125. VHL: 70% develop hemangioblastoma [33], annual brain tumor incidence up to age 70 years 7/100 000 (Dutch Cancer Registry), i.e. RR = 0.7/[(7/100 000) * 70] = 143. Gorlin: 3% develop medulloblastoma [84], annual brain tumor incidence up to age 70 years 7/100 000 (Dutch Cancer Registry), i.e. RR = 0.03/[(7/100 000) * 70] = 6. NF type 2: 24% develop schwannomas [114], annual brain tumor incidence up to age 70 years 7/100 000 (Dutch Cancer Registry), i.e. RR = 0.24/[(7/100 000) * 70] = 49.
3.2. Confounding of leukemia risk due to specific CSS
Down syndrome is a genetic disorder caused by the presence of all or part of a third copy of chromosome 21 and has a prevalence of about 160/100 000 [22]. It is typically associated with physical growth delays, characteristic facial features, and mild to moderate intellectual disability. Leukemia risk among patients with Down syndrome is about 20-fold the rate in the general population [23]. Ignoring confounding from Down syndrome could maximally bias leukemia RRs about 2.2-fold (pHI/pLO = 10pLO, pLO/p0 = 5, figure 1(a)).
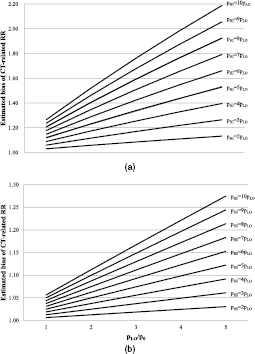
Figure 1. (a) Estimated potential bias of the relative risk of leukemia among high versus low exposed subjects by failure to adjust for Down syndrome. Bias = RROBS/RRADJ = [RRCD * pHI + (1 − pHI)]/[RRCD * pLO + (1 − pLO)], where RROBS is the RR of leukemia comparing arbitrarily defined high and low (reference) exposure groups without adjustment for Down syndrome, RRADJ is the corresponding RR adjusted for Down syndrome, RRCD is the RR of leukemia due to Down syndrome in the reference population (RRCD = 20), and pHI, pLO, and p0 are the prevalences of Down syndrome in the high exposed, low exposed and general population, respectively [21]. Example: under the assumption that the prevalence of Down syndrome among low exposed subjects is 5 times the general population prevalence (pLO/p0 = 5), and among the high exposed subjects is twice that in the low exposed group (pHI = 2 * pLO = 2 * 5p0, i.e. 10 times the general population prevalence), the RR of leukemia not adjusted for Down syndrome overestimates the RR adjusted for Down syndrome by 13%. (b) Estimated potential bias of the relative risk leukemia among high versus low exposed subjects by failure to adjust for Noonan syndrome. Bias = RROBS/RRADJ = [RRCD * pHI + (1 − pHI)]/[RRCD * pLO + (1 − pLO)], where RROBS is the RR of leukemia comparing arbitrarily defined high and low (reference) exposure groups without adjustment for Noonan syndrome, RRADJ is the corresponding RR adjusted for Noonan syndrome, RRCD is the RR of leukemia due to Noonan syndrome in the reference population (RRCD = 12), and pHI, pLO, and p0 are the prevalences of Noonan syndrome in the high exposed, low exposed and general population, respectively [21].
Download figure:
Standard image High-resolution imageResults for Down syndrome indicate that the potential for confounding depends on the excess frequency of CT scans among Down syndrome patients. Based on a recent review [24], imaging modalities other than CT were adequate for Down syndrome patients in most clinical situations (supplementary table S1 (stacks.iop.org/JRP/36/953/mmedia)). In the absence of quantitative data from the literature, we interviewed a Down syndrome expert (MEW, pediatrician and head of the Down Center Netherlands), a pediatrician (Dr Joost Frenkel, University Medical Center Utrecht), and an experienced primary care physician (Dr Bart Meijman, Amsterdam). They indicated that about 20–36% of children with Down syndrome suffer lung problems such as hyperplasia or cysts [24], and 30–70% of those might have gotten one diagnostic chest CT since 1990. For cardiac problems, which occur in about 44% of Down syndrome patients [25], ultrasound is the imaging modality of choice, except for a small fraction of children who need an interventional procedure. Abdominal problems (e.g. 8% have duodenal atresia or Hirschsprung's disease [26]) are usually evaluated by x-ray. Experts stated that trauma does not seem to occur more often among children with Down syndrome compared with other children and that the fraction of Down syndrome children with several CT scans due to the syndrome is considered very low. Based on a conservative quantification of this information, if 6–25% of all children with Down syndrome undergo one additional chest CT during their childhood (say, under 10 years of age) compared with other children, this would represent 6–25 CT scans per 1000 Down syndrome patients per year attributable to Down syndrome in addition to the approximately 7 CT scans per 1000 children per year in the general Dutch population [27]. There would then be between (6 + 7)/7 = 1.9- and (25 + 7)/7 = 4.6-times as many CT scans among Down syndrome patients than among other children, leading to between 3% and 12% bias of the SIR (pLO = p0 and pHI between 1.9 * pLO and 4.6 * pLO) and no appreciable bias of the RR because several CT scans due to Down syndrome are very unlikely (figure 1(a)).
For Noonan syndrome and leukemia, the unadjusted RR overestimated the adjusted RR by maximally 30% (figure 1(b)). Other CSS were either less prevalent or their association with leukemia was weaker, or both, resulting in bias of 10% or less.
3.3. Confounding of brain tumor risk due to specific CSS
TSC is an autosomal-dominant neurocutaneous disorder with a prevalence of about 8/100 000 [28]. It is characterized by tumors involving many organ systems including the brain, heart, kidneys and skin, as well as other organ dysfunction and mental retardation [37]. Subependymal giant cell tumors (SEGAs), which develop in 9–14% of patients and almost always occur before 20–25 years of age [29], are a major feature specific for TSC [15]. Bias can be up to 1.4-fold (figure 2(a)). In the past, screening for SEGAs was recommended among children with TSC using CT or magnetic resonance imaging (MRI) of the head every 1–3 years [30]. MRI appears to be the preferred modality in more recent years [31] and has been used almost exclusively in the Netherlands since at least 2000 (personal communication: Drs. Bernard Zonnenberg and Floor Janssen, University Medical Center Utrecht; Dr Marie Claire de Wit, Erasmus Medical Center Rotterdam). A scenario consistent with these expert opinions assumes that 10% of the TSC patients in a CT study cohort were born before 1990 and received, on average, 2–3 head CTs during an average of 25 years follow-up per patient, with corresponding numbers of 30%, 1–2 head CTs, and 15 years follow-up, as well as 60%, no head CT, and 10 years of follow-up for those born in 1990–2000 and after 2000, respectively. In this case, between 38 and 69.2 head CTs per 1000 TSC patients per year would be indicated by TSC alone, which results in (38 + 7)/7 = 6.4- to (69.2 + 7)/7 = 10.9-times as many head CTs among TSC patients compared with others or, equivalently, a 6.4- to 10.9-fold higher prevalence of TSC among children with at least one CT scan compared to children in the general population. Therefore, the potential bias of the SIR ranges between 6% and 10% (pLO = p0 and pHI between 6.4 * pLO and 10.9 * pLO) and bias of the RR is below about 1.4 despite the fact that a non-negligible fraction of TSC patients might have received a considerable number of head CTs (figure 2(a)).

Figure 2. (a) Estimated potential bias of the relative risk for a brain tumor among high versus low exposed subjects by failure to adjust for TSC. Bias = RROBS/RRADJ = [RRCD * pHI + (1 − pHI)]/[RRCD * pLO + (1 − pLO)], where RROBS is the RR of brain tumors comparing arbitrarily defined high and low (reference) exposure groups without adjustment for TSC, RRADJ is the corresponding RR adjusted for tuberous sclerosis complex, RRCD is the RR of brain tumors due to TSC in the reference population (RRCD = 125), and pHI, pLO, and p0 are the prevalences of TSC in the high exposed, low exposed and general population, respectively [21]. (b) Estimated potential bias of the relative risk for a brain tumor among high versus low exposed subjects by failure to adjust for VHL disease. Bias = RROBS/RRADJ = [RRCD * pHI + (1 − pHI)]/[RRCD * pLO + (1 − pLO)], where RROBS is the RR of brain tumors comparing arbitrarily defined high and low (reference) exposure groups without adjustment for VHL disease, RRADJ is the corresponding RR adjusted for VHL disease, RRCD is the RR of brain tumors due to VHL disease in the reference population (RRCD = 143), and pHI, pLO, and p0 are the prevalences of VHL disease in the high exposed, low exposed and general population, respectively [21].
Download figure:
Standard image High-resolution image
VHL disease is an autosomal dominant disorder that causes hemangioblastomas of the retina and the central nervous system, renal cell carcinomas, pancreatic cysts and tumors, among other manifestations. At a prevalence of 2–3/100 000 [32], 60–90% of patients with VHL disease develop hemangioblastomas of the cerebellum or the brain stem [33]. VHL disease biased brain tumor risk by up to 1.2-fold (figure 2(b)).
Because VHL-associated hemangioblastomas of the cerebellum and the brain stem occur rarely during childhood, screening is recommended to commence in the mid-teens and MRI is uniformly the modality of choice, although CT was mentioned in earlier versions of some guidelines [34–36]. Accordingly, imaging of the head for screening purposes among young children with VHL disease was not commonly done in the Netherlands. When performed, CT might have been used before 1990–1995, while MRI is the modality of choice since then. CT also has no important role in the screening for other VHL-related morbidity (personal communication: Prof. Peter Vandertop, VU University Medical Center Amsterdam and Academic Medical Center Amsterdam; Dr Netteke Schouten-van Meeteren, Emma Children's Hospital, Academic Medical Center Amsterdam; Dr Theo van Os, Academic Medical Center Amsterdam; Prof. Thera Links, University Medical Center Groningen; Dr Frederik Hes, University Medical Center Leiden). It is therefore unlikely that a relevant number of VHL patients are included in an epidemiologic study on CT scanning and most of those would not have received several head CTs during childhood due to VHL disease.
NF1 is an autosomal dominant disorder characterized by the development of multiple benign tumors of nerves and skin (neurofibromas) and areas of hypo- or hyperpigmentation of the skin. The most severe confounding bias caused by NF1 was about 50% (supplementary figure S1).
Other CSS were either less prevalent or their association with brain tumors was weaker, or both. As a consequence, bias was 20% or less.
3.4. Confounding bias due to combined CSS
Combining all CSS predisposing to leukemia resulted in a potential confounder with a prevalence of 282/100 000 and a RR for leukemia of 59.1. This combination of prevalence and RR resulted in similar confounding as Down syndrome alone (data not shown). Any CSS predisposing to brain tumors were prevalent at 113/100 000 and carried a 50-fold elevated brain tumor risk, which resulted in confounding of the same magnitude as TSC alone (data not shown).
4. Discussion
Our evaluation suggests that leukemia-predisposing CSS do not substantially confound the association between radiation exposure from pediatric CT scans and leukemia risk because they are too rare and/or too weakly associated with leukemia or, in the case of DS, CT uptake is only moderately elevated among patients, if at all. For the same reason, brain tumor-predisposing CSS are unlikely to cause meaningful confounding. Since these conclusions are based on assumptions about CT use among CSS patients, robust empirical data are urgently needed.
A relevant question is whether bias due to CSS can create a dose–response relationship in the absence of a causal association between radiation and cancer. We did not directly evaluate bias of the linear excess relative risk per Gray (ERR/Gy), the commonly used measure of the strength of a dose–response between radiation exposure and cancer, because we are not aware of a published formula for the relative bias due to confounding. However, our results show that bias due to CSS can create increasing RR estimates for categories of increasing radiation exposure in the absence of a causal association, but only in very specific circumstances. If CT scanning among patients with a particular CSS is such that the prevalence of CSS patients increases across categories of increasing dose, bias of RRs comparing subjects exposed at different levels with the same reference level will then also increase with exposure level, leading to a positive ERR/Gy. This does not require the cancer risk due to CSS to increase with radiation exposure.
Three studies with some information on indication for CT scanning have recently been published. The first study included 67 274 children who received at least one CT scan before age 10 years between 2000 and 2010 in one of 21 French hospitals and who were followed for, on average, 4.4 years, with cancer diagnosed before age 15 years defined as the outcome of interest [5]. ERRs for leukemia or brain tumors were not or only mildly attenuated after adjustment for Down syndrome or neurofibromatosis, respectively, based on hospital discharge information. More substantial attenuation of the brain tumor ERR was observed for the group of so-called 'other phakomatoses', which includes TSC. A note of caution in interpreting these findings is warranted, though. First, because of the small sample size and short follow-up, all confidence intervals were wide and included unity, and attenuation for any of the evaluated (groups of) CSS was less than about 10% of the confidence interval width. Second, ERRs were not attenuated when patients with relevant CSS were excluded from analysis [38–41]. Third, very high prevalences were observed for several CSS, most likely owing to over-representation of referral centers among participating hospitals, which limits the generalizability of these results for nation-wide samples. The second study followed 44 584 children who received at least one CT scan before age 15 years in the period 1980–2010 in one of 20 German hospitals for, on average, 3.6 years and ascertained cancers diagnosed before age 15 years [4]. Standardized incidence ratios were non-significantly elevated for leukemia and brain tumors. Radiology reports, which were available for most of the 12 leukemias and 7 brain tumors, respectively, indicated potential confounding by indication for one brain tumor case. Exclusion of that case slightly attenuated the brain tumor SIR. The third study is a reanalysis of the UK study [1] including information on CSS from radiology records and death certificates for 40% of all subjects. Additional clinical information was collected from pathology reports for 62% and 66% of leukemia and brain tumor cases. When patients with a CSS were excluded (4 leukemia cases, 13 brain tumor cases, 104 non-cases), results did not change [42].
Our study has a number of limitations. Although patients with CSS suffer from a diverse spectrum of health complaints [15] for which CT scans are an appropriate diagnostic imaging modality [16], actual quantitative health care utilization data are scarce and therefore we had to rely on subjective scenarios. For illustration, with 5–7% of all children in the Netherlands receiving at least one CT before their 18th birthday, a 10-fold higher proportion among patients with a particular CSS implies that about 50–70% of CSS patients receive at least one CT. Second, for some of the CSS evaluated here, there is evidence of increased radio-sensitivity (e.g. AT, XP, LFS) [15]. For those CSS, we might have underestimated bias since the CSS-related cancer risk increases with the level of radiation exposure. However, these CSS are very rare. Also, affected families and medical professionals are well aware of the radiosensitivity, which likely implies a prevalence of CT use lower than that of the general population. Therefore, these syndromes are very unlikely to be potent confounders. Third, expert opinions on the use of CT scans among patients with CSS reflect clinical practice in the Netherlands. We believe this does not limit the generalizability since results are likely similar both across Western countries with comparable number of pediatric CTs and for countries with higher levels of pediatric CT scanning, as long as CT scanning is more common across all indications. However, it should be noted that our results are only generalizable to countries with a roughly similar prevalence of a CSS. Fourth, there was no empirical base for the choice of the maximum values for f and g. We aimed to include scenarios with a substantial uptake of CTs among CSS patients and still considered possible by experts. Even more extreme scenarios appear unrealistic and are therefore not shown (although they might be possible and corresponding bias can be calculated via the formula). Fifth, confounding by other risk factors such as socio-economic status, birth weight and parental smoking is beyond the scope of these analyses [43, 44]. Finally, although we thoroughly reviewed the literature, we were not able to find prevalence estimates for some CSS and those we found for others are very heterogeneous with regard to precision. Nevertheless, we believe that the CSS we identified cover all relevant situations.
Besides CSS, other predisposing conditions can confound CT-related cancer risk, for instance, leukemogenic drugs or total body irradiation prior to stem cell transplantation for non-malignant diseases, such as Fanconi anemia, aplastic anemia, immune system deficiencies, or congenital malformations in the nervous and circulatory system [45]. Confounding by these conditions, although not the objective of this report, can be easily assessed by assigning the condition to one of the cells in table 2. For example, common variable immune deficiency (CVID) has a prevalence of approximately 1 in 30 000 live births [46] and an increased risk of leukemia [47] although the magnitude is not known. Based on our results, even if leukemia risk was substantially increased, confounding bias would be negligible given the low prevalence.
5. Conclusion
In conclusion, our assessment of confounding of CT-related cancer risks indicates that associations with leukemia and brain tumors reported in previous studies [1–5] are unlikely to be substantially confounded by unmeasured CSS. Robust empirical data on the use of CT among CSS patients are needed in order to inform the interpretation of previous and future studies of the subject.
Acknowledgments
We sincerely thank Drs Theo van Os (Academic Medical Center Amsterdam), Joost Frenkel, Bernard Zonnenberg and Floor Janssen (University Medical Center Utrecht), Bart Meijman (Amsterdam), Marie Claire de Wit (Erasmus Medical Center Rotterdam), Frederik Hes (LUMC Leiden), Otto Visser (Netherlands Comprehensive Cancer Organization) and Netteke Schouten-van Meeteren (Emma Children's Hospital, Academic Medical Center Amsterdam) as well as Professors Thera Links (UMC Groningen) and Peter Vandertop (VU University Medical Center Amsterdam and Academic Medical Center Amsterdam) for providing their expertise. This work was supported by the European Community Seventh Framework Programme (grant number FP7/2007-2013) under Grant Agreement Number 269912-EPI-CT: 'Epidemiological study to quantify risks for paediatric computerized tomography and to optimize doses' and by Worldwide Cancer Research formerly known as Association for International Cancer Research (AICR) (grant number 12-1155). Dr Jay Lubin is supported by the Intramural Research Program of the National Cancer Institute, National Institutes of Health, Department of Health and Human Services. Dr Cecile Ronckers is supported by the Dutch Cancer Society. Funders had no involvement in the study design, data collection, analysis and interpretation, the writing of the report, or the decision to submit the paper for publication.