


ABSTRACT
A significantly updated version of the NASA Ames PAH IR Spectroscopic Database, the first major revision since its release in 2010, is presented. The current version, version 2.00, contains 700 computational and 75 experimental spectra compared, respectively, with 583 and 60 in the initial release. The spectra span the 2.5–4000 μm (4000–2.5 cm-1) range. New tools are available on the site that allow one to analyze spectra in the database and compare them with imported astronomical spectra as well as a suite of IDL object classes (a collection of programs utilizing IDL's object-oriented programming capabilities) that permit offline analysis called the AmesPAHdbIDLSuite. Most noteworthy among the additions are the extension of the computational spectroscopic database to include a number of significantly larger polycyclic aromatic hydrocarbons (PAHs), the ability to visualize the molecular atomic motions corresponding to each vibrational mode, and a new tool that allows one to perform a non-negative least-squares fit of an imported astronomical spectrum with PAH spectra in the computational database. Finally, a methodology is described in the Appendix, and implemented using the AmesPAHdbIDLSuite, that allows the user to enforce charge balance during the fitting procedure.
Export citation and abstract BibTeX RIS
1. INTRODUCTION
Discovered during the 1970s, the family of emission features formerly known as the unidentified infrared bands are now generally attributed to polycyclic aromatic hydrocarbons (PAHs) and closely related species (e.g., Draine & Li 2007; Tielens 2008; Siebenmorgen et al. 2013, and references therein). The features that comprise this apparently universal spectral signature contain a wealth of information about the physical conditions in the emitting regions and the nature of the PAH carriers (e.g., Joblin & Tielens 2011, and references therein). However, community-wide exploitation of these features as astrophysical and astrochemical probes was slow in coming because the IR properties of PAHs under interstellar conditions were largely unknown for well over twenty years after the bands were discovered.
Since the early 1990s, IR spectra of PAHs were determined experimentally and computationally at a handful of institutions (e.g., DeFrees et al. 1993; Vala et al. 1994; Joblin et al. 1994; Szczepanski et al. 1995; Langhoff 1996; Hudgins & Allamandola 1997; Pauzat et al. 1997; Hudgins & Sandford 1998c; Bauschlicher 2002; Mattioda et al. 2003, 2005b; Malloci et al. 2007, and references therein). For the past twenty years a considerable effort in this area has been made at NASA Ames Research Center, with the long term goal to collect the spectra of a sufficiently large number of PAHs to properly test the PAH hypothesis and, if shown promising, develop it into a model and new astronomical probe. The PAHs for which spectra were determined represent the range in size, charge, and molecular structures considered to be plausible members of the interstellar PAH population. This spectral collection was assembled into a database and made available to the scientific community at large in 20106. In addition to providing access to the spectra, the site allows one to query and examine the content of the database. Furthermore, the Web site offers tools to work with the spectroscopic data as well as a suite of IDL object classes (a collection of programs utilizing IDL's object-oriented programming capabilities) that allows working with the downloaded database offline, i.e., the AmesPAHdbIDLSuite. The initial content of the computational database, together with the Web site, its tools and the AmesPAHdbIDLSuite have been discussed in Bauschlicher et al. (2010), hereafter Paper I. The content of the experimental database will be discussed in a forthcoming paper (A. L. Mattioda et al., in preparation).
This paper summarizes the additions and revisions to the database, site, and tools now available in version 2.00. Section 2 describes the updated contents of the computational and experimental parts of the database. Section 3 presents the revisions and improvements of the Web site and online tools and Section 4 the AmesPAHdbIDLSuite. An application of the non-negative least-squares fitting procedure to decompose an astronomical spectrum into PAH type subclasses is given in Section 5. The main points of the paper are summarized in Section 6 and the paper ends with the Appendix which explains how one can impose detailed charge balance constraints when using the fitting procedure.
Those making use of the theoretical and/or experimental information in the database, the Web site, its tools, and/or the AmesPAHdbIDLSuite are asked to refer to this paper as well as Paper I, as it will justify site upgrades and maintenance. First-time users who download spectra from the Web site are asked to provide contact information to receive updated information on added data and tools.
2. CONTENTS OF THE DATABASE
2.1. The Computational PAH Database
Version 2.00 of the computational database has been expanded by including the density functional theory (DFT) computed spectra of protonated PAHs (Ricca et al. 2011a), PAHs with five and seven fused ring defects (Ricca et al. 2011b), the coronene series of PAHs containing up to 384 carbon atoms (Ricca et al. 2012), PAHs with some or all hydrogens removed (Bauschlicher & Ricca 2013), and others. In total 129 species have been added and 12 removed due to duplication or errors (e.g., two coronene–iron neutrals that were actually just van der Waals complexes) compared to version 1.10 (Paper I). The computational portion of the database parallels that described by Malloci et al. (2007), which contains the DFT computed spectra of 40 PAHs in four different charge states augmented with molecular information derived from the use of larger basis-set calculations, including that from their own work and other databases, and UV–visual absorption spectra.
Table 1 compares the distribution of molecules in the current version of the computational database, broken down by size, charge, and composition, with that from 2010. This information is presented graphically in Figures 1 and 2, which show the size breakdown by composition and charge, respectively. Figure 3 summarizes the PAH composition and charge distributions in the database in two pie charts. Note that earlier versions of the theoretical database are still accessible through the Web site.
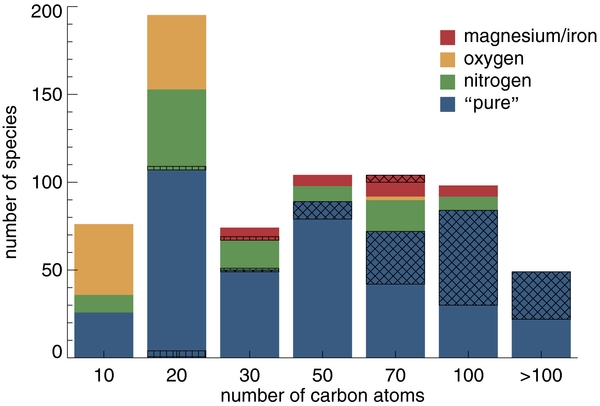
Figure 1. Breakdown of the PAHs in the computational database by composition and number of carbon atoms. "Pure" PAHs contain only carbon and hydrogen; nitrogen/oxygen/magnesium/iron refer to PAHs containing these elements as well. The cross-hatched and hatched areas indicate additions and removals between versions 1.10 and 2.00, respectively.
Download figure:
Standard image High-resolution image
Figure 2. Breakdown of the PAHs in the computational database by charge and number of carbon atoms. The cross-hatched and hatched areas indicate additions and removals between versions 1.10 and 2.00, respectively.
Download figure:
Standard image High-resolution image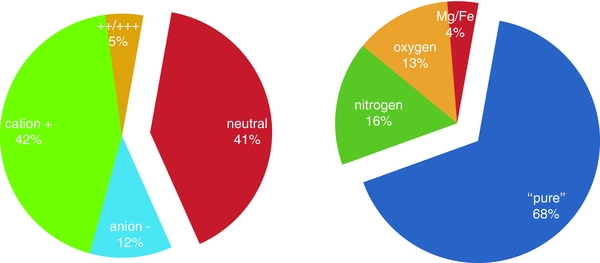
Figure 3. PAH charge and composition distribution in version 2.00 of the computational database given in percentages. Nitrogen refers to PAHs containing one or two nitrogen atoms in the hexagonal framework, "pure" refers to PAHs comprised solely of carbon and hydrogen, oxygen refers to PAHs containing one or more oxygen atoms, mostly in side groups, and Mg/Fe refers to PAHs containing other metals complexed to the hexagonal framework, e.g., magnesium, iron, etc.
Download figure:
Standard image High-resolution imageTable 1. Breakdown of the Molecules in Version 2.00 of the Computational Database by Charge, Composition, and Size
| Number of Carbon Atoms | ||||||||
|---|---|---|---|---|---|---|---|---|
| 1–10 | 11–20 | 21–30 | 31–50 | 51–70 | 71–100 | 101–386 | Total | |
| Charge | All Molecules | |||||||
| All | 76(0) | 195(−6) | 74(−2) | 104(10) | 104(34) | 98(54) | 49(27) | 700(117) |
| Neutral | 39(1) | 98(−1) | 37(−1) | 35(4) | 27(12) | 31(20) | 19(11) | 286(46) |
| Anion − | 3(0) | 11(−2) | 4(0) | 20(3) | 13(8) | 20(15) | 14(7) | 85(31) |
| Cation + | 34(−1) | 86(−3) | 26(−1) | 43(3) | 48(14) | 42(18) | 16(9) | 295(39) |
| ++/+++ | 0(0) | 0(0) | 7(0) | 6(0) | 16(0) | 5(1) | 0(0) | 34(1) |
| PAHs with Only Carbon and Hydrogen | ||||||||
| All | 26(0) | 107(−4) | 50(1) | 89(10) | 72(30) | 84(4) | 49(27) | 477(118) |
| Neutral | 12(1) | 55(−1) | 27(1) | 34(4) | 25(10) | 31(20) | 19(11) | 203(46) |
| Anion − | 3(0) | 9(0) | 4(0) | 20(3) | 13(8) | 20(15) | 14(7) | 83(33) |
| Cation + | 11(−1) | 43(−3) | 15(0) | 29(3) | 24(12) | 28(18) | 16(9) | 166(38) |
| ++/+++ | 0(0) | 0(0) | 4(0) | 6(0) | 10(0) | 5(1) | 0(0) | 25(1) |
| PAHs with Nitrogen | ||||||||
| All | 10(0) | 46(−2) | 17(−1) | 9(0) | 18(0) | 8(0) | 0(0) | 108(−3) |
| Neutral | 5(0) | 22(0) | 10(0) | 0(0) | 0(0) | 0(0) | 0(0) | 37(0) |
| Anion − | 0(0) | 2(−2) | 0(0) | 0(0) | 0(0) | 0(0) | 0(0) | 2(−2) |
| Cation + | 5(0) | 22(0) | 7(−1) | 9(0) | 12(0) | 8(0) | 0(0) | 63(−1) |
| ++/+++ | 0(0) | 0(0) | 0(0) | 0(0) | 6(0) | 0(0) | 0(0) | 6(0) |
| PAHs with Oxygen | ||||||||
| All | 40(0) | 42(0) | 0(0) | 0(0) | 2(0) | 0(0) | 0(0) | 84(0) |
| Neutral | 22(0) | 21(0) | 0(0) | 0(0) | 0(0) | 0(0) | 0(0) | 43(0) |
| Anion − | 0(0) | 0(0) | 0(0) | 0(0) | 0(0) | 0(0) | 0(0) | 0(0) |
| Cation + | 18(0) | 21(0) | 0(0) | 0(0) | 2(0) | 0(0) | 0(0) | 41(0) |
| ++/+++ | 0(0) | 0(0) | 0(0) | 0(0) | 0(0) | 0(0) | 0(0) | 0(0) |
| PAHs with Magnesium or Iron | ||||||||
| All | 0(0) | 0(0) | 7(−2) | 6(0) | 12(4) | 6(0) | 0(0) | 31(2) |
| Neutral | 0(0) | 0(0) | 0(−2) | 1(0) | 2(2) | 0(0) | 0(0) | 3(0) |
| Anion − | 0(0) | 0(0) | 0(0) | 0(0) | 0(0) | 0(0) | 0(0) | 0(0) |
| Cation + | 0(0) | 0(0) | 4(0) | 5(0) | 10(2) | 6(0) | 0(0) | 25(2) |
| ++/+++ | 0(0) | 0(0) | 3(0) | 0(0) | 0(0) | 0(0) | 0(0) | 3(0) |
Note. The difference in the number of entries between versions 1.10 and 2.00 is given in parentheses (Bauschlicher et al. 2010).
Download table as: ASCIITypeset image
2.2. The Experimental PAH Database
Version 1.00 of the experimental portion of the database contained 60 experimentally measured spectra spanning 2–25 μm (5000–400 cm-1). Version 2.00 includes the addition of nine experimentally measured dibenzo-polyacene molecules, namely: dibenzo[fg,op]tetracene (C24H14), dibenzo[fg,st]pentacene (C28H16), dibenzo[hi,uv]hexacene (C32H18), dibenzo[hi,yz]heptacene (C36H20) and dibenzo[jk,a1b1]octacene (C40H22) in their singly cationic and anionic states, except for dibenzo[fg,st]pentacene, where the anion is not included due to the absence of a computed counterpart. Several of these molecules display electronic transitions in the mid-IR region and care should be taken when using these data. Some have been discussed in detail in Weisman et al. (2005), with the remaining molecules discussed in Mattioda et al. (2014). Archival data on the neutral and cation forms of dicoronylene and hexabenzocoronene A, the benz[a]anthracene cation and neutral napthalene were added as well, bringing the total number of species added to 15.
In addition to integrated band strengths, the experimental database now also contains "raw," baseline corrected, laboratory spectra for a selection of PAHs (27). It should be noted that these "raw" laboratory data may contain vibrational bands due to contaminants such as H2O, CO2, etc. Similarly, the "raw" anion and cation spectra may contain additional photo-products and electronic transitions, as mentioned above. These electronic transitions, by their nature, are significantly stronger than any of the anion and cation vibrational bands. To fully interpret the experimental data, the reader is directed to the corresponding publications regarding the vibrational analysis of the PAHs, where the photo-products and contaminates are identified, i.e., Hudgins et al. (1994, 2000); Hudgins & Allamandola (1995a, 1995b, 1997); Bauschlicher et al. (1997); Hudgins & Sandford (1998a, 1998b, 1998c); Weisman et al. (2005) and Mattioda et al. (2014).
Table 2 compares the distribution of molecules in the current version of the experimental database, broken down by size, charge, and composition, with that from 2010. This information is presented graphically in Figures 4 and 5. Figure 6 summarizes the PAH composition and charge distributions in the database in two pie-charts. Note that earlier versions of the experimental database are still accessible through the Web site.

Figure 4. Breakdown of the PAHs in the experimental database by composition and number of carbon atoms. "Pure" PAHs contain only carbon and hydrogen; nitrogen refers to PAHs containing nitrogen as well. The cross-hatched areas indicate the additions between versions 1.00 and 2.00.
Download figure:
Standard image High-resolution image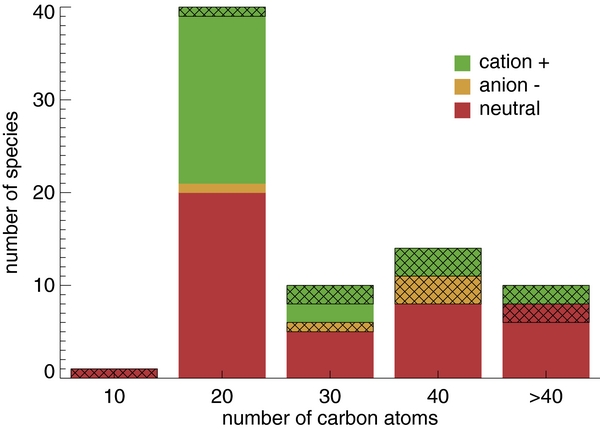
Figure 5. Breakdown of the PAHs in the experimental database by charge and number of carbon atoms. The cross-hatched areas indicate the additions between versions 1.00 and 2.00.
Download figure:
Standard image High-resolution image
Figure 6. PAH charge and composition distribution in version 2.00 of the experimental database given in percentages. Nitrogen refers to PAHs containing one or two nitrogen atoms in the hexagonal framework and "pure" refers to PAHs comprised solely of carbon and hydrogen.
Download figure:
Standard image High-resolution imageTable 2. Breakdown of the Molecules in Version 2.00 of the Experimental Database by Charge, Composition, and Size
| Number of Carbon Atoms | ||||||
|---|---|---|---|---|---|---|
| 1–10 | 11–20 | 21–30 | 31–40 | 41–50 | Total | |
| Charge | All Molecules | |||||
| All | 1(1) | 40(1) | 10(3) | 14(6) | 10(4) | 75(15) |
| Neutral | 1(1) | 20(0) | 5(0) | 8(0) | 8(2) | 42(3) |
| Anion − | 0(0) | 1(0) | 1(1) | 3(3) | 0(0) | 5(4) |
| Cation + | 0(0) | 19(1) | 4(2) | 3(3) | 2(2) | 28(8) |
| PAHs with Only Carbon and Hydrogen | ||||||
| All | 1(1) | 23(1) | 10(3) | 14(6) | 10(4) | 58(15) |
| Neutral | 1(1) | 12(0) | 5(0) | 8(0) | 8(2) | 34(3) |
| Anion − | 0(0) | 0(0) | 1(1) | 3(3) | 0(0) | 4(4) |
| Cation + | 0(0) | 11(1) | 4(2) | 3(3) | 2(2) | 20(8) |
| PAHs with Nitrogen | ||||||
| All | 0(0) | 17(0) | 0(0) | 0(0) | 0(0) | 17(0) |
| Neutral | 0(0) | 8(0) | 0(0) | 0(0) | 0(0) | 8(0) |
| Anion − | 0(0) | 1(0) | 0(0) | 0(0) | 0(0) | 1(0) |
| Cation + | 0(0) | 8(0) | 0(0) | 0(0) | 0(0) | 8(0) |
Note. The difference in the number of entries between versions 1.00 and 2.00 is given in parentheses (A. L. Mattioda et al., in preparation).
Download table as: ASCIITypeset image
3. WEB SITE AND ONLINE TOOLS
The updated computational and experimental data in the database can be downloaded in their entirety online7 as separate XML or ASCII-delimited files. Earlier versions of the data are also available. Besides providing a place from which to obtain the data, the Web site offers an intuitive and complete graphical user interface that allows one to search, view, interrogate, down-select PAH subclasses, and intercompare the contents of the database. Advanced tools allow users to work with the PAH spectra online. Among other things, the extensive help-section on the Web site also includes a downloadable manual.
Version 2.00 of the Web site has been rewritten for improved graphing, molecular structure representation, Postscript output, better mobile device compatibility and search using some common PAH names. The "Transitions" page now visualizes the vibrational motions corresponding to each fundamental mode for all PAHs in the computational database using Java-based Jmol (an open-source Java viewer for chemical structures in three dimensions8) and JSmol (an open-source HTML5 viewer for chemical structures in three dimensions9). The "raw" laboratory measured spectra can now be examined for a select number of species in the experimental database (27). Most notably, however, are the newly added emission models and the ability to import and fit astronomical spectra.
When modeling astronomical spectra, the computed PAH absorption spectra in the database must be converted to emission spectra. To do so, one must map the band shapes, natural line widths, band shifts and relative band intensities inherent to the emission process onto the absorption spectra (e.g., Rosenberg et al. 2011; Cami 2011; Ricca et al. 2012; Boersma et al. 2013). The emission parameters needed to make this conversion can now be set on the site. Besides Lorentzian profiles, Gaussian emission profiles can now be selected and the FWHM can be chosen freely as it is no longer limited to a list of presets. A redshift that accounts for the effects of anharmonicity on the emission band position can be selected. The emission models available have been extended to include two that are based on the average excitation energy. The first calculates the maximum temperature a PAH reaches after excitation and multiplies the spectrum with a blackbody at that temperature to scale relative band intensities. The second takes the entire emission cascade into account. Both of these models make use of the thermal approximation (e.g., Verstraete et al. 2001) and have been discussed in Bauschlicher et al. (2010) and Boersma et al. (2010, 2011). Note that these newly added emission models cannot be applied to the experimental data, as these do not cover a PAH's entire vibrational spectrum; needed to calculate a PAH's heat capacity.
Perhaps the most significant addition is the tool that allows users to import an astronomical spectrum and to subsequently fit that spectrum using the PAH spectra in the computational database.10 Fitting with the spectra in the experimental database is not possible as these spectra only cover a limited wavelength range and are only available for PAHs significantly smaller than those thought to dominate the interstellar PAH population. Astronomical spectra can be imported in three formats: (1) two-column (x,y)-pair ASCII, (2) VOTABLE, and (3) ISO/Spitzer-YAAR. Removal of broad band continuum and atomic and H2 emission lines and, when appropriate, corrections for extinction must be done prior to import. The imported spectrum is fitted using a non-negative least-squares fit approach (Lawson & Hanson 1974). The spectroscopic fit can be decomposed into PAH subclasses that reveal the relative contributions of PAH subpopulations to the observed emission spectrum broken down by size, charge, composition and edge structure, i.e., the contribution of small and large PAHs (small ⩽Nc = 50 < large); neutral PAHs and their corresponding cations and anions; pure PAHs versus those containing heteroatoms; and compact, symmetric PAHs versus irregularly shaped PAHs. A brief example of this analytical approach is given in Section 5. An in-depth analysis of the Spitzer-IRS maps of the northwest photon-dominated region in NGC 7023 using this method is given by Boersma et al. (2013).
Some of the new features and tools are showcased in the three screenshots reproduced in Figures 7–9. Figure 7 presents a screenshot of the "Transitions" page for C98H28. This includes the molecular structure; a list of the transitions; a stick spectrum with zoom-in options; and the visualization of one of the lowest molecular vibrations of C98H28. Figure 8 shows the updated "Tools" page with the options available for presenting the spectra (wavelength or frequency range, band profile, FWHM, absorption, emission) and the several ways to analyze the spectra. Figure 9 shows the results page for the "Spectral fitting" tool, displaying the result after importing and fitting a 5–15 μm Spitzer-IRS spectrum of the reflection nebula NGC 7023. The fitting process is discussed in Section 5.
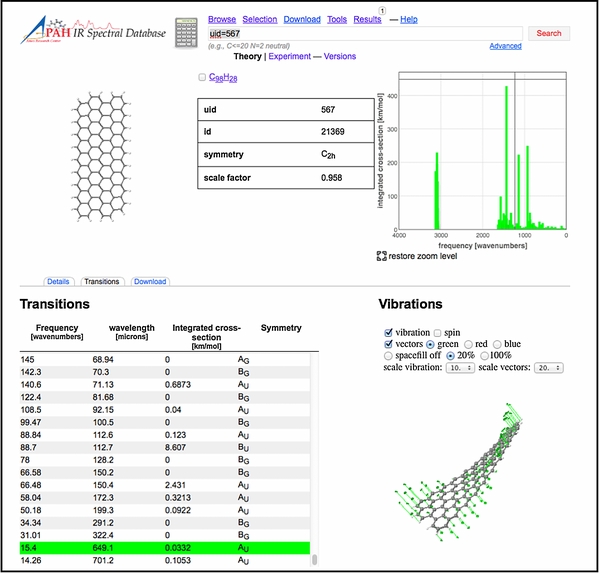
Figure 7. Screenshot of the "Transitions" page for C98H28. See Section 3 for details.
Download figure:
Standard image High-resolution image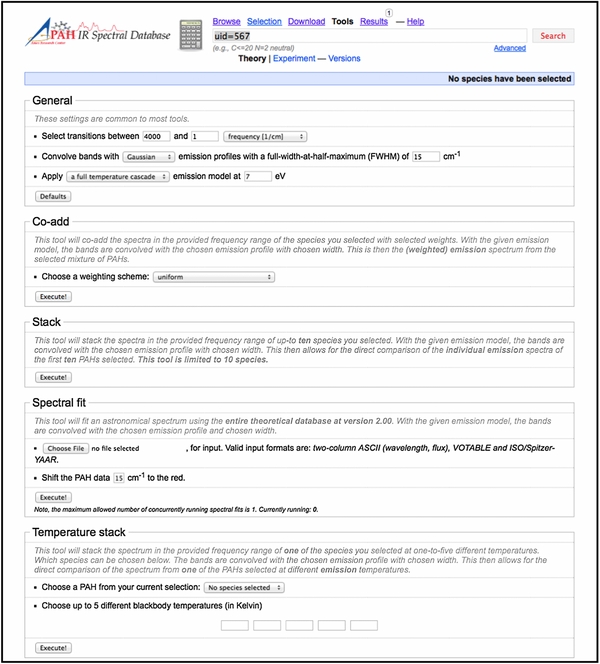
Figure 8. Screenshot of the "Tools" page showing the options available for presenting the spectra (wavelength or frequency range, band profile, FWHM, absorption, emission) and the tools for comparing, contrasting and analyzing the spectra. See Section 3 for details.
Download figure:
Standard image High-resolution image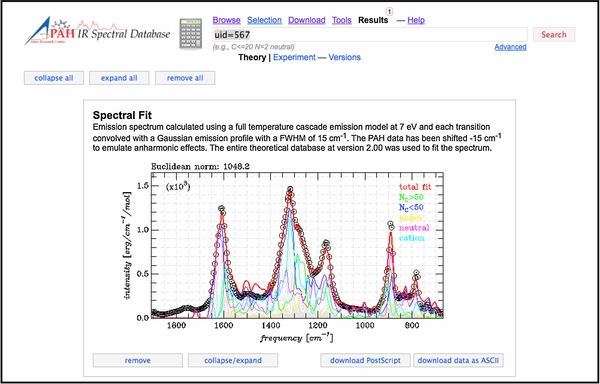
Figure 9. Screenshot of the results page displaying the result from the online "Spectral Fitting" tool after importing a 5–15 μm Spitzer-IRS spectrum of the reflection nebula NGC 7023. See Section 5 for a more detailed fitting application to the same spectrum.
Download figure:
Standard image High-resolution image4. OFFLINE TOOLS: THE AMESPAHDBIDLSUITE
The suite of IDL object classes (a collection of programs utilizing IDL's object-oriented programming capabilities), referred to as the AmesPAHdbIDLSuite and provided through the Web site, simplifies use of the database when downloaded in XML-format. A description of some of the initial tools available in the AmesPAHdbIDLSuite can be found in Paper I. However, the latest version of the suite, dated September 9, 2013, has been significantly improved and contains emission models similar to those offered online. Additionally, one can now find the average PAH excitation energy by convolving the exciting radiation field, e.g., from a star or the general interstellar medium, with the size-dependent PAH absorption cross-section from Draine & Li (2007), that includes the near-IR absorption cross sections from Mattioda et al. (2005a). Furthermore, the same non-negative least-squares fitting approach (Lawson & Hanson 1974) available online has been implemented in the suite, but allows a level of control that cannot be realized online. This is the approach used by Boersma et al. (2013) to decompose the Spitzer-IRS spectral map of the northwest photon-dominated region in NGC 7023. That work presents a listing of IDL-code illustrating the fitting of an astronomical spectrum.
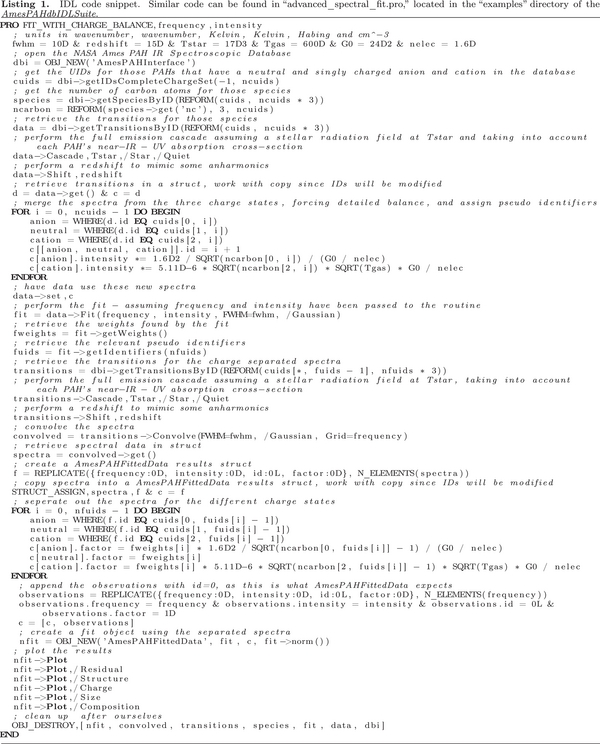
The AmesPAHdbIDLSuite can also be used to place additional constraints on the fitting approach. For example, one can require detailed charge balance. The detailed charge balance depends on the molecular properties of a given PAH, the strength of the ionizing radiation field (G0), the electron density (ne) and the temperature of the gas (Tgas; Tielens 2005). The mathematics required to impose charge balance is described in the Appendix where the derived IDL-code is presented as Listing 1. Ricca et al. (2012) use this approach to match the ISO-SWS spectrum of IRAS23133+6050 using only a coronene series of PAHs containing up to 384 carbon atoms.
The AmesPAHdbIDLSuite enables users to readily implement tools that go beyond those that are available online. For example, "advanced_spectral_fit.pro," allows one to impose detailed charge balance as described above and in the Appendix. This routine can also optimize for the detailed charge balance (see Ricca et al. 2012) and other model parameters, for example, FWHM, redshift and so on. This provides a diagnostic tool to derive these astrophysically relevant parameters. Some other examples of using and extending the AmesPAHdbIDLSuite are given in the "examples" directory of the suite. Note that backward compatibility is not guaranteed for updated releases of the AmesPAHdbIDLSuite.
5. APPLICATION TO AN ASTRONOMICAL CASE: FITTING A SPITZER-IRS SPECTRUM
Here an astronomical application is presented, made possible thanks to the newly added data and features. It is presented to illustrate some of the new scientific capabilities now possible on(off)line. It highlights some of the results from a non-negative least-squares fit (Lawson & Hanson 1974) of a 5–15 μm Spitzer-IRS spectrum of the reflection nebula NGC 7023. The spectrum, reproduced from Boersma et al. (2013) and corresponding to their position II, samples emission from the diffuse medium. The spectrum has the molecular hydrogen lines removed, a correction for extinction applied and its continuum subtracted. This spectrum is shown in Figures 9 and 10. See Boersma et al. (2013) for a detailed description of this approach and analysis.
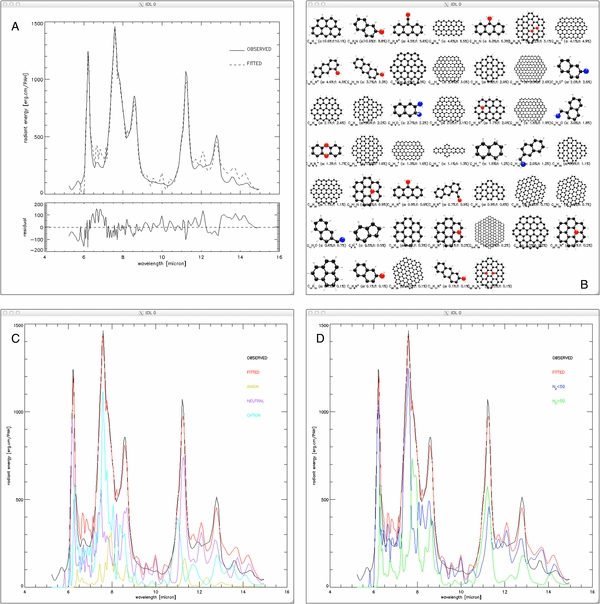
Figure 10. 5–15 μm Spitzer-IRS spectrum of position II from Boersma et al. (2013) of the reflection nebula NGC 7023 decomposed using spectra from the NASA Ames PAH IR Spectroscopic Database. (A) Observed spectrum (top panel, solid line), fit (top panel, dashed line) and the residual (bottom panel). (B) Overview of the PAH molecules comprising the fit in order of flux contribution (10.1%–0.1%). For each molecule the chemical formula, its contribution to the total number of PAHs (a:) and its contribution to the total flux are shown (f:), in percent. (C) Charge breakdown of the spectrum into contributions from PAH anions (yellow line), neutrals (purple line) and cations (cyan line). The observed spectrum is shown as the solid black line and the total fit as the red line. (D) Size breakdown of the spectrum into contributions from small (NC ⩽ 50; blue line) and large (NC > 50; green line) PAHs. The observed spectrum and total fit are shown as the solid black and red line, respectively.
Download figure:
Standard image High-resolution imageThe AmesPAHdbIDLSuite is utilized to perform this analysis offline to demonstrate the suite's versatility and breadth, but keeps consistent with the capabilities available online. This example closely follows the fit_a_spectrum.pro example code that can be found in the "examples" directory of the suite. A listing of a similar code can be found in Boersma et al. (2013). Constraints that can be applied when using the suite, but neglected here, include, for example, imposing detailed charge balance as described in the Appendix. For the fit presented here, the spectra of all species in the database have been taken into consideration, a 15 cm-1 redshift has been applied to the computational spectra to simulate anharmonic emission shifts, each transition has been convolved with a Gaussian emission profile with a 15 cm-1 FWHM, and a full temperature cascade emission model has been used, based on 7 eV photon excitation. Figure 10 presents the results of the fit.
Figures 9 and 10(A) show that the fit is quite good. Furthermore, Figure 10(B) shows that quite a variety of PAH structures are required, including those with nitrogen (red) and oxygen (blue). Figures 10(C) and (D) show the breakdown of the spectra by charge and size, respectively.
The breakdown shows that the emission comes primarily from a mixture of neutral and cationic PAHs with little anion contribution, and that PAHs smaller than 50 carbon atoms in size contribute significantly to the emission features. Overall these results are in line with expectations, i.e., one finds a low contribution from PAH anions; large neutral PAHs are important in the 10–15 μm region; and emission from PAH cations falls to the blue of that from neutral PAHs, which themselves fall to the red of that from PAH anions. The significant contribution from neutral PAHs containing less than 50 carbon atoms is perhaps somewhat unexpected, especially for the 6.2 μm PAH feature, and differs from that shown by Boersma et al. (2013) in their Figure 5. What drives this difference is the inclusion of all PAH species available in the database in the fit presented here. In Boersma et al. (2013) only PAHs with more than 20 carbon atoms were considered, and only pure PAHs and PAHs containing nitrogen. Because of their instability with respect to photodissociation in the emission region, PAHs with less than 20 carbon atoms are quickly destroyed and should be omitted from the fit. Imposing this restriction also excludes oxygen and a large fraction of nitrogen-containing PAHs (see Figure 1). The larger PAHs with nitrogen are included by Boersma et al. (2013), as to date, they are the only PAHs than can reproduce the astronomical class A, 6.2 μm PAH band.
This application shows the importance of properly considering the details of the astrophysical environment, PAH molecular physics, and how they affect the PAH population that should be used for spectroscopic fitting.
6. SUMMARY
For over twenty years, laboratory experiments and quantum chemical calculations have been carried out at NASA Ames Research Center to determine the IR spectra of PAHs in order to test and develop the astronomical PAH hypothesis. This collection of PAH spectra was assembled into a uniform spectroscopic database. This database and some tools that enable users to access and manipulate the spectra were initially made available to the public via the World Wide Web in 201011.
A significantly updated version of the database content, tools and Web site is presented. The current version of the database contains 700 computational and 75 experimental spectra compared, respectively, with 583 and 60 in their initial releases. A summary of the major upgrades follows: (1) astronomical spectra can be imported and, using a non-negative least-square approach, fit with the computed PAH spectra in the database, (2) tools have been added that allow the user to turn the PAH absorption spectra into emission spectra, (3) the number of very large PAHs in the computational database has been significantly increased, with the experimental database seeing a 25% expansion, (4) offline analysis is possible through an expanded suite of IDL object classes (a collection of programs utilizing IDL's object-oriented programming capabilities) called the AmesPAHdbIDLSuite, (5) the atomic motions corresponding to each vibrational mode can be visualized for all species in the computational database, and (6) a method to enforce detailed charge balance on the fitting procedure is described in the Appendix.
Use of the AmesPAHIDLSuite is demonstrated by a fit of the position II 5–15 μm Spitzer-IRS spectrum from Boersma et al. (2013) of the northwest photon-dominated region in the reflection nebula NGC 7023. The perhaps somewhat unexpected results stress the importance of properly considering the details of the astrophysical environment, the molecular physics of the PAH excitation/emission process and the necessity for sufficient spectral bandwidth.
Those who use the theoretical or experimental information in the NASA Ames PAH IR Spectroscopic Database and/or its on(off)line tools are asked to refer to this paper as well as Paper I, as this will justify continued site improvement and maintenance. Newly developed tools and new sets of spectra will be added to the database periodically and the version number will be updated accordingly.
An anonymous referee is thanked for carefully reading the manuscript and making very perceptive suggestions, improving the paper. This work was supported through NASA's Astrophysics Data Analysis, Astrophysics Theory and Fundamental Physics, Long Term Space Astrophysics, Laboratory Astrophysics, Astrobiology, The Spitzer Space Telescope Archival Research Programs and NASA's Laboratory Astrophysics, "Carbon in the Galaxy" consortium grant (NNH10ZDA001N). C.B. is grateful for an appointment at NASA's Ames Research Center through San José State University Research Foundation (NNX11AJ33A). A.R. thanks the NASA Astrophysics Data Analysis program (NNX11AG11G). Fernando Sánchez de Armas and Gerardo Puerta Saborido acknowledge support from the INTEGRANTS program, sponsored by the Spanish Ministry of Science and Innovation. Gerardo Puerta Saborido thanks additional financial support from the NASA Astrophysics Data Analysis Program.
APPENDIX: IMPOSING DETAILED CHARGE BALANCE
As apparent from the pie charts and histograms presented in Section 2.1, the content of the theoretical database is still far from homogeneous. For charge there is a strong bias toward the number of neutral and singly positive charged PAH species. The current implemented spectroscopic fitting techniques disregard the detailed charge balance at this point in favor of the number of species available for the fit.
The current version of the computational part of the database has 79 PAH species for which the spectra of the neutral and the singly charged anion and cation counterparts have been calculated. When one only considers neutrals and singly charged cations this number increases to 211.
However, in an astronomical environment the detailed charge balance should hold and can provide an additional constraint. First is the formation and recombination of the singly charged PAH cation:

from which the photoionization driven rate equation is derived as:

Here ne,  and
and  are the electron, neutral and singly charged PAH cation densities in cm-3, respectively. kre is the electron recombination rate and ki the photoionization rate, here in units of cm3 s-1 and s-1, respectively. The above equation can be rewritten into:
Current knowledge of PAH photoionization rates is rather limited. Tielens (2005) presents a formalism based on that developed for small grains (Bakes & Tielens 1994), that shows reasonable agreement with experiment. In this case, the photoionization rate can be written as:

where IP(Zd) is the ionization potential in eV and dependent on charge (Zd); NC is the PAH's number of carbon atoms; fy(NC) is a yield enhancement factor, which is a function of NC, and G0 is the strength of the radiation field, in units of the Habing field (1.6 × 10³ erg cm-2 s-1).
Electron recombination rates for PAHs are also rather unknown. Tielens (2005) shows a paradigm in which PAHs are initially treated as spheres. In this case the electron recombination rate can be written as:

where ϕPAH is a correction factor for departing from spherical geometry and Tgas is the gas temperature in Kelvin. Note that Tielens (2005) gives the value of Je in his Equation (6.44), where Je ≡ nekre in our notation.
Dividing Equation (A4) by (A5) and some rewriting results in:
Adopting some of the best guess values based on circumcoronene (C54H18) from Tielens (2005):

defining  , and combined with Equation (A3) results in:
Next is the formation and ionization of the singly charged PAH anion:

from which the electron attachment driven rate equation is derived as:

Here kea is the electron attachment rate and  the density of singly charged PAH anion, in units of cm3 s-1 and cm-3, respectively. A rewrite of the above equation gives:
Tielens (2005) gives for the electron attachment rate:
Dividing Equation (A12) by Equation (A4) and after some rewriting gives:
Adopting again values for circumcoronene (C54H18) from Tielens (2005):

and using x as defined above, which, when combined with Equation (A11) results in:
The total spectrum from a given PAH species, considering only the neutral and singly ionized cation and anion states, can be written as:

where the  indicates number of emitting PAH molecules, instead of density.
Dividing the left and right sides of the above equation by  yields:

where the total intensity has been normalized to the number of emitting neutral PAH molecules. Now combining:
with the results from Equations (A8) and (A15), gives:

Listing 1 below shows code utilizing the AmesPAHdbIDLSuite to force detailed charge balance as presented above. Here, this code is used to fit the 5–15 μm Spitzer-IRS spectrum of position II from Boersma et al. (2013) of the reflection nebula NGC 7023. This is the same spectrum used in the application described in Section 5. G0, ne, and Tgas are fixed at 2.4× 10³, 1.6 cm-3 and 600 K, respectively. The exciting radiation field is that of a 17,000 K B-type star. The result of the fit is shown in Figure 11. The quality of the fit is substantially less than in Figures 9 and 10, especially in the 10–15 μm region. The reason that the quality of the fit is less than that presented in Section 5 is because the database has a far smaller number of species for which spectra of PAHs in all the charge states (+,0,−) are available. Thus, the number of database spectra that can contribute to fit the astronomical spectrum is much smaller and the quality of the fits is correspondingly smaller.
Figure 11. 5–15 μm Spitzer-IRS spectrum of position II from Boersma et al. (2013) of the reflection nebula NGC 7023 fitted using spectra from the NASA Ames PAH IR Spectroscopic Database and forcing detailed charge balance. Top: observed spectrum (top panel, solid line), fit (top panel, dashed line). Bottom: the residual.
Download figure:
Standard image High-resolution imageThe methodology described here can also be used to derive G0/ne, where Tgas is fixed and G0/ne is varied simultaneously with the non-negative least-squares fit and optimized using a simplex minimization method (Nelder & Mead 1965). This approach has been implemented in "advanced_spectral_fit.pro," located in the "examples" directory of the AmesPAHdbIDLSuite (see Section 4) and an application can be found in Ricca et al. (2012).
A.1. Discussion
A few things should be kept in mind when using the approach described here. First, the adopted ionization and recombination rates. Tielens (2008) compares modeled and experimentally measured recombination rates and finds the modeled rates somewhat larger for smaller PAHs. More recently, Montillaud et al. (2013) combined experimental and theoretical data on PAH photoionization and electron recombination rates. For the latter they find a value of kre = 1.4 × 10⁻⁵ cm3 s-1 for circumcoronene at 300 K, comparable to kre = 1.3 × 10⁻⁵ cm3 s-1 used here. For photoionization Montillaud et al. (2013) use a different formalism than above and a direct comparison cannot be made. Further, it is noted that these authors use a slightly higher ionization potential for circumcoronene (6.14 versus 5.9 eV used here).
Second, large PAHs have multiple ionization states, making the formation of the doubly, or even triply charged cation, possible (see, e.g., Bakes et al. 2001a, 2001b). Figure 6.7 from Tielens (2008) shows the charge distribution for circumcoronene (NC = 54) as a function of  . With the adopted values for NGC 7023 here, γ = 3.7 × 10⁴, just around where the doubly charge cation starts to appear. Given that ionization will only increase with increasing PAH size, albeit slowly given the square-root dependence (NC; Equation (A6)), considering only three charge states may become an issue for increasingly larger PAHs. But at present, the database is considerably limited in doubly and triply charged cations, much more so than PAH anions.
Download figure:
Standard image High-resolution image
Footnotes
- 6
- 7
- 8
- 9
- 10
Performing a spectroscopic fit requires a significant amount of computer processing power, especially when combined with one of the newly added emission models. To optimize efficiency, the user should consider the number of datapoints utilized to sample the spectrum, emission model used and intention of the fit. To keep server load in check, only one fit is allowed to run at a time. Power-users and those who wish more control on the fit parameters and extracted subclass spectra, are encouraged to make use of the AmesPAHdbIDLSuite discussed in Section 4.
- 11