


ABSTRACT
We present 5–36 μm mid-infrared spectra of 82 young stars in the ∼2 Myr old Chamaeleon I star-forming region, obtained with the Spitzer Infrared Spectrograph (IRS). We have classified these objects into various evolutionary classes based on their spectral energy distributions and the spectral features seen in the IRS spectra. We have analyzed the mid-IR spectra of Class II objects in Chamaeleon I in detail, in order to study the vertical and radial structure of the protoplanetary disks surrounding these stars. We find evidence for substantial dust settling in most protoplanetary disks in Chamaeleon I. We have identified several disks with altered radial structures in Chamaeleon I, among them transitional disk candidates which have holes or gaps in their disks. Analysis of the silicate emission features in the IRS spectra of Class II objects in Cha I shows that the dust grains in these disks have undergone significant processing (grain growth and crystallization). However, disks with radial holes/gaps appear to have relatively unprocessed grains. We further find the crystalline dust content in the inner (≲1–2 AU) and the intermediate (≲10 AU) regions of the protoplanetary disks to be tightly correlated. We also investigate the effects of accretion and stellar multiplicity on the disk structure and dust properties. Finally, we compare the observed properties of protoplanetary disks in Cha I with those in slightly younger Taurus and Ophiuchus regions and discuss the effects of disk evolution in the first 1–2 Myr.
Export citation and abstract BibTeX RIS
1. INTRODUCTION
Planetary systems are formed out of protoplanetary disks surrounding young stars. Understanding the processes responsible for, and the timescales associated with, the dissipation of the disks and the formation of planetary systems is an outstanding problem in astronomy. Most solar-mass stars younger than ∼1 Myr appear to harbor disks around them; by ∼3–5 Myr most of them shed their disks (Haisch et al. 2001; Hillenbrand 2005; Hernández et al. 2008). Therefore, detailed studies of the structure and properties of the 1–2 Myr old protoplanetary disks are critically important to our understanding of the key processes governing disk evolution and planet formation.
Protoplanetary disks are natural by-products of the star formation process, which begins when a slowly rotating cloud core collapses to form a central protostar surrounded by an accretion disk and an overlying, infalling envelope. The material from the envelope "rains down" to the disk, which then gets accreted onto the central star (e.g., Shu et al. 1987; Hartmann 1998). The observed spectral energy distribution (SED) of such systems has a rising continuum in the infrared, and they have been classified as Class I sources (Lada 1987; Wilking 1989). The envelope eventually dissipates by draining onto the disk and/or is dispersed by the outflow/wind from the star–disk system, leaving behind a pre-main-sequence star surrounded by an accretion disk. SEDs of such objects show somewhat flat or decreasing continuum at infrared wavelengths and they are classified as Class II objects (Lada 1987; Wilking 1989). It is in these disks surrounding Class II objects that planetary systems form.
The planet formation process begins with the submicron-sized grains in the disks sticking together to grow to larger millimeter- and centimeter-sized particles (e.g., Weidenschilling 1980; Blum & Wurm 2008). As they grow, the larger grains sink down to the disk mid-plane; sedimentation of the dust can cause significant changes in the vertical structure of the disk (D'Alessio et al. 2006). Along with the grain growth, mineralization of the initially amorphous dust grains also take place in protoplanetary disks (e.g., Campins & Ryan 1989; Malfait et al. 1998). The larger grains that have settled to the disk mid-plane further grow into kilometer-sized planetesimals, which through collisional growth, eventually form protoplanets (e.g., Weidenschilling 2008). Once these "planetary embryos" have become sufficiently massive (∼10 M⊕), they accrete gas from the disks to form giant planets (e.g., Pollack et al. 1996). A Jupiter-like gas giant formed in the disk can gravitationally alter the disk structure by forming radial gaps and holes in them (Rice et al. 2003; Quillen et al. 2004). The disks eventually dissipate by planet formation using up the material and by various other disk dispersal processes such as accretion onto the central star, photoevaporation, and magneto-rotational instability-induced disk clearing (e.g., Clarke et al. 2001; Alexander & Armitage 2007; Chiang & Murray-Clay 2007). Pre-main-sequence stars which have dissipated most of their disk material show marginal or no excess emission above their stellar photospheres and are called Class III objects (Lada 1987; Wilking 1989).
The effects of disk evolution are best studied at mid-IR wavelengths. The mid-IR emission from a Class II object probes the planet-forming region (∼1–10 AU) of the disk surrounding it (e.g., Dullemond et al. 2007; D'Alessio et al. 2006). Dust sedimentation makes the disks flatter, i.e., reduce the degree of flaring (Dullemond & Dominik 2004; D'Alessio et al. 2006). The shape of the mid-IR continuum, in particular at wavelengths ≳13 μm, is related to the disk geometry and can be used to characterize the vertical distribution of the dust in the disks (Kenyon & Hartmann 1987; Dullemond & Dominik 2004; D'Alessio et al. 2006; Meeus et al. 2001; Furlan et al. 2006). The changes in the radial structure of the disks also affect the shape of the mid-IR continuum: transitional disk candidates—objects with radial gaps or holes within their disks—(Strom et al. 1989; Skrutskie et al. 1990; Calvet et al. 2005; Espaillat et al. 2007a, 2010; Najita et al. 2007; Brown et al. 2007) and outwardly truncated disks (McClure et al. 2008) have been identified by inspecting the mid-IR part of the SED. Additionally, the silicate emission features centered at ∼10 and ∼20 μm generated by the optically thin dust grains in the disk surface layers can be used to probe the size and composition of the dust in the disks. The grain growth and crystallization, i.e., the degree of dust processing in protoplanetary disks can be quantified using silicate emission features (e.g., Bouwman et al. 2001; van Boekel et al. 2004; Sargent et al. 2009).
As part of a large Spitzer Infrared Spectrograph (IRS13; Houck et al. 2004) survey of star-forming regions within ∼500 pc, our team has obtained mid-IR spectra of several hundred young stellar objects (YSOs) in the 1–2 Myr old, Taurus, Chamaeleon I, and Ophiuchus regions. The spectra of the young stars in Taurus and Ophiuchus have been presented in Furlan et al. (2006, 2008) and McClure et al. (2010). Here, we present and analyze the IRS spectra of young stars in the Chamaeleon I star-forming region; a smaller subset of the Class II disks classified and identified in this paper along with those in Ophiuchus and Taurus has been analyzed in Furlan et al. (2009), where a comparative study of the disk properties in these three regions is presented.
The Chamaeleon I (henceforth Cha I) cloud, which is one of the nearest star-forming regions to the Sun, at a distance of 160–165 pc (Luhman 2008), contains a relatively isolated population of young stars with modest levels of extinction toward them (Luhman 2004a). More than 200 young stars are known to be members of the Cha I star-forming region (Luhman 2008, and references therein). The young stellar population of Cha I has a median age of ∼2 Myr and an age spread of 3–6 Myr and is thus older than that of Taurus and Ophiuchus (Luhman 2008).
In this paper, we present the mid-IR spectra of 82 young stars and brown dwarfs in Cha I, obtained with the Spitzer IRS. Our sample was initially selected from the known members of Cha I based on their mid-IR flux measured by the Infrared Astronomical Satellite (IRAS) and Infrared Space Observatory (ISO) and from the members identified in the deep Hα and near-IR surveys of Cha I (Whittet et al. 1987, 1997; Persi et al. 2000; Comerón et al. 1999, 2000; Cambresy et al. 1998; Oasa et al. 1999). Objects with mid-IR flux F14.3 μm or F12 μm ⩾ 10 mJy were included in the sample. Several low-mass stars and brown dwarfs (Luhman 2004a) were also included later based on their IRAC and MIPS fluxes, which were available by then, and employing a flux cutoff F8 μm or F24 μm ⩾ 2.5 mJy (see Luhman et al. 2008). In Section 2, we describe our observations and data reduction. In Section 3, we characterize our sample and classify the objects into various evolutionary classes based on their SEDs and the IRS spectra. A detailed analysis of the IRS spectra and a comparison of the observed disk properties of the Class II objects in Cha I with those predicted by irradiated, accretion disk models are presented in Section 4. The vertical and radial structure of the disks based on the observed continuum spectral indices are discussed in Section 4.1 and the properties of the silicate emission features and dust processing in the disks are discussed in Section 4.2. In Section 5, we examine the effect of stellar multiplicity on disk structure and in Section 6 we compare the disk properties of classical and weak-line T Tauri stars (CTTS and WTTS). Finally, our main results are summarized in Section 7.
2. OBSERVATIONS AND DATA REDUCTION
We observed 92 YSOs, including very low mass stars and brown dwarfs, in the Cha I star-forming region. All the targets were observed in the IRS staring mode, in which a target was successively observed in two nod positions, at ∼1/3 and ∼2/3 of the slit length, along the spatial direction of the slit. The full mid-IR spectrum from 5 to 38 μm was obtained by using the low spectral resolution (λ/Δλ ∼ 60–120) modules of the IRS: short–low (SL; 5.3–14 μm) and long–low (LL; 14–38 μm). For a few bright targets (see Watson et al. 2009), the high spectral resolution (λ/Δλ ∼ 600) modules, short–high (SH; 10–19 μm) and long–high (LH; 19–37 μm), were used instead of LL. Each observation immediately followed a high-precision pointing peak-up with the Pointing Calibration and Reference Sensor (Mainzer et al. 2003) yielding a single axis pointing uncertainty of 0 28, that is small compared to the pixel sizes (18 in SL, 48 in LL, 23 in SH, and 51 in LH).
To extract the spectra, we started with the stray light-corrected, dark current-subtracted and flat-fielded basic calibrated data products from the Spitzer Science Center (SSC) IRS data pipeline. The non-flat-fielded, droop products were used for some targets observed using the combination of SL, SH, and LH during campaign 29 to enhance the signal to noise. The SSC IRS pipeline versions S13.2 and S14.0 were used for objects observed in campaigns 20–33, and S16.1 for campaigns 41 and 42. We first fixed the permanently bad pixels and the so-called rogue pixels (see Watson et al. 2009) flagged by the pipeline by interpolation over the neighboring good pixels along the dispersion axis (rogue pixels in SH and LH data were fixed for all campaigns; rogue pixels in LL data for campaigns 41 and 42 were fixed; rogue pixels in SL data were not fixed). We used the SMART software tool (Higdon et al. 2004) to extract and calibrate the spectra. For the low-resolution data (SL and LL), sky background was removed by subtracting the same orders of the spectra obtained at different nod positions before the point-source spectra were extracted with a variable-width column matched to the IRS point-spread function (PSF; see Sargent et al. 2006; Watson et al. 2009). For the high-resolution data (SH and LH), since the sky emission is negligible, a full slit spectral extraction was performed without sky subtraction. The extracted spectra were calibrated by multiplying them with the relative spectral response functions (RSRFs), constructed from the observed spectra of calibration standards and their template spectra (see Watson et al. 2009; Sargent et al. 2009). For each object, calibrated spectra at both the nod positions were averaged to obtain the final spectrum. Finally, the SH spectra were truncated at 14 μm and all the high-resolution spectra (SH and LH) were rebinned to the same resolution and sampling as SL and LL.
Special care was required for the spectral extraction of the following objects: Cha Hα2, Hn 10E, ISO 237, and CHXR 30A. The SL1 nod1 image of Cha Hα2 suffered from an artifact from a bright object in the peak-up array, so we used only the nod 2 for the SL spectrum. ISO 237 and CHXR 30A had problems with source contamination in the LL slit; however, careful sky subtraction, source extraction with a PSF, and scaling between modules generated a reliable version of the 5–36 μm spectrum. Hn 10E had scattered light from a nearby bright object entering in the LL1 image and we could not completely remove this contribution during the extraction, especially at λ ≳ 30 μm. We present the IRS spectrum of Hn 10E here, but do not use it in our analysis.
Of the 92 sources observed, spectral extraction failed for the following seven objects: HM8 (2M J11025504−7721508), ISO 13 (2M J11025579−7724304) (probably a galaxy, see Luhman et al. 2008), T4 (SY Cha, 2M J10563044−7711393), 2M J11070768−7626326, OTS44 (2M J11100934−7632178), 2M J11114533−7636505, and 2M J11122250−7714512. These sources were too faint and could not be located in the slit either due to mispointing or due to insufficient exposure. One of the objects, T9, turned out be a background late M giant and not a member of Cha I (Luhman 2004a). Two of the sources observed, 2M J11183572−7935548 and 2M J11432669−7804454, are probable members of  Cha association (Luhman et al. 2008). Thus in this paper, we present IRS spectra of 82 YSOs in Cha I. The log of our observations is given in Table 1.
Table 1. Log of IRS Observations of the Cha I Sample
| Object Name | 2MASS ID | R.A. | Decl. | Date of | Campaign | AOR | Module |
|---|---|---|---|---|---|---|---|
| (2000) | (2000) | Observation | No. | ID | |||
| (1) | (2) | (3) | (4) | (5) | (6) | (7) | (8) |
| SX Cha | J10555973−7724399 | 10 55 59.73 | −77 24 39.90 | 2005 May 26 | 21 | 12697345 | SLSHLH |
| T5 | J10574219−7659356 | 10 57 42.20 | −76 56 35.70 | 2005 Jul 13 | 22 | 12696320 | SLLL |
| ... | J10580597−7711501 | 10 58 5.98 | −77 11 50.10 | 2007 Jun 26 | 41 | 21914368 | SLLL |
| SZ Cha | J10581677−7717170 | 10 58 16.77 | −77 17 17.10 | 2005 Jul 12 | 22 | 12696832 | SLLL |
| TW Cha | J10590108−7722407 | 10 59 1.09 | −77 22 40.70 | 2005 Jul 10 | 22 | 12696576 | SLLL |
| CR Cha | J10590699−7701404 | 10 59 6.99 | −77 1 40.40 | 2005 May 26 | 21 | 12697345 | SLSHLH |
| ... | J11011926−7732383 | 11 1 19.22 | −77 32 38.60 | 2007 Jun 18 | 41 | 21920512 | SLLL |
| CS Cha | J11022491−7733357 | 11 2 24.91 | −77 33 35.70 | 2005 Jul 11 | 22 | 12695808 | SLLL |
| CT Cha | J11040909−7627193 | 11 4 9.09 | −76 27 19.40 | 2005 May 26 | 21 | 12697345 | SLSHLH |
| T14a | J11042275−7718080 | 11 4 22.76 | −77 18 8.10 | 2005 Jul 11 | 22 | 12695808 | SLLL |
| ISO 52 | J11044258−7741571 | 11 4 42.58 | −77 41 57.10 | 2005 Jul 12 | 22 | 12691200 | SLLL |
| T21 | J11061540−7721567 | 11 6 15.41 | −77 21 56.80 | 2005 Jul 13 | 22 | 12696320 | SLLL |
| ... | J11062942−7724586 | 11 6 29.43 | −77 24 58.60 | 2006 Aug 2 | 33 | 18360832 | SLLL |
| CHSM 7869 | J11063276−7625210 | 11 6 32.77 | −76 25 21.10 | 2007 Jun 26 | 41 | 21913600 | SLLL |
| ISO 79 | J11063945−7736052 | 11 6 39.45 | −77 36 5.20 | 2005 Jul 11 | 22 | 12690176 | SLLL |
| Hn 5 | J11064180−7635489 | 11 6 41.81 | −76 35 49.00 | 2005 Jul 13 | 22 | 12696320 | SLLL |
| UX Cha | J11064346−7726343 | 11 6 43.47 | −77 26 34.40 | 2005 Jul 13 | 22 | 12696064 | SLLL |
| CHXR 20 | J11064510−7727023 | 11 6 45.10 | −77 27 2.30 | 2005 Jul 12 | 22 | 12695296 | SLLL |
| Ced110 IRS4 | J11064658−7722325 | 11 6 46.58 | −77 22 32.60 | 2005 Apr 17 | 20 | 12692224 | SLLL |
| ISO 86 | J11065803−7722488 | 11 6 58.03 | −77 22 48.90 | 2005 Apr 17 | 20 | 12692224 | SLLL |
| UY Cha | J11065906−7718535 | 11 6 59.07 | −77 18 53.60 | 2005 Apr 17 | 20 | 12692224 | SLLL |
| ... | J11065939−7530559 | 11 6 59.40 | −75 30 56.00 | 2007 Jun 15 | 41 | 21915136 | SLLL |
| ... | J11070369−7724307 | 11 7 3.69 | −77 24 30.70 | 2006 Aug 2 | 33 | 18360576 | SLLL |
| Ced110 IRS6 | J11070919−7723049 | 11 7 9.20 | −77 23 5.00 | 2005 Jul 12 | 22 | 12696832 | SLLL |
| ISO 91 | J11070925−7718471 | 11 7 9.25 | −77 18 47.10 | 2005 Apr 24 | 20 | 12691712 | SLLL |
| UZ Cha | J11071206−7632232 | 11 7 12.07 | −76 32 23.20 | 2005 Jul 13 | 22 | 12696320 | SLLL |
| CHXR 22E | J11071330−7743498 | 11 7 13.33 | −77 43 49.80 | 2006 Jul 3 | 32 | 18361344 | SLLL |
| Cha Hα1 | J11071668−7735532 | 11 7 16.69 | −77 35 53.30 | 2005 Jul 13 | 22 | 12689920 | SLLL |
| T25 | J11071915−7603048 | 11 7 19.15 | −76 3 4.80 | 2005 Apr 24 | 20 | 12695552 | SLLL |
| DI Cha | J11072074−7738073 | 11 7 20.74 | −77 38 7.40 | 2005 May 26 | 21 | 12697345 | SLSHLH |
| B35 | J11072142−7722117 | 11 7 21.43 | −77 22 11.80 | 2005 Jul 13 | 22 | 12696320 | SLLL |
| VV Cha | J11072825−7652118 | 11 7 28.26 | −76 52 11.90 | 2005 Jul 13 | 22 | 12696064 | SLLL |
| Cha Hα2 | J11074245−7733593 | 11 7 42.45 | −77 33 59.40 | 2005 Jul 12 | 22 | 12690688 | SLLL |
| T28 | J11074366−7739411 | 11 7 43.66 | −77 39 41.10 | 2005 Jul 12 | 22 | 12696832 | SLLL |
| CHSM 10862 | J11074656−7615174 | 11 7 46.56 | −76 15 17.50 | 2007 Jun 15 | 41 | 21913856 | SLLL |
| CHXR 30B | J11075730−7717262 | 11 7 57.31 | −77 17 26.20 | 2005 Jul 10 | 22 | 12696576 | SLLL |
| T29 | J11075792−7738449 | 11 7 57.93 | −77 38 44.90 | 2005 May 26 | 21 | 12697345 | SLSHLH |
| CHXR 30A | J11080002−7717304 | 11 8 0.02 | −77 17 30.50 | 2005 May 30 | 21 | 12692481 | SLLL |
| VW Cha | J11080148−7742288 | 11 8 1.49 | −77 42 28.80 | 2005 Jul 12 | 22 | 12696832 | SLLL |
| ISO 126 | J11080297−7738425 | 11 8 2.98 | −77 38 42.60 | 2005 May 26 | 21 | 12697345 | SLSHLH |
| CU Cha | J11080329−7739174 | 11 8 3.30 | −77 39 17.40 | 2006 Mar 7 | 29 | 12697088 | SLSHLH |
| T33A | J11081509−7733531 | 11 8 15.10 | −77 33 53.20 | 2006 Mar 7 | 29 | 12697088 | SLSHLH |
| ISO 138 | J11081850−7730408 | 11 8 18.50 | −77 30 40.80 | 2005 Jul 12 | 22 | 12690432 | SLLL |
| ISO 143 | J11082238−7730277 | 11 8 22.38 | −77 30 27.70 | 2005 Jul 12 | 22 | 12690432 | SLLL |
| Cha IRN | J11083896−7743513 | 11 8 38.20 | −77 43 51.80 | 2005 May 26 | 21 | 12697345 | SLSHLH |
| T35 | J11083905−7716042 | 11 8 39.05 | −77 16 4.20 | 2005 Jul 13 | 22 | 12696320 | SLLL |
| VY Cha | J11085464−7702129 | 11 8 54.64 | −77 2 13.00 | 2005 May 26 | 21 | 12691969 | SLLL |
| C1-6 | J11092266−7634320 | 11 9 22.67 | −76 34 32.00 | 2005 May 26 | 21 | 12697345 | SLSHLH |
| VZ Cha | J11092379−7623207 | 11 9 23.79 | −76 23 20.80 | 2005 Jul 12 | 22 | 12696832 | SLLL |
| ISO 192 | J11092855−7633281 | 11 9 28.55 | −76 33 28.10 | 2006 Mar 7 | 29 | 12697088 | SLSHLH |
| C1-25 | J11094192−7634584 | 11 9 41.93 | −76 34 58.40 | 2005 Jul 12 | 22 | 12696832 | SLLL |
| C7-1 | J11094260−7725578 | 11 9 42.60 | −77 25 57.90 | 2005 Jul 12 | 22 | 12686336 | SLLL |
| Hn 10E | J11094621−7634463 | 11 9 46.21 | −76 34 46.40 | 2005 Jul 13 | 22 | 12696320 | SLLL |
| B43 | J11094742−7726290 | 11 9 47.42 | −77 26 29.10 | 2005 Apr 17 | 20 | 12691456 | SLLL |
| HD 97300 | J11095003−7636476 | 11 9 50.03 | −76 36 47.70 | 2006 Mar 7 | 29 | 12697088 | SLSHLH |
| ISO 220 | J11095336−7728365 | 11 9 53.37 | −77 28 36.60 | 2006 Mar 7 | 29 | 12686080 | SLLL |
| T42 | J11095340−7634255 | 11 9 53.41 | −76 34 25.50 | 2006 Mar 7 | 29 | 12697088 | SLSHLH |
| T43 | J11095407−7629253 | 11 9 54.08 | −76 29 25.30 | 2005 Apr 17 | 20 | 12692224 | SLLL |
| ISO 225 | J11095437−7631113 | 11 9 54.38 | −76 31 11.40 | 2005 Jul 12 | 22 | 12690432 | SLLL |
| C1-2 | J11095505−7632409 | 11 9 55.06 | −76 32 41.00 | 2005 Jul 12 | 22 | 12696832 | SLLL |
| WX Cha | J11095873−7737088 | 11 9 58.74 | −77 37 8.90 | 2005 Jul 10 | 22 | 12696576 | SLLL |
| WW Cha | J11100010−7634578 | 11 10 0.11 | −76 34 57.90 | 2006 Mar 7 | 29 | 12697088 | SLSHLH |
| Hn 11 | J11100369−7633291 | 11 10 3.69 | −76 33 29.20 | 2005 Jul 13 | 22 | 12696064 | SLLL |
| T45a | J11100469−7635452 | 11 10 4.69 | −76 35 45.30 | 2005 May 26 | 21 | 12691969 | SLLL |
| WY Cha | J11100704−7629376 | 11 10 7.04 | −76 29 37.70 | 2005 Jul 13 | 22 | 12696064 | SLLL |
| ISO 235 | J11100785−7727480 | 11 10 7.85 | −77 27 48.10 | 2005 Jul 12 | 22 | 12690432 | SLLL |
| ISO 237 | J11101141−7635292 | 11 10 11.42 | −76 35 29.30 | 2005 Jul 10 | 22 | 12696576 | SLLL |
| CHXR 47 | J11103801−7732399 | 11 10 38.02 | −77 32 39.90 | 2005 Jul 13 | 22 | 12696064 | SLLL |
| ISO 252 | J11104141−7720480 | 11 10 41.41 | −77 20 48.00 | 2005 Jul 9 | 22 | 12685825 | SLLL |
| T47 | J11104959−7717517 | 11 10 49.60 | −77 17 51.70 | 2005 Jul 10 | 22 | 12696576 | SLLL |
| WZ Cha | J11105333−7634319 | 11 10 53.34 | −76 34 32.00 | 2005 Apr 17 | 20 | 12692224 | SLLL |
| ISO 256 | J11105359−7725004 | 11 10 53.59 | −77 25 0.50 | 2005 May 26 | 21 | 12691969 | SLLL |
| Hn 13 | J11105597−7645325 | 11 10 55.97 | −76 45 32.60 | 2005 Jul 12 | 22 | 12690688 | SLLL |
| XX Cha | J11113965−7620152 | 11 11 39.66 | −76 20 15.20 | 2005 Jul 10 | 22 | 12696576 | SLLL |
| ISO 282 | J11120351−7726009 | 11 12 3.51 | −77 26 1.00 | 2005 Jul 13 | 22 | 12686848 | SLLL |
| T50 | J11120984−7634366 | 11 12 9.85 | −76 34 36.50 | 2005 Jul 13 | 22 | 12696064 | SLLL |
| T51 | J11122441−7637064 | 11 12 24.41 | −76 37 6.40 | 2005 Jul 10 | 22 | 12696576 | SLLL |
| CV Cha | J11122772−7644223 | 11 12 27.72 | −76 44 22.30 | 2006 Mar 7 | 29 | 12697088 | SLSHLH |
| T54 | J11124268−7722230 | 11 12 42.69 | −77 22 23.00 | 2005 Apr 24 | 20 | 12695552 | SLLL |
| Hn 21W | J11142454−7733062 | 11 14 24.54 | −77 33 6.20 | 2007 Jun 16 | 41 | 21914112 | SLLL |
| T56 | J11173700−7704381 | 11 17 37.01 | −77 4 38.10 | 2005 Jul 13 | 21 | 12696064 | SLLL |
| ... | J11183572−7935548 | 11 18 35.73 | −79 35 54.90 | 2007 Jun 10 | 41 | 21915392 | SLLL |
| ... | J11241186−7630425 | 11 24 11.87 | −76 30 42.60 | 2007 Aug 2 | 42 | 21914624 | SLLL |
| ... | J11432669−7804454 | 11 43 26.70 | −78 4 45.50 | 2007 Jun 17 | 41 | 21914880 | SLLL |
Notes. Columns 1 and 2 list the object names and their 2MASS identifiers. Observed coordinates are listed in Columns 3 and 4 and the date of observations in Column 5. The Spitzer IRS observing campaigns during which the objects were observed are listed in Column 6 and the corresponding Astronomical Observation Requests (AORs) in Column 7. Column 8 lists the IRS modules used in the observations.
3. CHARACTERIZATION OF THE SAMPLE
The basic data for the Cha I sample are presented in Table 2. We have spectral type information for 74 stars out of 82 Cha I members. Most of them (≳90%) are of spectral type K0 or later. Of the seven early-type stars in the sample, two are B type and five are G type. Figure 1 shows the spectral type distribution of stars in the sample which are K0 or later. The spectral type distribution of our sample peaks at M5/M6 and is quite similar to the distribution of the more complete sample of the known members of Cha I (Luhman 2008); our sample is representative of the young stellar population of the Cha I cloud. A significant fraction of the objects in our sample with IRS spectra are very low mass stars or brown dwarfs: 19 of them have spectral types M5 or later, of which 7 are likely to be brown dwarfs (M6 or later).
Figure 1. Spectral type distribution of the Cha I sample for stars with spectral types later than K0.
Download figure:
Standard image High-resolution imageTable 2. Basic Data for the Cha I Sample
| Object Name | Sp. Type | AJ | n2–25 | n2–25 | SED Class | n5–12 | W(Hα) | C/W |
|---|---|---|---|---|---|---|---|---|
| (mag) | (observed) | (dereddened) | (Å) | |||||
| (1) | (2) | (3) | (4) | (5) | (6) | (7) | (8) | (9) |
| SX Cha | M0 | 0.7 | −0.61 | −0.59 | II | −0.71 | 31.7 | C |
| T5 | M3.25 | 0.3 | −1.02 | −1.02 | II | −0.87 | 22.0 | C |
| 2M J10580597−7711501 | M5.25 | 0.4 | −0.94 | −0.93 | II | −1.18 | ... | ... |
| SZ Cha | K0 | 0.4 | −0.59 | −0.58 | II/T | −1.20 | 7.0 | C |
| TW Cha | K8 | 0.3 | −1.00 | −1.00 | II | −1.35 | 34.5 | C |
| CR Cha | K2 | 0.0 | −0.82 | −0.82 | II | −0.62 | 38.5 | C |
| 2M J11011926−7732383 | M7.25 | 0.4 | −2.38 | −2.37 | III | −2.70 | 25.0 | W |
| CS Cha | K6 | 0.0 | −0.64 | −0.63 | II/T | −1.52 | 20.0 | C |
| CT Cha | K5 | 0.4 | −0.64 | −0.63 | II | −0.50 | 34.5 | C |
| T14a | K7 | 0.4 | 0.50 | 0.51 | I | 0.52 | 159.0 | C |
| ISO 52 | M4 | 0.3 | −0.81 | −0.81 | II | −0.47 | 6.4 | W |
| T21 | G5 | 0.9 | −2.53 | −2.50 | III | −2.65 | ... | ... |
| 2M J11062942−7724586 | M6 | 5.6 | −1.36 | −1.06 | II | −1.29 | ... | ... |
| CHSM 7869 | M6 | 0.4 | −1.09 | −1.08 | II | −1.13 | 120.0 | C |
| ISO 79 | M5.25 | 0.7 | −0.70 | −0.69 | II | −0.76 | 8.0 | W |
| Hn 5 | M4.5 | 0.3 | −0.83 | −0.82 | II | −0.72 | 48.0 | C |
| UX Cha | M3 | 0.9 | −2.62 | −2.54 | III | −2.56 | 3.0 | W |
| CHXR 20 | K6 | 1.0 | −1.30 | −1.27 | II | −0.81 | 1.8 | W |
| Ced110 IRS4 | ... | ... | 1.61 | ... | I | 0.31 | ... | ... |
| ISO 86 | ... | ... | 0.91 | ... | I | −0.95 | ... | ... |
| UY Cha | M4.25 | 0.0 | −1.00 | −1.00 | II | −0.52 | 8.5 | W |
| 2M J11065939−7530559 | M5.25 | 0.1 | −1.00 | −0.99 | II | −1.23 | 51.0 | C |
| 2M J11070369−7724307 | M7.5 | 4.6 | −0.94 | −0.70 | II | −0.75 | ... | ... |
| Ced110 IRS6 | ... | ... | 0.70 | ... | I | −0.81 | ... | ... |
| ISO 91 | M3 | 4.5 | −1.15 | −0.91 | II | −0.53 | ... | ... |
| UZ Cha | M0.5 | 0.6 | −1.04 | −1.03 | II | −1.02 | 9.7 | W |
| CHXR 22E | M3.5 | 1.3 | −1.79 | −1.74 | II/T | −2.62 | 4.5 | W |
| Cha Hα1 | M7.75 | 0.0 | −0.52 | −0.52 | II | −0.18 | 112.0 | C |
| T25 | M2.5 | 0.4 | −0.81 | −0.80 | II/T | −1.97 | 5.0 | W |
| DI Cha | G2 | 0.7 | −0.99 | −0.98 | II | −1.12 | 18.3 | C |
| B35 | ... | ... | −0.02 | ... | FS | −0.02 | ... | ... |
| VV Cha | M3 | 0.1 | −0.94 | −0.94 | II | −0.40 | 72.0 | C |
| Cha Hα2 | M5.25 | 1.0 | −1.28 | −1.24 | II | −1.07 | 60.0 | C |
| T28 | M0 | 1.3 | −1.11 | −1.07 | II | −1.01 | 78.0 | C |
| CHSM 10862 | M5.75 | 0.4 | −0.84 | −0.83 | II | −0.90 | 18.0 | W |
| CHXR 30B | M1.25 | 3.1 | −0.96 | −0.79 | II | −1.42 | 80.0 | C |
| T29 | K6 | 1.2 | −0.50 | −0.47 | II | −0.36 | 61.5 | C |
| CHXR 30A | K8 | 2.9 | −1.75 | −1.59 | II | −1.58 | 1.0 | W |
| VW Cha | K8 | 0.7 | −0.89 | −0.87 | II | −1.02 | 64.0 | C |
| ISO 126 | M1.25 | 1.3 | −0.13 | −0.09 | FS | −0.49 | 120.0 | C |
| CU Cha | B9.5 | 0.7 | −0.14 | −0.13 | II | −0.03 | ... | ... |
| T33A | G7 | 0.8 | ... | ... | II | −0.47 | 0.9 | W |
| ISO 138 | M6.5 | 0.0 | −1.00 | −1.00 | II | −0.75 | 19.0 | W |
| ISO 143 | M5 | 1.1 | −1.16 | −1.12 | II | −0.85 | 118.0 | C |
| Cha IRN | ... | ... | 1.24 | ... | I | 1.46 | ... | ... |
| T35 | K8 | 1.3 | −1.23 | −1.19 | II/T | −2.48 | 100.0 | C |
| VY Cha | M0.5 | 0.9 | −0.91 | −0.88 | II | −1.18 | 55.0 | C |
| C1-6 | M1.25 | 3.2 | −0.64 | −0.46 | II | −0.50 | 110.0 | C |
| VZ Cha | K6 | 0.5 | −1.07 | −1.06 | II | −0.94 | 41.3 | C |
| ISO 192 | ... | ... | 1.24 | ... | I | 1.49 | ... | ... |
| C1-25 | ... | ... | −0.26 | ... | FS | −0.11 | ... | ... |
| C7-1 | M5 | 1.9 | −1.59 | −1.53 | II | −1.78 | 60.0 | C |
| Hn 10E | M3.25 | 1.0 | −0.44 | −0.41 | II | −0.14 | 68.0 | C |
| B43 | M3.25 | 2.2 | −0.97 | −0.90 | II | −1.08 | 200.0 | C |
| HD 97300 | B9 | 0.7 | −1.32 | −1.31 | II | 0.17 | ... | ... |
| ISO 220 | M5.75 | 1.7 | −1.23 | −1.18 | II | −0.94 | 150.0 | C |
| T42 | K5 | 1.4 | −0.39 | −0.34 | II | −0.38 | 205.0 | C |
| T43 | M2 | 1.4 | −0.94 | −0.89 | II | −0.92 | 43.0 | C |
| ISO 225 | M1.75 | 1.2 | 0.10 | 0.14 | FS | 0.00 | 12.7 | C |
| C1-2 | ... | ... | 0.10 | ... | FS | −0.43 | 45.0 | ... |
| WX Cha | M1.25 | 0.5 | −1.06 | −1.05 | II | −1.16 | 63.0 | C |
| WW Cha | K5 | 1.3 | −0.46 | −0.42 | II | −0.78 | 61.0 | C |
| WY Cha | M0 | 1.1 | −1.18 | −1.15 | II | −0.83 | 51.0 | C |
| Hn 11 | K8 | 2.1 | −0.84 | −0.77 | II | −0.58 | 19.0 | C |
| T45a | M1 | 0.5 | −1.00 | −1.00 | II | −0.93 | 7.5 | W |
| ISO 235 | M5.5 | 2.4 | −1.31 | −1.24 | II | −0.71 | 18.0 | W |
| ISO 237 | K5.5 | 1.9 | −0.78 | −0.72 | II | −0.88 | 3.8 | C |
| CHXR 47 | K3 | 1.4 | −1.24 | −1.20 | II | −1.05 | 1.0 | W |
| ISO 252 | M6 | 0.9 | −1.01 | −0.98 | II | −0.71 | 320.0 | C |
| T47 | M2 | 1.1 | −0.63 | −0.60 | II | −0.19 | 89.5 | C |
| WZ Cha | M3.75 | 0.1 | −0.79 | −0.79 | II | −0.53 | 279.0 | C |
| ISO 256 | M4.5 | 2.5 | −0.75 | −0.67 | II | −0.57 | 55.0 | C |
| Hn 13 | M5.75 | 0.2 | −1.02 | −1.02 | II | −1.08 | 22.5 | C |
| XX Cha | M2 | 0.3 | −0.90 | −0.89 | II | −0.90 | 90.0 | C |
| ISO 282 | M4.75 | 1.0 | −1.13 | −1.10 | II | −1.51 | 50.0 | C |
| T50 | M5 | 0.1 | −1.08 | −1.08 | II | −1.01 | 19.5 | W |
| T51 | K3.5 | 0.0 | −1.08 | −1.08 | II | −1.04 | 2.5 | W |
| CV Cha | G9 | 0.4 | −0.78 | −0.77 | II | −0.79 | 62.5 | C |
| T54 | G8 | 0.6 | −1.68 | −1.67 | II/T | −2.32 | ... | ... |
| Hn 21W | M4 | 0.7 | −1.34 | −1.33 | II | −1.26 | 68.0 | C |
| T56 | M0.5 | 0.1 | −0.93 | −0.93 | II/T | −1.22 | 56.0 | C |
| 2M J11183572−7935548 | M4.75 | 0.0 | −0.66 | −0.66 | II/T | −0.67 | 11.0 | W |
| 2M J11241186−7630425 | M5 | 0.7 | −0.91 | −0.89 | II/T | −1.13 | 30.0 | C |
| 2M J11432669−7804454 | M5 | 0.2 | −1.48 | −1.47 | II | −1.77 | 75.0 | C |
Notes. Spectral types and extinction values (AJ) listed in Columns 2 and 3 are from Luhman (2007, 2008). "T" in Column 5 denotes transitional disk candidates (see Section 3.2). Column 6 lists Hα equivalent widths compiled from the literature (Luhman 2004a; Herbig & Bell 1988; Comerón et al. 1999; Walter 1992; Covino et al. 1997; Feigelson & Kriss 1989; Guenther et al. 2007). Positive values indicate Hα in emission.
We classified our sample objects into CTTS and WTTS based on their observed equivalent width of Hα emission (WHα) compiled from the literature (see Table 2). We followed the empirical criteria prescribed by White & Basri (2003) which is based on WHα, but also accounts for the spectral type dependence of the "contrast effect" which affects the observed WHα. The WHα values used and the CTTS/WTTS (C/W) classification of our sample are listed in Table 2.
In Table 3, we list the observed properties of the companions of the Cha I sources which are known to be in multiple systems. We only list the stellar companions whose membership to the Cha I cloud has been established. For instance, SZ Cha is reported to have two candidate companions, B (2M J10581804−7717197) and C (2M J10581413−7717088) separated from the primary by 52 and 125, respectively (Ghez et al. 1997; Lafrenière et al. 2008). However, these candidates have not been confirmed as members of Cha I association (Luhman 2007, 2008). Similarly, T51 is reported to have a third component T51C (2M J11122740−7637017) separated by 124 from the primary (Ghez et al. 1997), which is not a confirmed member of Cha I association (Luhman 2007, 2008). We do not include them in the table. Most of the multiple systems in our sample have companions at separations ≲3''. As the narrowest IRS slit width is 36 (SL), the IRS spectra presented here for these objects are the composite spectra of the unresolved components. We take this into account while interpreting the spectra of these objects. However, for most of these close binaries, one of the components is brighter and dominates the mid-IR spectrum.
Table 3. Objects in Multiple Systems
| Separation | Brightness | ||||
|---|---|---|---|---|---|
| Name | N | ('') | Spectral Type | Comparison | References |
| (1) | (2) | (3) | (4) | (5) | (6) |
| SX Cha (A, B) | 2 | 2.2 | M0+M3.5 | A>B | 1, 2 |
| T5 (A, B) | 2 | 0.16 | M3.25 | A∼B | 2 |
| 2M J11011926−7732383 (A, B) | 2 | 1.4 | M7.25+M8.25 | A>B | 3 |
| CS Cha (A, B) | 2 | SB | K6 | A>B | 4 |
| T14a (A, B) | 2 | 2.35 | K7 | A>B | 5 |
| T21 (A, B) | 2 | 0.14 | G5 | A>>B | 2 |
| CHXR 20 + UX Cha | 2 | 28.46 | K6+M3 | CHXR20>UX Cha | 6 |
| Ced110 IRS6 (A, B) | 2 | 1.95 | ClassI | A>B | 5, 7 |
| DI Cha (A, Ba, Bb) | 3 | 4.68(A, Ba+Bb), 0.07(Ba, Bb) | G2(A), M4.25(Ba+Bb) | A>>Ba+Bb, Ba∼Bb | 1, 8, 2 |
| VV Cha (A, B) | 2 | 0.8 | M3 | A>B | 1, 2 |
| Cha Ha2 (A, B) | 2 | 0.17 | M5.25 | A∼B | 9, 2 |
| T28 (A, B) | 2 | 28.87 | M0+M5.75 | A>>B | 6 |
| T29 + ISO 126 (A, B) | 3 | 17.6, 0.29(ISO 126 A, B) | K6+M1.25 | T29>ISO 126A>ISO 126B | 8 |
| CHXR 30 (Aa, Ab, B) | 3 | 0.46(Aa, Ab), 9.93(A, B) | K8(Aa+Ab)+M1.25(B) | Aa>B,Aa>>Ab | 6, 2 |
| VW Cha (A,Ba,Bb,C,D) | 4 | 0.66(A,Ba), 0.7(A,Bb), 0.1(Ba,Bb), 2.7(A,C), 16.9(A,D) | K8(A+B), K7(Ba+Bb), M2.5(D) | A>B,Ba>Bb,A>C,A>>D | 1, 8, 10, 11, 12, 2 |
| T33 (A,B) | 2 | 2.48 | G7+K6 | A>B | 10, 11, 5, 2 |
| ISO 143 + ISO 138 | 2 | 18.16 | M5+M6.5 | ISO 143>ISO 138 | 6 |
| Hn 10E + C1-25 | 2 | 19.17 | M3.5 | Hn 10E∼C1-25 | 6, 13 |
| HD 97300 (A,B) | 2 | 0.82 | B9 | A>>B | 8, 2 |
| T43 (A,B) | 2 | 0.8 | M2 | A>B | 2 |
| WX Cha (A,B) | 2 | 0.78 | M1.25 | A>>B | 8, 2 |
| WY Cha (A,B) | 2 | 0.12 | M0 | A>B | 2 |
| ISO 237 + T45a | 2 | 28.32 | K5.5+M1 | ISO 237>T45a | 6 |
| CHXR 47 (A,B)a | 2 | 1.2(2),0.18(13) | K3 | A∼B(2),A>B(13) | 8, 2 |
| T47 (A,B) | 2 | 12.09 | M2+M4.5 | A>B | 6 |
| Hn 13 (A,B) | 2 | 0.13 | M5.75 | A∼B | 9, 2 |
| XX Cha (B,A) | 2 | 24.38 | M2+K6 | B<A | 6 |
| T51 (A,B) | 3 | 1.85 | K3.5 | A>>B | 1, 8, 2 |
| CV Cha + CW Cha | 2 | 11.55 | G9+M1 | CV Cha>>CW Cha | 1, 8 |
| T54 (A,B) | 2 | 0.26 | G8 | A>>B | 8, 2 |
| Hn 21 (W,E) | 2 | 5.52 | M4+M5.75 | W>E | 10, 6, 2 |
Notes. When the companion(s) have common names, we list those names in Column 1. When there are more than one measurement for the separations between components, and if they are consistent, we have listed the mean value in Column 3 and cited all the references. The spectral types of the primary and of the other components listed in Column 4 are from Luhman (2007), except for VW Cha and 2M J11011926−7732383, for which they are from the corresponding references listed. The relative brightness of the components listed in Column 6 is based on the K-band flux. aThe separation and the position angle of the CHXR 47 binary system reported by Ghez et al. (1997) and Lafrenière et al. (2008) are very different. We have separately listed the binary separation and flux ratio from both the authors with the references in parentheses. References. (1) Reipurth & Zinnecker 1993; (2) Lafrenière et al. 2008; (3) Luhman 2004b; (4) Guenther et al. 2007; (5) Haisch et al. 2004; (6) Kraus & Hillenbrand 2007; (7) Persi et al. 2001; (8) Ghez et al. 1997; (9) Ahmic et al. 2007; (10) Brandner et al. 1996; (11) Brandeker et al. 2001; (12) Brandner & Zinnecker 1997; (13) Hartigan 1993.
Download table as: ASCIITypeset image
We compiled the photometric data for our sample from the literature. For all objects we used the J, H, and Ks measurements from the point-source catalog of the Two Micron All Sky Survey (2MASS; Skrutskie et al. 2006; Cutri et al. 2003). The I-band data were obtained from the Third Release of the DEep Near-Infrared Survey of the southern sky (DENIS; Epchtein et al. 1999) except for two for which there were no DENIS observations. When available, we also compiled the IRAC 3.6, 4.5. 5.8, and 8.0 μm and MIPS 24 μm flux measurements for the objects in our sample from Luhman et al. (2008).
Two mid-M type stars in Table 2, 2M J11183572−7935548 and 2M J11432669−7804454, are more likely members of the Cha moving group as suggested by their proper motions (see Luhman et al. 2008; Luhman 2008). Cha is older (∼6 Myr) and closer to us (d ⋍ 114 pc) than Cha I and its members exhibit larger proper motions than those of Cha I (Luhman et al. 2008; Mamajek et al. 2000; Frink et al. 1998).
3.1. Extinction Correction
Figure 2 shows the distribution of extinction values (AJ) (see Table 2) of our sample objects in Cha I. More than half of the stars have AJ > 0.8 mag. The wavelength-dependent extinction law toward molecular clouds is known to diverge from that for the diffuse interstellar medium (ISM; Mathis 1990) for AV ≳ 3 mag (AJ ≳ 0.8 mag) (McClure 2009; Chapman et al. 2009). Luhman (2004a) has shown that the extinction toward Cha I does not follow the standard ISM extinction law of Cardelli et al. (1989) or Mathis (1990). Moreover, using the standard ISM extinction curve to deredden the IRS spectra causes the 10 μm silicate feature to be sharply peaked at ∼9.7 μm, especially for objects with large extinction (Furlan et al. 2009). For these reasons, we adopt the composite extinction law prescribed by McClure (2009) to deredden the observed broadband flux and IRS spectra of Cha I objects. This method has been successfully used to deredden the IRS spectra of young stars in the nearby young clusters (Furlan et al. 2009; McClure et al. 2010). We deredden the broadband photometry and IRS spectra as follows: objects with AJ < 0.8 mag (A < 0.3 mag) are derddened using extinction law from Mathis (1990) with RV = 5 (see Furlan et al. 2009; McClure et al. 2010). For objects with AJ ⩾ 0.8 mag (A
 ⩾ 0.3 mag), we used the appropriate extinction curves from McClure (2009) to deredden the photometry and the IRS spectra.
Figure 2. Distribution of extinction (AJ) towards the young stars in Cha I.
Download figure:
Standard image High-resolution image3.2. Spectral Energy Distributions and Classification
We constructed the SEDs of the objects in our sample from the photometry compiled from the literature and the IRS spectra. Objects for which the AJ values are listed in Table 2, the SEDs were generated from the dereddened fluxes. The stellar photospheric flux for stars with known spectral types was derived from the colors of main-sequence stars tabulated by Kenyon & Hartmann (1995), normalized at the dereddened J-band flux of each object. Objects for which spectral types and extinction values are not available, we present the observed SEDs. The SEDs of Cha I members are shown in Figures 3–7 and those of Cha members are shown in Figure 8.

Figure 3. SEDs of Class I objects in the Chamaeleon I sample. Photometric (DENIS, 2MASS, IRAC, and MIPS) measurements are shown as solid circles and the IRS spectrum as solid line. The dashed line represents the stellar photosphere.
Download figure:
Standard image High-resolution image
Figure 4. SEDs of Flat spectrum sources in the Chamaeleon I sample. Symbols and line types have the same meaning as in Figure 3.
Download figure:
Standard image High-resolution image
Download figure:
Standard image High-resolution image
Download figure:
Standard image High-resolution image
Download figure:
Standard image High-resolution image
Download figure:
Standard image High-resolution image
Figure 5. SEDs of Class II objects in the Chamaeleon I sample. Symbols and line types have the same meaning as in Figure 3.
Download figure:
Standard image High-resolution image
Figure 6. SEDs of transitional disks in the Chamaeleon I sample. Symbols and line types have the same meaning as in Figure 4.
Download figure:
Standard image High-resolution image
Figure 7. SEDs of Class III objects in the Chamaeleon I sample. Symbols and line types have the same meaning as in Figure 4.
Download figure:
Standard image High-resolution image
Figure 8. SEDs of stars which are probable members of Cha group. Symbols and line types have the same meaning as in Figure 4.
Download figure:
Standard image High-resolution imageWe first classified the Cha I YSOs into various SED classes based on the spectral index between 2.2 μm and 25 μm (Lada 1987; Wilking 1989; Greene et al. 1994). The spectral index, n2–25, is computed using the relation
from the 2MASS Ks-band flux (λ1 = 2.159 μm) and the IRS spectrum (λ2 = 25 μm). YSOs with n2–25 ⩾ 0.3 are classified as Class I sources; objects with 0.3 ⩾ n2–25 ⩾ −0.3 are classified as Flat spectrum sources; sources with −0.3 ⩾ n2–25 ⩾ −2.0 as Class II objects; and n2–25 ⩽ −2.0 as Class III sources (also see Luhman et al. 2008). The n2–25 values and the SED classes based on them are listed in Table 2. Objects for which AJ values are listed, the observed and the dereddened values of n2–25 are presented in the table; the SED classes of these objects remain unchanged for both these values. For objects with unknown extinction, the SED classes listed in Table 2 are based on the observed n2–25. The SED classification yields 6 Class I sources, 5 Flat spectrum sources, 68 Class II sources, and 3 Class III sources.
Our SED classification of the Cha I objects is in good agreement with the classification by Luhman et al. (2008) based on their IRAC and MIPS photometry of these objects. Of the 74 sources that are common between the two samples, only 7 show disagreement between the classifications. Four of these, T25, T29, ISO 126 and T33A, do not have MIPS measurements available and the classification by Luhman et al. (2008) is based on the 2–8 μm slope which differs from our classification based on the n2–25 index. For the other three objects, ISO 86, Ced110 IRS6, and C1-25, our classification is consistent with that based on the 2–24 μm slopes listed in Luhman et al. (2008); however, the classification of these objects based on the slope at wavelengths ⩽8 μm differs from that based on n2–25 index, so as to make the classification ambiguous (Luhman et al. 2008). Moreover, the extinction toward these objects is uncertain and the spectral slopes are computed from the observed SEDs. These objects are further discussed below, where we explore the connection between the SED classes and the evolutionary status of YSOs in Cha I.
The empirical SED classification based on the IR slope need not always correspond to the physical evolutionary stages predicted by the star formation theory (e.g., Evans et al. 2009). As pointed out by several authors (Robitaille et al. 2007; Crapsi et al. 2008; McClure et al. 2010), the spectral index n2–25 is affected by the viewing geometry of the source and/or the line-of-sight extinction, especially in regions of high extinction. A highly extinguished Class II object could easily be misclassified as a Flat spectrum or a Class I source (Robitaille et al. 2007; Crapsi et al. 2008; McClure et al. 2010). In order to disentangle the effect of extinction, and to determine if the mid-IR emission from Class I and Flat spectrum sources is envelope dominated, we make use of the "extinction-free" index between 5 and 12 μm (n5–12) introduced by McClure et al. (2010). The slope of the SED measured between these wavelengths is shown to remain unaffected by extinction (McClure 2009; McClure et al. 2010).
The n5–12 values for our sample are listed in Table 2. Figure 9 shows the plot between observed n2–25 index used for SED classification and the "extinction-free" index n5–12. The regions occupied by various SED classes are shown in the figure. From an analysis of the well-studied protostars in Taurus, McClure et al. (2010) have shown that for objects with n5–12> − 0.2, envelope emission dominates the mid-IR wavelengths and for objects n5–12 < −0.2, the mid-IR emission is disk dominated. For n5–12 < −2.25, the mid-IR emission is mostly photospheric. Below we briefly describe the objects in various SED classes and discuss if they are envelope or disk sources.
Figure 9. Comparison of the observed spectral indices n2–25 and n5–12. Dashed horizontal lines indicate the regions occupied by Class I, Flat spectrum, Class II, and Class III sources. Dotted vertical lines separate envelope, disk, and photospheric sources.
Download figure:
Standard image High-resolution imageClass I Objects. The SEDs of the six Class I objects in our sample are presented in Figure 3 and their IRS spectra are presented in Figure 10. Only four of them show n5–12> − 0.2 indicating the presence of envelope around them. They are Ced110 IRS4, Cha IRN, ISO 192, and T14a. Except for T14a, the other three show strong ice absorption features in the IRS spectra: at 6.0 μm due to H2O ice, at 6.8 μm due to CH3OH, NH+4, and strongly polar H2O ice, and at 15.2 μm due to CO2 ice. The 10 μm silicate feature is also strongly in absorption indicating the presence of envelope material around them.
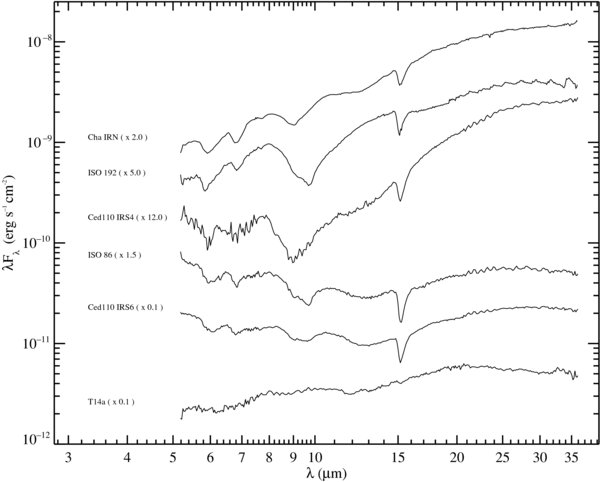
Figure 10. IRS spectra of the Class I objects in our sample. For T14a, the dereddened spectrum is shown. Spectra have been scaled to fit the figure.
Download figure:
Standard image High-resolution imageT14a, on the other hand, shows featureless mid-IR spectrum. The extinction toward it is relatively low (AJ = 0.4 mag) compared to that toward many of the Class II sources in our sample. The optical spectrum of this source suggests that it is a CTTS (see Table 2) with strong forbidden lines (Schwartz et al. 1984). T14a is unlikely to have an envelope around it. It is a 235 binary (Haisch et al. 2004) and the IRS spectrum presented here is a composite of both the components. The contribution from the companion is probably responsible for the rising SED and its misclassification as a Class I source.
Two Class I sources, Ced110 IRS6 (ISO 92) and ISO 86 (CED110 IRS11), have n5–12 < −0.2 indicating that their mid-IR emission is disk dominated. Both these sources have been classified as Flat spectrum sources by Luhman et al. (2008) based on their 3.6–8 μm and 3.6–24 μm SED slopes. Ced110 IRS6 is a 195 binary, but the primary appears to dominate the mid-IR flux (Persi et al. 2001; Haisch et al. 2006). Both Ced110 IRS6 and ISO 86 have been reported to have HCO+ (4–3) emission, which traces the dense envelope gas; however, the peak intensity of the HCO+ (4–3) emission in both these sources is significantly lower than that observed for the envelope sources Ced110 IRS4 and Cha IRN (van Kempen et al. 2009; Hiramatsu et al. 2007). Ced110 IRS6 is not detected at 1.3 mm or at centimeter wavelengths, indicating weak envelope emission (Henning et al. 1993; Lehtinen et al. 2001, 2003; Hiramatsu et al. 2007). Likewise, ISO 86 is not detected longward of 100 μm suggesting that the source does not have dense envelope material around it (Lehtinen et al. 2001, 2003). However, both these sources show ice and silicate absorption features (see Figure 10) indicating the presence of cold material along the line of sight. They are likely to be disk-dominated sources with low-density envelope around them, which are either viewed edge-on and/or extinguished by foreground cloud material.
Flat spectrum sources. The SEDs of the Flat spectrum sources are presented in Figure 4 and their IRS spectra are presented in Figure 11. All the Flat spectrum sources in Figure 9 fall close to the envelope—disk boundary of n5–12 = −0.2, indicating that their envelope emission, if any, is weak. Their IRS spectra show weak or no ice absorption features; the silicate features in most of them are weakly in emission, indicating very little absorbing material between the sources and the observer. They are likely disks viewed at higher inclination angles and/or disks with remnant envelopes.

Figure 11. IRS spectra of the Flat spectrum sources in our sample. Objects for which AJ values are listed in Table 2, the dereddened spectra are shown. Spectra have been scaled to fit the figure.
Download figure:
Standard image High-resolution imageClass II objects. All Class II objects show the presence of broad silicate emission features at 10 μm and at 20 μm in their IRS spectra. The SEDs of Class II objects in our sample are presented in Figure 5 and their IRS spectra are presented in Figures 12–17. The spectra are shown in a sequence of decreasing strength of the 10 μm silicate emission feature and decreasing mid-IR continuum slope. T33A does not have n2–25 listed in Table 2 as the Ks-band flux is an upper limit. But the IRS spectrum shows strong silicate emission at 10 and 20 μm (Figure 12), and the n5–12 index is consistent with disk emission. We classify T33A as a Class II source. The two B-type stars in our sample, CU Cha and HD 97300, are well-known Herbig Be stars (Thé et al. 1994; Hillenbrand et al. 1992). We classify both of them as Class II objects (also see Luhman et al. 2008). We present the SEDs and IRS spectra of these Herbig Be stars, but do not include them in our analysis.
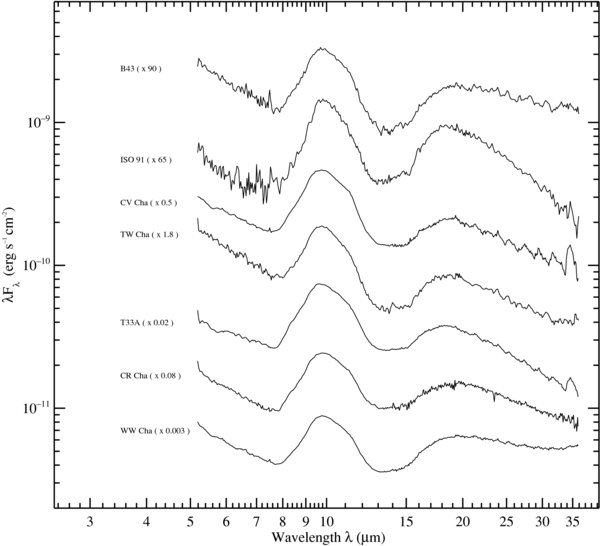
Figure 12. Dereddened IRS spectra of Class II objects which show enhanced 10 μm silicate emission (W10 ≳ W ).
).
Download figure:
Standard image High-resolution image
Figure 13. Dereddened IRS spectra of Class II objects with moderate 10 μm feature strength and flatter continuum.
Download figure:
Standard image High-resolution image
Figure 14. Dereddened IRS spectra of Class II objects with moderate 10 μm feature strength and steeper (more negative) continuum slope.
Download figure:
Standard image High-resolution image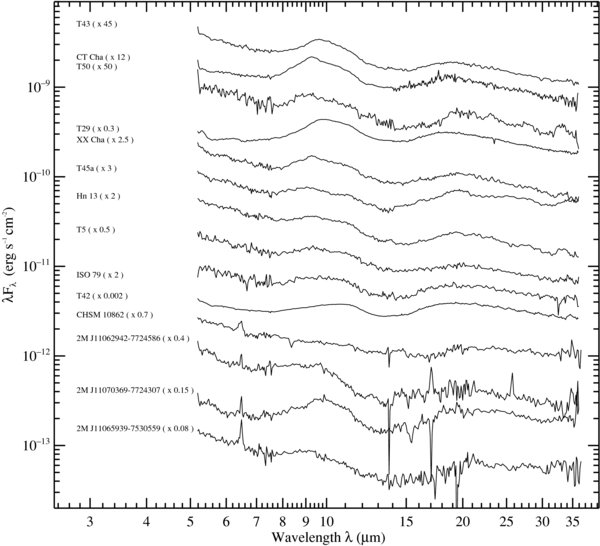
Figure 15. Dereddened IRS spectra of Class II objects with weak 10 μm silicate emission and flatter continuum.
Download figure:
Standard image High-resolution image
Figure 16. Dereddened IRS spectra of Class II objects with weak 10 μm silicate emission and steeper (more negative) continuum.
Download figure:
Standard image High-resolution image
Figure 17. Dereddened IRS spectra of Class II objects which could not fit in to the other groups. The first two are B type stars in the sample and the next two are outwardly truncated disks.
Download figure:
Standard image High-resolution imageTransitional disks. A few of the Class II disks in Cha I have been identified as transitional disk candidates by Kim et al. (2009). The SEDs of transitional disks are characterized by a deficit of flux at wavelengths <8 μm compared with that of the Class II median, and significant excess emission comparable to or higher than that of Class II median longward of ∼13 μm (Calvet et al. 2005; Espaillat et al. 2007a, 2007b; kim et al. 2009). They are protoplanetary disks with dust depleted inner holes or gaps within them (Strom et al. 1989; Calvet et al. 2005; Najita et al. 2007; Espaillat et al. 2007a; Brown et al. 2007). In Section 4.1.3, we present a more quantitative criterion based on the continuum indices to identify transitional disks from a large sample of Class II disks. We confirm the transitional disk candidates reported by Kim et al. (2009) and identify an additional transitional disk candidate, 2M J11241186−7630425. We reclassify one of the transitional disk candidates reported by Kim et al. (2009), T21, as a Class III object (see below). The SEDs of eight transitional disks in Cha I are shown in Figure 6 and their IRS spectra are shown in Figure 18.
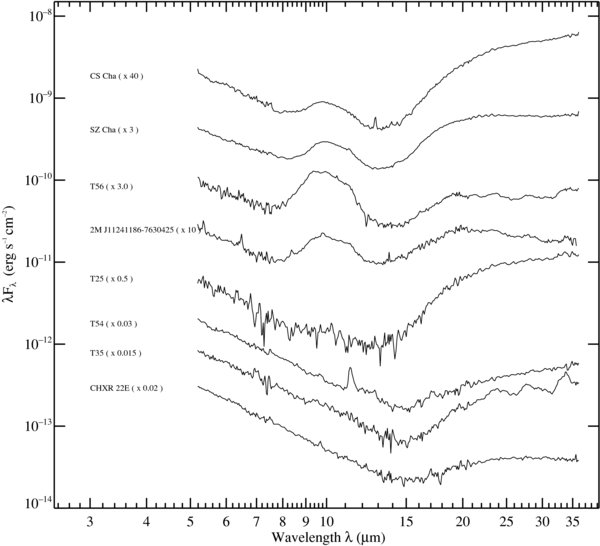
Figure 18. IRS spectra of transitional disk candidates.
Download figure:
Standard image High-resolution imageClass III objects. The SEDs of the three Class III objects are shown in Figure 7. They have n5–12 < −2.25 (see Figure 9) consistent with their emission being photospheric.
We assessed the completeness of the objects belonging to various SED classes in our sample by comparing them with the Cha I YSOs observed and classified with Spitzer IRAC and MIPS imaging of the Cha I cloud (see Luhman et al. 2008). Our sample contains all the Class I and Flat spectrum sources in Luhman et al. (2008) except three, two of which are later than M3. Compared to Luhman et al. (2008), our sample of Class II objects is complete for spectral types M1 or earlier and 84% complete for spectral types M5 or earlier. Since our sample is flux limited, it has only 3 Class III sources, compared to the 95 identified by Luhman et al. (2008).
Cha members. Among the Cha members, 2M J11183572−7935548 appears to be a transitional disk candidate and 2M J11432669−7804454 is a Class II object. The SEDs of these objects are shown in Figure 8.
4. DISK STRUCTURE AND EVOLUTION
The mid-IR excess emission observed for the Class II objects arises from the protoplanetary disks surrounding them. The shape of the continuum and the dust emission features in the IRS spectrum can be used to study the evolution of disk structure and dust properties. In the following, we carry out a detailed analysis of the SEDs and the IRS spectra of the Class II objects in Cha I and compare their observed properties with those predicted by the irradiated, accretion disk models (D'Alessio et al. 2006; Espaillat 2009).
4.1. Continuum Spectral Indices and Disk Structure
In order to study the structure and evolution of Class II disks in Cha I, we quantify the shape of their mid-IR continuum by computing various spectral indices from the dereddened 2MASS Ks-band flux density and IRS spectra. The continuum spectral indices,  , were computed using Equation (1) between the wavelengths 2.159 and 5.7 μm (n2–6), 5.7 and 13.4 (n6–13) μm, and 13.4 and 31.1 μm (n13–31) (Furlan et al. 2006, 2009; Watson et al. 2009; McClure et al. 2010). These wavelengths were chosen because they are relatively free of gas and dust emission features. The spectral indices computed for Class II, transitional and Class III objects in our sample are listed in Table 4.
Table 4. Continuum Spectral Indices of Class II and Class III Objects
| Object Name | n2–6 |  |
n6–13 |  |
n13–31 |  |
|---|---|---|---|---|---|---|
| SX Cha | −0.81 | 0.05 | −0.65 | 0.05 | −0.49 | 0.07 |
| T5 | −1.73 | 0.06 | −0.87 | 0.08 | −0.32 | 0.07 |
| 2M J10580597−7711501 | −2.08 | 0.08 | −0.93 | 0.11 | 0.26 | 0.09 |
| SZ Cha | −2.07 | 0.08 | −1.04 | 0.09 | 1.72 | 0.03 |
| TW Cha | −1.56 | 0.08 | −1.27 | 0.10 | −0.17 | 0.10 |
| CR Cha | −1.82 | 0.06 | −0.48 | 0.06 | −0.12 | 0.04 |
| 2M J11011926−7732383 | −2.11 | 0.08 | −2.79 | 0.29 | −1.50 | 0.81 |
| CS Cha | −2.62 | 0.07 | −1.46 | 0.13 | 2.90 | 0.11 |
| CT Cha | −1.15 | 0.03 | −0.46 | 0.02 | −0.32 | 0.07 |
| ISO 52 | −1.98 | 0.07 | −0.42 | 0.08 | 0.15 | 0.05 |
| T21 | −2.70 | 0.09 | −2.71 | 0.14 | −1.07 | 0.14 |
| 2M J11062942−7724586 | −1.61 | 0.11 | −1.40 | 0.27 | −0.16 | 0.27 |
| CHSM 7869 | −1.81 | 0.07 | −1.01 | 0.13 | −0.56 | 0.22 |
| ISO 79 | −1.21 | 0.08 | −0.71 | 0.11 | −0.04 | 0.06 |
| Hn 5 | −0.67 | 0.05 | −0.77 | 0.08 | −1.44 | 0.12 |
| UX Cha | −2.64 | 0.10 | −2.66 | 0.44 | −2.01 | 0.94 |
| CHXR 20 | −2.15 | 0.07 | −0.78 | 0.08 | −0.96 | 0.06 |
| UY Cha | −1.70 | 0.07 | −0.48 | 0.09 | −0.92 | 0.07 |
| 2M J11065939−7530559 | −1.75 | 0.09 | −1.27 | 0.16 | 0.37 | 0.19 |
| 2M J11070369−7724307 | −1.55 | 0.12 | −0.68 | 0.12 | 0.15 | 0.07 |
| ISO 91 | −2.38 | 0.09 | −0.22 | 0.12 | −0.40 | 0.11 |
| UZ Cha | −1.76 | 0.08 | −0.95 | 0.10 | −0.22 | 0.07 |
| CHXR 22E | −2.51 | 0.09 | −2.70 | 0.17 | 0.58 | 0.14 |
| Cha Ha1 | −1.50 | 0.08 | 0.07 | 0.12 | 0.01 | 0.09 |
| T25 | −2.75 | 0.12 | −1.75 | 0.26 | 2.80 | 0.23 |
| DI Cha | −1.35 | 0.06 | −1.01 | 0.06 | −0.67 | 0.05 |
| VV Cha | −1.74 | 0.06 | −0.38 | 0.07 | −0.78 | 0.07 |
| Cha Ha2 | −1.66 | 0.08 | −1.04 | 0.10 | −0.99 | 0.07 |
| T28 | −1.61 | 0.06 | −0.99 | 0.08 | −0.60 | 0.07 |
| CHSM 10862 | −1.41 | 0.05 | −0.87 | 0.11 | −0.05 | 0.11 |
| CHXR 30B | −0.81 | 0.06 | −1.33 | 0.08 | −0.39 | 0.09 |
| T29 | −1.06 | 0.03 | −0.07 | 0.03 | −0.32 | 0.03 |
| CHXR 30A | −2.49 | 0.08 | −1.51 | 0.11 | −0.59 | 0.09 |
| VW Cha | −1.48 | 0.06 | −0.93 | 0.06 | −0.17 | 0.06 |
| CU Cha | −1.26 | 0.05 | 0.02 | 0.06 | 1.03 | 0.05 |
| T33Aa | ... | ... | −0.40 | 0.06 | −0.55 | 0.03 |
| ISO 138 | −1.69 | 0.58 | −0.69 | 0.76 | −0.27 | 0.42 |
| ISO 143 | −1.50 | 0.06 | −0.85 | 0.08 | −1.04 | 0.10 |
| T35 | −2.01 | 0.08 | −2.56 | 0.20 | 1.47 | 0.19 |
| VY Cha | −1.35 | 0.06 | −1.13 | 0.07 | −0.19 | 0.05 |
| C1-6 | −0.59 | 0.04 | −0.45 | 0.04 | −0.61 | 0.05 |
| VZ Cha | −1.41 | 0.06 | −0.85 | 0.05 | −0.91 | 0.07 |
| C7-1 | −2.02 | 0.08 | −1.81 | 0.10 | −0.56 | 0.11 |
| Hn 10E | −1.41 | 0.07 | −0.05 | 0.08 | 0.37 | 0.05 |
| B43 | −1.84 | 0.06 | −1.11 | 0.09 | 0.43 | 0.10 |
| HD 97300 | −2.50 | 0.09 | −0.15 | 0.22 | −0.85 | 0.23 |
| ISO 220 | −1.67 | 0.07 | −0.98 | 0.09 | −0.82 | 0.10 |
| T42 | −0.73 | 0.04 | −0.35 | 0.03 | 0.00 | 0.02 |
| T43 | −1.36 | 0.05 | −0.89 | 0.06 | −0.37 | 0.05 |
| WX Cha | −1.15 | 0.06 | −1.14 | 0.07 | −1.02 | 0.07 |
| WW Cha | −0.90 | 0.07 | −0.69 | 0.05 | 0.42 | 0.02 |
| Hn 11 | −1.05 | 0.04 | −0.65 | 0.05 | −0.73 | 0.05 |
| T45a | −2.06 | 0.05 | −0.89 | 0.07 | 0.14 | 0.06 |
| WY Cha | −1.53 | 0.04 | −0.88 | 0.06 | −1.16 | 0.08 |
| ISO 235 | −1.69 | 0.06 | −0.75 | 0.09 | −1.26 | 0.09 |
| ISO 237 | −1.65 | 0.06 | −0.81 | 0.08 | 0.52 | 0.06 |
| CHXR 47 | −1.87 | 0.07 | −1.08 | 0.08 | −0.66 | 0.06 |
| ISO 252 | −1.40 | 0.05 | −0.72 | 0.07 | −0.87 | 0.09 |
| T47 | −1.46 | 0.04 | −0.04 | 0.04 | −0.27 | 0.05 |
| WZ Cha | −1.29 | 0.05 | −0.39 | 0.08 | −0.75 | 0.08 |
| ISO 256 | −0.92 | 0.07 | −0.65 | 0.08 | −0.62 | 0.07 |
| Hn 13 | −1.58 | 0.05 | −1.04 | 0.06 | −0.40 | 0.05 |
| XX Cha | −1.48 | 0.04 | −0.81 | 0.06 | −0.38 | 0.07 |
| ISO 282 | −1.16 | 0.08 | −1.48 | 0.10 | −0.54 | 0.07 |
| T50 | −1.85 | 0.10 | −0.98 | 0.14 | −0.33 | 0.11 |
| T51 | −1.09 | 0.04 | −1.08 | 0.07 | −1.52 | 0.11 |
| CV Cha | −1.41 | 0.04 | −0.69 | 0.04 | −0.27 | 0.07 |
| T54 | −2.88 | 0.07 | −2.38 | 0.17 | 1.10 | 0.16 |
| Hn 21W | −1.98 | 0.08 | −1.17 | 0.09 | −0.77 | 0.10 |
| T56 | −2.13 | 0.12 | −1.14 | 0.15 | 0.90 | 0.07 |
| 2M J11241186−7630425 | −2.33 | 0.08 | −0.81 | 0.13 | 0.68 | 0.11 |
Note.a 2MASS Ks flux is an upper limit, therefore n2–6 value is not listed.
In Figure 19, we present a plot of the continuum spectral indices n13–31 and n6–13 for the Class II and Class III objects in Cha I. Transitional disk candidates identified in Section 3.2 are labeled separately. Figure 19 shows that the spectral indices of Class III objects are very close to that of the stellar photosphere. Most transitional disk candidates separate out from other Class II objects in the spectral indices plot. Two Class II disks, T51 and Hn 5, show n13–31 < −1.33, bluer than that for an optically thick, flat disk, suggesting that the disks around them are truncated from outside (see Furlan et al. 2009). Gravitational interaction with a close companion (≲1'' separation at the distance of Cha I) is known to cause outward truncation of the disks (Artymowicz & Lubow 1994; McClure et al. 2008). T51 is a 19 binary (physical separation ∼314 AU) (Reipurth & Zinnecker 1993; Ghez et al. 1997; Lafrenière et al. 2008), but it is unlikely that such a wide companion can cause disk truncation. Hn 5 is not known to have close companions.
Figure 19. Continuum spectral index n13−31 plotted against the index n6–13 (see the text for definitions) for Class II (open diamonds) and Class III (solid gray circles) objects. Transitional disk candidates are shown as solid diamonds. The star symbol represents location of the stellar photosphere (n = −3). The dashed line indicates n13–31 = −4/3 appropriate for a geometrically thin, optically thick, flat disk.
Download figure:
Standard image High-resolution image4.1.1. Dust Settling in Cha I Disks
Next we compare the observed continuum indices of the Class II disks in Cha I with those predicted by irradiated, accretion disk models. The models used here are based on the formalism of D'Alessio et al. (2006), where the vertical disk structure is derived self-consistently. The dust in the disk is assumed to be composed of olivine silicate and graphite grains (Dorschner et al. 1995; Draine & Lee 1984) which are assumed to follow a power-law size distribution of the form n(a) ∝ a−3.5. The disk surface layers are populated with mostly small grains (amin = 0.005 μm, amax = 0.25 μm) and the disk midplane with large grains (amin = 0.005 μm, amax = 1 mm). The models incorporate disk evolutionary effects such as dust settling by parameterizing the depletion of the small grains from the surface layers of the disk. The dust depletion factor, , is defined as the ratio of the dust-to-gas mass ratio in the upper layers to that of the ISM. A value of = 1 implies no dust settling and the degree of settling increases with decreasing value of . For = 0.001, the small grains in the upper layers of the disk are depleted by a factor of 1000 relative to the interstellar dust-to-gas mass ratio, with a corresponding increase of large grains close to the disk midplane (for details, see D'Alessio et al. 2006; Espaillat 2009).
We computed the continuum spectral indices for a grid of disk models for central stellar masses of 0.5 and 0.2 M☉ and for different accretion rates, inclination angles, and the settling parameters (Espaillat 2009). These models are the same as those used in Furlan et al. (2009) and McClure et al. (2010). The stellar masses chosen for the models are representative of the masses of objects in our Cha I sample (Luhman 2007). The continuum spectral indices, n6–13 and n13–31, were computed from the model SEDs following the same procedure as for the data. These indices, computed from the models, are compared to those evaluated from the IRS spectra of Cha I objects in Figure 20. The observed values of n6–13 and n13–31 indices of Class II objects in Cha I are well explained by the disk models with settling parameter of 0.01 and 0.001 for a range of accretion rates and inclination angles, which indicates that the surface layers of the disks in these objects are depleted of small grains by a factor of 100–1000. The disks surrounding Class II objects in Cha I seem to have undergone substantial dust settling. Similar results have also been found for protoplanetary disks in Taurus and Ophiuchus (Furlan et al. 2006; Watson et al. 2009; McClure et al. 2010). Even though the disks around Class II objects show evidence for significant dust settling, almost all of them have values of n6–13 and n13–31 indices > − 1.33, appropriate for an optically thick, flat disk, suggesting that even the most settled disks observed are flared to some degree. Figure 20 shows that the disk models, clearly, cannot explain the mid-infrared continuum indices observed for transitional disks. They have altered disk structures and the mid-infrared continuum emission from them originates in different regions of the disks.

Figure 20. n13–31 vs. n6–13 for Cha I objects. The symbols have the same meaning as in Figure 19. Overplotted are the spectral indices computed from accretion disks models (see the text for details) for 0.2 M☉ (solid star symbol) and 0.5 M☉ stars(solid circles). The model indices computed for accretion rates of 10−7 M☉yr−1 (top left panel), 10−8 M☉yr−1 (top right panel), 10−9 M☉yr−1 (bottom left panel) and 10−10 M☉yr−1 (bottom right panel) and for inclination angles of 60° (green), 40° (blue), and 20° (red) are shown. Model indices for the settling parameter of 1, 0.1, 0.01, and 0.001 are represented by the sizes of the solid symbols from the smallest to the largest.
Download figure:
Standard image High-resolution image4.1.2. Comparison with Disks in Taurus
Substantial dust settling has also been observed for the protoplanetary disks in the Taurus star-forming region (Furlan et al. 2006; Watson et al. 2009). In Figure 21, we compare the continuum spectral indices of low-mass (spectral type G0 and later) Class II objects in the Cha I and the Taurus star-forming regions. The continuum indices of the Class II sources in Taurus were computed from their IRS spectra presented in Furlan et al. (2006). The transitional disks in both regions are not included in the figure as they have very different disk structures and the interpretation of their continuum indices is not the same as that for full disks (see Section 4.1.3). The distribution of n13–31 (top panel) and n6–13 (middle panel) indices is very similar for both regions. Two-sided Kolmogorov–Smirnov (K-S) test gives the following values for the maximum deviation between the two cumulative distributions D and the significance level of the K-S statistic P%: D = 0.09 and P = 94% for n13–31 and D = 0.1 and P = 83% for n6–13, which indicate that the distribution of these two indices is statistically the same for objects in Cha I and Taurus. The vertical dust distribution in the disks in these two regions appears to be similar. Thus, protoplanetary disks in Taurus region, which has a median age of ∼1 Myr (Kenyon & Hartmann 1995; Hartmann 2001), show similar degree of dust settling as that of those in Cha I, which is slightly older, at a median age of 2 Myr (Luhman 2008). Recent analysis of the IRS spectra of ≲1 Myr Ophiuchus star-forming region has shown that the distribution of mid-IR continuum indices of Class II objects in Ophiuchus is statistically not different from that for objects in Taurus (McClure et al. 2010). This indicates that most protoplanetary disks have undergone significant dust settling by ≲1 Myr. This is not surprising, as theoretical models predict timescales as short as ≪1 Myr for grain growth and dust sedimentation in planet-forming disks (Dullemond & Dominik 2005; Dominik et al. 2007). However, protoplanetary disks in the older Cha I region show no evidence for higher degree of dust settling compared to the disks in younger Taurus and Ophiuchus regions, indicating that the dust settling is not just a monotonic function of age. Even within a region, protoplanetary disks show a large range in the observed degree of dust settling. This suggests that other processes such as fragmentation of large grains in the midplane and turbulent mixing must be at work (e.g., Oliveira et al. 2010) along with grain growth and sedimentation so as to produce the observed statistical distribution of dust settling for ≲1–2 Myr old protoplanetary disks.

Figure 21. Distribution of continuum indices for the Class II (full) disks in Cha I (gray solid histogram) and Taurus (line histogram).
Download figure:
Standard image High-resolution imageThe distribution of n2–6 index in Figure 21 (bottom panel), however, is quite different for the disks in Cha I and Taurus. A K-S test gives D = 0.24 and P = 5% indicating that the distribution of n2–6 of Class II (full) disks in Cha I is statistically different from that of Taurus. A significant fraction of Taurus objects have redder (more positive) n2–6 values than Cha I objects. To illustrate this further, in Figure 22 we plot the n13–31 index against n2–6 index for Class II objects in Taurus and Cha I (also see McClure et al. 2010). On average, the observed values of n2–6 index of Cha I objects are bluer (more negative) than that for objects in Taurus. The median n2–6 for Cha I (n = −1.61) is lower than the Taurus median (n
 = −1.41). This is partly because of the difference in the underlying spectral type distribution of the Taurus and the Cha I sample: there are many more objects in the M3–M8 spectral type range in the Cha I sample than in the Taurus sample resulting in the spectral type distribution peaking around M5 for Cha I and M0 for Taurus. For Cha I the median n2–6 index for M3–M8 objects (n
 = −1.69) is significantly bluer than that for the K5–M2 objects (n
 = −1.48; also see Section 4.3) and this shifts the overall median to the bluer side.
Figure 22. Continuum spectral indices n2–6 and n13–31 plotted against each other for Class II objects in Taurus (top) and Cha I (bottom). The dotted lines represent the median of the indices and the dashed lines represent lower and higher octiles for the two regions. Transitional disks in both regions are shown as solid star symbols.
Download figure:
Standard image High-resolution imageFigure 22 also shows that Cha I lacks objects with extreme red n2–6: as many as seven Class II objects in Taurus have n2–6 ≳ −0.5; no objects in Cha I show n2–6 ≳ −0.5. Most of the excess emission in the 2–6 μm range in Class II objects comes from the innermost parts of the disks—from the inner rim at the dust sublimation radius heated directly by the stellar radiation. When the accretion rate is high, the added contribution from the accretion shock on the stellar surface increases the net emission from the inner rim (Muzerolle et al. 2003) which tends to make n2–6 index flatter (more positive) and when the accretion luminosity is comparable to or higher than the intrinsic stellar luminosity, the n2–6 ≈ 0 (P. D'Alessio et al. 2011, in preparation). As can be seen from Figure 22 (bottom panel), the uppermost octile of the n2–6 distribution (12.5% of the points lie above this value) for the Taurus sample is significantly redder than that for Cha I. Some of the objects in Taurus which have n2–6 ≳ n , namely, DP Tau, DR Tau, and DG Tau are the highest accretors in that region. High accretors with large n2–6 values have also been found among the Class II objects in the Ophiuchus region (McClure et al. 2010). However, there is clearly a paucity of such high accretors in Cha I as indicated by the absence of objects with large n2–6 indices. This is unlikely to be a selection effect. The high accretors in Taurus with n2–6 ≳ −0.5 have spectral types earlier than M1. As discussed in Section 3.2, the Class II disks in Cha I sample are complete for spectral types M1 or earlier. Moreover, T Tauri stars with high accretion rates tend to have higher mid-IR excess emission (D'Alessio et al. 2006). Since our sample is mid-IR flux limited, it is unlikely that we have preferentially missed out high accretors in Cha I with spectral types M1 or earlier. The lack of high accretors in Cha I in this spectral range is possibly a result of temporal evolution such that Cha I which is older, on average, than both Ophiuchus and Taurus appears to have fewer high accretors. This is consistent with the general finding that accretion rate on average decreases with system age (Hartmann et al. 1998).
4.1.3. Transitional and Pre-transitional Disks
The structural diversity among the transitional disks has been demonstrated from the detailed modeling of these objects, particularly in the Taurus region (D'Alessio et al. 2005; Calvet et al. 2005; Espaillat et al. 2007a, 2008, 2010). Objects such as CoKu Tau4, DM Tau, and GM Aur show no or at most small continuum excess emission at wavelengths ≲8 μm indicating that their inner optically thick disks have been almost entirely dissipated (D'Alessio et al. 2005; Nagel et al. 2010; Calvet et al. 2005). The term "transitional disks" (hereafter TDs) has been specifically used to designate such disks with inner holes. Some of these disks may contain small amounts of optically thin dust within their inner holes as in the case of GM Aur. The n2–6 index of TDs typically is smaller than the lowest octile ( ) as can be seen from Figure 22 (top panel).
In contrast, objects such as LkCa 15 and UX TauA, which show a flux deficit at wavelengths ≲8 μm relative to the Class II median, have near-IR (≲4 μm) excess emission consistent with that from an optically thick disk. These objects have an inner optically thick disk which is separated from the outer optically thick disks by an optically thin gap. Such disks with radial gaps in them have been called "pre-transitional" disks (PTDs; Espaillat et al. 2007a, 2008, 2010), with the name implying an evolutionary stage earlier than that of TDs. PTDs show higher excess at shorter wavelengths than the TDs and their n2–6 values fall between the lowest octile and the median ( ) (see Figure 22). Both TDs and PTDs in Taurus show n13–31 ≳ the upper octile (
 ) (McClure et al. 2010).
Based on the locations of well-modeled TDs and PTDs in Taurus in the n13–31–n2–6 plot (Figure 22; bottom panel), we classify CS Cha, T25, T54, CHXR 22E, and 2M J11241186−7630425 in Cha I as TDs with inner holes (also see Kim et al. 2009; Furlan et al. 2009). All these objects have n2–6 ≲ and n13–31 ≳
  . The disk around CS Cha has already been modeled and is found to have an inner hole of ∼43 AU in radius (Espaillat et al. 2007b). The locations of SZ Cha, T35, and T56 in Figure 22 (bottom panel) would qualify them as PTDs (also see Kim et al. 2009; Furlan et al. 2009). Their n2–6 values fall between the median and the lower octile and their n13–31 values are above the upper octile. Modeling of the individual SEDs and high-resolution submillimeter/millimeter imaging of the TDs and PTDs are required to constrain the detailed structure of their disks.
4.2. Analysis of the Silicate Emission Features
4.2.1. Silicate Emission and Disk Structure
In this section, we explore the connection between the disk structure as revealed by the mid-IR continuum spectral indices and the strength of the silicate emission features in the observed spectra of Class II disks in Cha I (see also Watson et al. 2009; Furlan et al. 2009; McClure et al. 2010). To quantify the strength of the silicate emission we computed the equivalent width of the dust emission features centered at 10 μm and 20 μm. The equivalent width is defined as
and we integrate between λ1 = 8 μm and λ2 = 13 μm to obtain the equivalent width of the 10 μm feature, W10 and between λ1 = 16 μm and λ2 = 28 μm to obtain the equivalent width of the 20 μm feature, W20. We also computed the integrated flux of the 10 and 20 μm features as
and integrating between the same limits as above to obtain F10 and F20. In order to compute the equivalent widths and the integrated flux of the silicate emission features, we first fit a continuum to the observed spectra as a polynomial of degree 3, 4, or 5 depending on the shape of the continuum. The points used for the continuum fit were chosen so that the dust emission features are small within those wavelength ranges: 5.61–7.94 μm, 13.02–13.50 μm, 14.32–14.80 μm, 30.16– 32.19 μm, and 35.07–35.92 μm (Watson et al. 2009). For objects for which the continuum could not be fit by a single polynomial, we used a two polynomial fit, one between wavelength interval 5–14 μm and the other between 14–36 μm, making sure that the overall continuum is smoothly varying. The values of integrated flux and equivalent widths of the silicate emission features thus obtained are tabulated in Table 5. The dominant source of errors in the quantities estimated from the observed silicate features is the uncertainty in the determination of the underlying continuum. In particular, the equivalent width of the 20 μm feature, which is broader and generally flatter than the 10 μm feature, is much more sensitive to the choice of the continuum. The errors listed in Table 5 assume an uncertainty of 20% in the estimated continuum underlying the 20 μm feature and a 10% uncertainty in the continuum for other quantities.
Table 5. Properties of the Silicate Features of Class II Objects
| Object Name | W10 |  |
F10 |  |
F11.3/F9.8 |  |
W20 |  |
F20 |  |
W33 |  |
|---|---|---|---|---|---|---|---|---|---|---|---|---|
| (μm) | (μm) | ( ) ) |
 |
(μm) | (μm) | ( ) ) |
( ) ) |
(μm) | (μm) | |||
| SX Cha | 2.46 | 0.08 | 3.0E−11 | 6.6E−13 | 0.49 | 0.03 | 1.69 | 0.23 | 8.4E-12 | 6.6E-13 | 0.09 | 0.06 |
| T5 | 1.25 | 0.07 | 2.7E−12 | 1.3E−13 | 0.74 | 0.07 | 2.28 | 0.31 | 1.7E-12 | 1.3E-13 | 0.12 | 0.08 |
| 2M J10580597−7711501 | 2.86 | 0.15 | 2.4E−13 | 1.1E−14 | 0.79 | 0.05 | 4.37 | 0.37 | 2.1E-13 | 1.1E-14 | 0.70 | 0.11 |
| SZ Cha | 3.28 | 0.09 | 1.4E−11 | 2.5E−13 | 0.61 | 0.03 | 4.79 | 0.35 | 2.8E-11 | 2.5E-13 | −0.01 | 0.07 |
| TW Cha | 5.47 | 0.12 | 1.7E−11 | 1.8E−13 | 0.47 | 0.02 | 3.76 | 0.34 | 5.6E-12 | 1.8E-13 | −0.08 | 0.08 |
| CR Cha | 4.49 | 0.11 | 5.0E−11 | 6.4E−13 | 0.44 | 0.02 | 2.77 | 0.25 | 1.8E-11 | 6.4E-13 | 0.04 | 0.06 |
| CS Cha | 3.19 | 0.09 | 3.1E−12 | 6.4E−14 | 0.61 | 0.03 | 3.07 | 0.32 | 8.1E-12 | 6.4E-14 | −0.01 | 0.07 |
| CT Cha | 2.00 | 0.08 | 2.0E−11 | 5.1E−13 | 0.42 | 0.03 | 2.95 | 0.26 | 1.1E-11 | 5.1E-13 | −0.00 | 0.07 |
| ISO 52 | 2.16 | 0.08 | 1.1E−12 | 3.0E−14 | 0.55 | 0.04 | 2.51 | 0.32 | 8.0E-13 | 3.0E-14 | 0.27 | 0.08 |
| 2M J11062942−7724586 | ... | ... | ... | ... | ... | ... | ... | ... | ... | ... | ... | ... |
| CHSM 7869 | 1.39 | 0.08 | 8.4E−14 | 4.6E−15 | 0.76 | 0.06 | 2.31 | 0.38 | 4.3E-14 | 4.6E-15 | −0.14 | 0.36 |
| ISO 79 | 1.25 | 0.07 | 3.3E−13 | 1.5E−14 | 0.61 | 0.06 | 2.52 | 0.32 | 2.9E-13 | 1.5E-14 | −0.13 | 0.08 |
| Hn 5 | 2.09 | 0.08 | 6.6E−12 | 1.8E−13 | 0.66 | 0.04 | 2.71 | 0.32 | 1.7E-12 | 1.8E-13 | 0.09 | 0.10 |
| CHXR 20 | 3.63 | 0.10 | 1.1E−11 | 1.8E−13 | 0.53 | 0.03 | 3.62 | 0.34 | 3.4E-12 | 1.8E-13 | 0.04 | 0.08 |
| UY Cha | 2.95 | 0.09 | 4.0E−12 | 7.8E−14 | 0.65 | 0.04 | 2.17 | 0.30 | 9.0E-13 | 7.8E-14 | 0.40 | 0.10 |
| 2M J11065939-7530559 | 1.55 | 0.07 | 1.0E−13 | 4.0E−15 | 0.63 | 0.06 | 3.09 | 0.33 | 8.0E-14 | 4.0E-15 | 0.19 | 0.08 |
| 2M J11070369-7724307 | ... | ... | ... | ... | ... | ... | ... | ... | ... | ... | ... | ... |
| ISO 91 | 6.93 | 0.14 | 5.1E−12 | 4.4E−14 | 0.35 | 0.01 | 4.76 | 0.35 | 3.1E-12 | 4.4E-14 | 0.03 | 0.07 |
| UZ Cha | 2.15 | 0.08 | 4.3E−12 | 1.2E−13 | 0.61 | 0.04 | 3.82 | 0.35 | 2.6E-12 | 1.2E-13 | −0.14 | 0.07 |
| CHXR 22E | ... | ... | ... | ... | ... | ... | ... | ... | ... | ... | ... | ... |
| Cha Ha1 | 2.01 | 0.08 | 5.3E−13 | 1.6E−14 | 0.58 | 0.04 | 1.95 | 0.31 | 3.2E-13 | 1.6E-14 | −0.03 | 0.07 |
| T25 | ... | ... | ... | ... | ... | ... | 3.39 | 0.33 | 1.6E-12 | 2.2E-14 | 0.15 | 0.07 |
| DI Cha | 1.87 | 0.08 | 9.2E−11 | 2.7E−12 | 0.60 | 0.04 | 1.98 | 0.24 | 3.6E-11 | 2.7E-12 | 0.01 | 0.06 |
| VV Cha | 2.29 | 0.08 | 5.0E−12 | 1.2E−13 | 0.45 | 0.03 | 2.05 | 0.31 | 1.6E-12 | 1.2E-13 | 0.06 | 0.08 |
| Cha Ha2 | 1.08 | 0.25 | 8.4E−13 | 1.9E−13 | 0.72 | 0.31 | 1.83 | 0.51 | 3.5E-13 | 1.9E-13 | 0.16 | 0.26 |
| T28 | 2.07 | 0.08 | 1.6E−11 | 4.2E−13 | 0.51 | 0.04 | 1.56 | 0.29 | 4.2E-12 | 4.2E-13 | 0.25 | 0.08 |
| CHSM 10862 | ... | ... | ... | ... | ... | ... | 1.68 | 0.30 | 1.1E-13 | 1.1E-14 | 0.14 | 0.10 |
| CHXR 30B | 2.88 | 0.09 | 1.4E−11 | 2.9E−13 | 0.61 | 0.03 | 3.29 | 0.32 | 6.5E-12 | 2.9E-13 | 0.23 | 0.08 |
| T29 | 1.74 | 0.07 | 1.6E−10 | 5.0E−12 | 0.49 | 0.04 | 2.41 | 0.24 | 9.7E-11 | 5.0E-12 | −0.01 | 0.06 |
| CHXR 30A | 2.25 | 0.08 | 4.7E−12 | 1.2E−13 | 0.40 | 0.03 | 2.19 | 0.30 | 1.5E-12 | 1.2E-13 | 0.04 | 0.07 |
| VW Cha | 2.42 | 0.08 | 5.6E−11 | 1.3E−12 | 0.60 | 0.04 | 2.45 | 0.31 | 2.5E-11 | 1.3E-12 | 0.16 | 0.07 |
| CU Cha | ... | ... | ... | ... | ... | ... | ... | ... | ... | ... | ... | ... |
| T33A | 5.25 | 0.12 | 6.7E−10 | 7.1E−12 | 0.44 | 0.02 | 3.79 | 0.27 | 2.3E-10 | 7.1E-12 | −0.00 | 0.06 |
| ISO 138 | ... | ... | ... | ... | ... | ... | ... | ... | ... | ... | ... | ... |
| ISO 143 | 1.69 | 0.07 | 1.2E−12 | 3.9E−14 | 0.63 | 0.05 | 1.02 | 0.28 | 2.1E-13 | 3.9E-14 | 0.08 | 0.09 |
| T35 | ... | ... | ... | ... | ... | ... | 5.87 | 0.39 | 2.5E-12 | 6.8E-14 | 0.74 | 0.09 |
| VY Cha | 2.61 | 0.09 | 6.7E−12 | 1.4E−13 | 0.53 | 0.03 | 3.49 | 0.33 | 3.7E-12 | 1.4E-13 | 0.20 | 0.08 |
| C1-6 | 1.83 | 0.08 | 7.3E−11 | 2.2E−12 | 0.63 | 0.05 | 1.87 | 0.24 | 3.2E-11 | 2.2E-12 | 0.02 | 0.06 |
| VZ Cha | 1.26 | 0.07 | 1.1E−11 | 4.9E−13 | 0.57 | 0.05 | 1.23 | 0.28 | 3.0E-12 | 4.9E-13 | −0.03 | 0.07 |
| C7-1 | 0.95 | 0.07 | 5.0E−13 | 2.8E−14 | 0.53 | 0.08 | 4.97 | 0.37 | 4.7E-13 | 2.8E-14 | 0.01 | 0.07 |
| Hn 10E | 3.20 | 0.09 | 8.3E−12 | 1.5E−13 | 0.39 | 0.02 | 1.43 | 0.28 | 3.0E-12 | 1.5E-13 | −0.13 | 0.07 |
| B43 | 7.19 | 0.14 | 7.6E−12 | 6.2E−14 | 0.48 | 0.02 | 3.18 | 0.32 | 2.4E-12 | 6.2E-14 | 0.11 | 0.07 |
| HD 97300 | ... | ... | ... | ... | ... | ... | ... | ... | ... | ... | ... | ... |
| ISO 220 | 1.35 | 0.07 | 2.9E−13 | 1.3E−14 | 0.62 | 0.06 | 1.28 | 0.31 | 9.0E-14 | 1.3E-14 | 0.21 | 0.14 |
| T42 | 1.22 | 0.07 | 1.8E−10 | 8.0E−12 | 0.81 | 0.08 | 2.38 | 0.24 | 1.9E-10 | 8.0E-12 | −0.02 | 0.06 |
| T43 | 2.00 | 0.08 | 9.0E−12 | 2.5E−13 | 0.45 | 0.03 | 1.78 | 0.29 | 3.1E-12 | 2.5E-13 | 0.08 | 0.07 |
| WX Cha | 2.49 | 0.08 | 2.9E−11 | 6.5E−13 | 0.60 | 0.04 | 1.89 | 0.29 | 5.9E-12 | 6.5E-13 | −0.07 | 0.07 |
| WW Cha | 4.03 | 0.10 | 4.9E−10 | 6.7E−12 | 0.45 | 0.02 | 3.63 | 0.26 | 2.8E-10 | 6.7E-12 | −0.04 | 0.06 |
| Hn 11 | 2.60 | 0.08 | 2.2E−11 | 4.5E−13 | 0.54 | 0.03 | 3.39 | 0.33 | 7.8E-12 | 4.5E-13 | 0.20 | 0.08 |
| T45a | 1.35 | 0.07 | 2.3E−12 | 9.4E−14 | 0.69 | 0.07 | 3.63 | 0.33 | 2.7E-12 | 9.4E-14 | 0.10 | 0.08 |
| WY Cha | 1.61 | 0.07 | 1.3E−11 | 4.4E−13 | 0.62 | 0.05 | 2.47 | 0.31 | 4.4E-12 | 4.4E-13 | 0.14 | 0.07 |
| ISO 235 | 1.52 | 0.07 | 1.3E−12 | 4.5E−14 | 0.45 | 0.04 | 2.02 | 0.31 | 3.2E-13 | 4.5E-14 | −0.00 | 0.08 |
| ISO 237 | 3.48 | 0.10 | 2.2E−11 | 3.6E−13 | 0.44 | 0.02 | 2.01 | 0.30 | 9.7E-12 | 3.6E-13 | −0.06 | 0.07 |
| CHXR 47 | 2.18 | 0.08 | 1.4E−11 | 3.5E−13 | 0.63 | 0.04 | 2.82 | 0.32 | 5.5E-12 | 3.5E-13 | 0.16 | 0.08 |
| ISO 252 | 1.38 | 0.07 | 3.8E−13 | 1.5E−14 | 0.59 | 0.06 | 1.78 | 0.31 | 1.3E-13 | 1.5E-14 | 0.06 | 0.10 |
| T47 | 2.16 | 0.08 | 1.5E−11 | 3.8E−13 | 0.40 | 0.03 | 1.51 | 0.29 | 5.2E-12 | 3.8E-13 | −0.00 | 0.07 |
| WZ Cha | 1.88 | 0.08 | 3.9E−12 | 1.2E−13 | 0.49 | 0.04 | 1.57 | 0.29 | 1.1E-12 | 1.2E-13 | 0.00 | 0.08 |
| ISO 256 | 3.30 | 0.09 | 6.1E−12 | 1.0E−13 | 0.40 | 0.02 | 3.31 | 0.33 | 2.0E-12 | 1.0E-13 | 0.03 | 0.07 |
| Hn 13 | 1.25 | 0.07 | 1.5E−12 | 6.9E−14 | 0.79 | 0.08 | 3.84 | 0.35 | 1.4E-12 | 6.9E-14 | 0.25 | 0.08 |
| XX Cha | 1.68 | 0.07 | 6.8E−12 | 2.2E−13 | 0.59 | 0.05 | 2.57 | 0.32 | 3.9E-12 | 2.2E-13 | 0.13 | 0.07 |
| ISO 282 | 1.75 | 0.08 | 5.3E−13 | 1.9E−14 | 0.69 | 0.05 | 2.92 | 0.34 | 2.1E-13 | 1.9E-14 | 0.14 | 0.09 |
| T50 | 1.95 | 0.08 | 1.8E−12 | 6.1E−14 | 0.68 | 0.06 | 3.73 | 0.34 | 1.2E-12 | 6.1E-14 | 0.55 | 0.11 |
| T51 | 3.95 | 0.10 | 4.5E−11 | 6.1E−13 | 0.65 | 0.03 | 3.21 | 0.32 | 7.9E-12 | 6.1E-13 | 0.21 | 0.08 |
| CV Cha | 5.57 | 0.12 | 1.6E−10 | 1.6E−12 | 0.49 | 0.02 | 3.38 | 0.26 | 4.7E-11 | 1.6E-12 | 0.20 | 0.07 |
| T54 | ... | ... | ... | ... | ... | ... | ... | ... | ... | ... | ... | ... |
| Hn 21W | 1.15 | 0.07 | 5.6E−13 | 2.7E−14 | 0.77 | 0.08 | 1.96 | 0.30 | 2.6E-13 | 2.7E-14 | 0.35 | 0.10 |
| T56 | 7.10 | 0.14 | 7.9E−12 | 7.3E−14 | 0.50 | 0.02 | 6.80 | 0.40 | 4.0E-12 | 7.3E-14 | 0.24 | 0.08 |
| 2M J11241186−7630425 | 4.84 | 0.11 | 3.6E−13 | 5.1E−15 | 0.48 | 0.02 | 4.58 | 0.35 | 3.5E-13 | 5.1E-15 | 0.13 | 0.07 |
Note. Values are not listed for objects for which a satisfactory continuum fit could not be obtained.
Figure 23 shows a plot between equivalent width of the 10 μm silicate feature, W10, against the continuum index n13–31 for the Class II objects in Cha I. Also shown in the figure, marked as the black polygon, is the region defined by the models in the W10–n13–31 plane, for irradiated, accretion disk models for a range of values of accretion rates, stellar masses, inclination angles, and settling parameter (Espaillat 2009; Furlan et al. 2009). It can be seen from the figure that most of the Class II objects fall within the region predicted by the models. Not surprisingly, objects identified as having altered radial disk structures—the outwardly truncated disks and TDs and PTDs—fall outside the polygon. Only four out of the eight TDs and PTDs, SZ Cha, CS Cha, T56, and 2M J11241186−7630425, show the 10 μm silicate features in emission and only they are shown here (see Figure 18). The silicate emission in these disks is generated either by the optically thin dust grains within the inner holes/gaps or at the atmosphere of the inner "wall" of the outer optically thick disk (Calvet et al. 2005; Espaillat et al. 2008; Kim et al. 2009). TDs and PTDs in general show relatively high values of W10 and n13–31, i.e., they are outliers in W10 and/or n13–31 as can be seen from Figure 23 (see also Furlan et al. 2009). Six objects, TW Cha, ISO 91, CR Cha, T33A, B43, and CV Cha (gray solid circles in Figure 23), show enhanced 10 μm silicate emission. They have W10 values greater than the upper octile of the W10 distribution (dashed line in Figure 23) of all the Class II objects. Their W10 values are significantly higher than those predicted by the models for typical disks; however, they have n13–31 values within the range allowed by the models.
Figure 23. Equivalent width of the 10 μm silicate feature, W10, plotted against the continuum spectral index n13–31 for the Class II objects in Cha I. TDs and PTDs are shown as solid black star symbols and outwardly truncated disks are shown as solid black circles. The dotted lines represent the median in W10 and n13–31 values and the dashed line the upper octile of W10 distribution. The solid gray circles represents objects with enhanced 10 μm silicate emission (W10 ≳ W ). The polygon defines the region in the W10–n13–31 plane, allowed by the irradiated, accretion disk models for typical range of accretion rates, stellar masses, inclination angles and settling parameters (see the text). Typical errors are shown on the top-right corner (see Table 5).
Download figure:
Standard image High-resolution imageFigure 24 compares the W10 values of Class II objects in Cha I with the integrated flux of the 10 μm feature F10. The equivalent width of the silicate feature is a measure of the amount of the optically thin dust per unit projected area of the optically thick disk, whereas the integrated flux of the silicate feature is a measure of the amount of optically thin dust. Both W10 and F10 are measures of the strength of the 10 μm feature, but W10 expresses it in the units of the underlying continuum. For radially continuous "full" disks both the equivalent width W10 and the integrated flux F10 track each other well as shown in Figure 24. TDs and PTDs show moderate to low values of F10 indicating that the amount of optically thin dust contributing to the 10 μm emission is relatively small and yet they show large W10 values. TDs and PTDs have holes/gaps in their disks which lower the continuum emission thereby increasing their W10. The objects identified as having enhanced 10 μm emission (solid gray circles in Figure 24) have F10 values similar to other Class II objects in the sample, but show significantly high W10 values. The large W10 values of these objects are likely caused by the reduced continuum emission in these objects. Most of the continuum emission underlying the 10 μm feature comes from ≲1–2 AU of the disks (D'Alessio et al. 2006). One possible explanation is that these disks are opening up gaps in the inner regions (≲1–2 AU) of their optically thick disks, which will lower their continuum emission. If the gaps are sufficiently small (a few AU), one will not be able to distinguish these objects from the "full" disks purely based on the mid-IR continuum; however, they will stand out as outliers in W10 (Espaillat 2009; Furlan et al. 2009). Such objects which are possibly opening gaps within them have also been identified in the Taurus and Ophiuchus star-forming regions as outliers in W10 (Furlan et al. 2009). However, detailed modeling of the SEDs and high-resolution imaging are required before the disk structure of these objects can be confirmed.

Figure 24. Integrated flux of the 10 μm silicate feature F10 plotted against the equivalent width W10. The symbols have same meaning as in Figure 23. Typical errors are shown on the top-right corner (see Table 5).
Download figure:
Standard image High-resolution imageIn Figure 25, we plot the equivalent width of the 20 μm feature, W20 against the continuum index n13–31. Most TDs and PTDs show large W20 values. The holes/gaps in them are sufficiently large to lower the continuum emission underlying both the 10 and 20 μm silicate emission features. The objects with W10 ≳ W (gray solid circles) do not have such high W20; their W20 values, though higher than the median, are similar to those of many other Class II disks in the sample. This is consistent with the supposition that gaps in these disks are small and are at smaller disk radii so that the continuum emission underneath the 20 μm feature in these disks is not significantly lowered so as to enhance W20.
Figure 25. Equivalent width of 20 μm silicate feature W20 plotted against the continuum index n13–31. The symbols have same meaning as in Figure 23. Typical errors are shown on the top-right corner (see Table 5).
Download figure:
Standard image High-resolution imageLeaving aside the TDs/PTDs and the objects with enhanced W10, Figure 23 shows that, in general, the equivalent width of the 10 μm feature, W10, increases with increasing value of n13–31 index for "full" disks. A similar positive correlation is also found between W20 and the n13–31 index as shown in Figure 25. The linear (Pearson) correlation coefficient for these relations is r = 0.3 and the probability that a randomly drawn sample of the same size could show such a correlation is P ≲ 5%, indicating that the correlations are marginally significant. Such correlations between the strengths of the silicate features and the disk geometry are expected for radially continuous "full disks" from the disk models: when n13–31 increases (less dust settling in the disk) degree of flaring of the disk increases and the location of the silicate emission moves farther out in the disk resulting in a larger emitting area; thus, the amount optically thin emission from the warm grains in the disk surface layers will increase. However, when the degree of flaring increases, the height of the irradiation surface also increases, which increases the amount of heating of the disk interior and as a result the continuum level goes up. The net effect appears to be an overall increase in the equivalent width of the silicate feature and the model predictions agree with such an increase (see D'Alessio et al. 2006; Furlan et al. 2009). We note here that the spread in stellar masses, accretion rates, and inclination angles of the objects in our sample would act to weaken the trend between equivalent widths of silicate features and n13–31. Despite this, marginally significant correlation could be found between the strength of the silicate emission and the underlying disk structure; this makes the case for it even stronger.
Next we look at how the changes in the disk structure affect the strength of the 20 μm silicate feature relative to that of the 10 μm feature. In Figure 26, we plot the ratio of the integrated flux of the 20 μm silicate emission to that of 10 μm emission as a function of the n13–31 index. We find a tight correlation between the F20/F10 ratio and the n13–31 index for the "full disks." The Pearson correlation coefficient is r = 0.6 and the corresponding probability is P ≪ 0.05% indicating that the correlation is highly significant. The correlation between the integrated flux ratio F20/F10 and the continuum index n13–31 is much tighter than the correlations that we find between W10 and W20 with n13–31. This indicates that even though both the 10 and the 20 μm feature strength decrease with increasing degree of dust sedimentation in the disk, the strength of the 20 μm silicate emission feature drops faster relative to the 10 μm feature. This is because the 20 μm emission arises from larger disk radii compared with the 10 μm emitting region. As the disks become less flared because of sedimentation, the optically thin emitting area decreases; however, the reduction in the emitting area at larger disk radii is more than the reduction in the emitting area closer to the star and therefore the 20 μm emission is affected more than the 10 μm emission (see D'Alessio et al. 2006; Espaillat 2009).

Figure 26. Ratio of the integrated flux of 20 μm silicate feature to that of the 10 μm silicate feature F20/F10 vs. the continuum index n13–31. The symbols have same meaning as in Figure 23. Typical errors are shown on the top-left corner (see Table 5).
Download figure:
Standard image High-resolution imageTDs and PTDs separate out from the "full" disks in F20/F10–n13–31 plane. This is not surprising as these disks have different radial structures and both the mid-IR continuum and the silicate emission arise in different parts of the disks as compared to "full" disks. The objects identified as having high W10 (gray solid circles) do not follow the trend seen between F20/F10 and n13–31 for "full" disks. They show smaller F20/F10 ratio than that for objects with similar n13–31 values. This is suggestive of their disk structure being different from that of radially continuous "full" disks.
4.2.2. Silicate Emission and Dust Processing in Disks
We further analyzed the silicate features in the mid-IR spectra of Class II objects in Cha I to study the amount of dust processing in protoplanetary disks. Figure 27 shows a plot of the flux ratio F11.3/F9.8 versus the equivalent width of the 10 μm silicate feature, W10. The flux ratio F11.3/F9.8 has long been considered as a measure of the degree of dust processing (grain growth and crystallization) in the inner 1–2 AU of the disk (van Boekel et al. 2005; Kessler-Silacci et al. 2006; Honda et al. 2006; Olofsson et al. 2009). The larger values of the F11.3/F9.8 ratio indicates the presence of highly processed grains and the smaller values imply relatively unprocessed grains. The flux densities F9.8 and F11.3 are computed from the IRS spectra by integrating the flux densities within an interval of 0.4 μm centered at 11.3 and 9.8 μm, respectively. The F11.3/F9.8 values are listed in Table 5. One of the TD/PTD objects, SZ Cha, is not shown in Figure 27 because it has strong PAH emission at 11.3 μm which makes reliable estimate of the F11.3/F9.8 difficult. We also show TDs and PTDs in the Taurus region (open star symbols) in Figure 27 for comparison. The "full" disks (open circles) show a strong negative correlation between the dust processing indicator F11.3/F9.8 and W10. The Pearson coefficient for the correlation is r = −0.5 with a corresponding probability P ≲ 0.05%, indicating a highly significant correlation. Objects with low W10 values show evidence for highly processed dust grains and objects with high W10 values show relatively unprocessed grains.

Figure 27. F11.3/F9.8 plotted against the equivalent width of the 10 μm silicate feature W10. The open star symbols represent TDs and PTDs in Tau–Aur region. The other symbols have same meaning as in Figure 23. SZ Cha is not shown here as it has a strong PAH feature at 11.3 μm and a reliable estimate of F11.3/F9.8 could not be obtained. Typical errors are shown on the top-right corner (see Table 5).
Download figure:
Standard image High-resolution imageIn the last section, we showed that in "full" disks W10 is a measure of the amount of the optically thin dust responsible for the 10 μm silicate emission, and less settled disks (higher degree of flaring), in general, have high W10. The correlation that we find between F11.3/F9.8 and W10 also suggests that more settled disks show higher degree of dust processing (grain growth and crystallization).
The TDs and PTDs in both Cha I and Taurus have relatively low values of F11.3/F9.8, indicating that the dust grains contributing to the 10 μm emission in them are relatively unprocessed. Interestingly, the objects identified as having enhanced 10 μm emission (solid gray symbols) also show low F11.3/F9.8 values, indicating that the optically thin dust in them is relatively unprocessed. The high W10 values and the pristine dust composition that these objects show is quite similar to that exhibited by PTDs in Taurus and Cha I (Watson et al. 2009; Kim et al. 2009; Sargent et al. 2009) and very different from that shown by "full" disks. This suggests that as in PTDs, the 10 μm silicate emission in these disks is likely generated by optically thin dust within the gaps in the disks. A more detailed discussion on the pristine dust composition of these disks will be presented in a forthcoming paper (P. Manoj et al. 2011, in preparation).
As pointed out earlier, both grain growth and crystallization in the inner disk (≲1–2 AU) affect the F11.3/F9.8 ratio. In order to disentangle the effect of crystallization from that of the grain growth, we make use of the isolated forsterite feature at 33.6 μm, which is an independent measure of the degree of crystallinity and, in addition, probes the crystalline content of the cooler dust farther out (≲10 AU) in the disk (Olofsson et al. 2009; Sargent et al. 2009). We compute the equivalent width of the 33.6 μm feature, W33, from Equation (2) by integrating the flux between λ1 = 32 μm and λ2 = 35 μm (Watson et al. 2009; McClure et al. 2010); the W33 values are listed in Table 5. Figure 28 shows W33 plotted against F11.3/F9.8 for Class II objects in Cha I. W33 and F11.3/F9.8 appear to be tightly correlated; a linear (Pearson) coefficient of r = 0.4 and an associated probability of ≪1% indicate that the correlation is highly significant. The higher the degree of dust processing (grain growth and crystallization) is in the inner disk, the higher the crystalline content of the outer disk will be. F11.3/F9.8 and W33 have also been found to be correlated for Class II disks in other star-forming regions. In Figure 29, we show W33 plotted against F11.3/F9.8 for low-mass Class II objects in Taurus. These quantities were computed from the IRS spectra of Class II objects in Taurus presented in Furlan et al. (2006) and Watson et al. (2009). Again we find a tight correlation between F11.3/F9.8 and W33 with a (Pearson) correlation coefficient r = 0.5 and an associated probability of ≪1%. Similar result has also been found for Class II disks in Ophiuchus (McClure et al. 2010).
Figure 28. F11.3/F9.8 plotted against the equivalent width of the 33 μm silicate feature W33 for Class II disks in Cha I. The other symbols have the same meaning as in Figure 23. SZ Cha is not shown here as it has a strong PAH feature at 11.3 μm and a reliable estimate of F11.3/F9.8 could not be obtained. Typical errors are shown on the top-left corner (see Table 5).
Download figure:
Standard image High-resolution image
Figure 29. F11.3/F9.8 plotted against W33 for Class II disks in Taurus. The solid star symbols represent TDs and PTDs. Typical errors are shown on the top-left corner (see Table 5).
Download figure:
Standard image High-resolution imageAlthough both grain growth and crystallization in the inner disk can affect the F11.3/F9.8 ratio, the correlation that we find is more likely due to the crystalline content in the outer and inner regions of the disks tracking each other (see Watson et al. 2009). Since the crystalline grains are generally thought to be formed in the inner (≲1 AU) disks, where the temperature required for crystallization can be reached (≳1000 K; Grossman 1972; Gail 2001; Wooden et al. 2005), higher crystalline content of the outer disk should indicate that the crystalline grains are also present in the inner disk. The above results suggest that an increase in the inner disk crystallinity is accompanied by a similar increase in the outer disk crystallinity in protoplanetary disks surrounding low mass stars (Watson et al. 2009; McClure et al. 2010). If the crystalline grains are produced only close to the central star, then the correlation that we find between the inner and the outer disk crystallinity should suggest efficient radial mixing of the dust in the disk at least up to a radius of ≲10 AU. If, on the other hand, the crystalline grains are produced in situ in the outer parts (≲10 AU) of the disks (Harker & Desch 2002; Wooden et al. 2005), then both the inner and the outer disk crystallization mechanisms must operate on similar timescales.
The changes in the F11.3/F9.8 ratio have at times been interpreted as almost entirely due to grain growth in the inner disk (e.g., Przygodda et al. 2003; Honda et al. 2006; Kessler-Silacci et al. 2006). However, the correlation that we find between F11.3/F9.8 and W33 would suggest that F11.3/F9.8 is as good or a better indicator for the crystalline content of the inner disk as it is for grain growth (Watson et al. 2009; Sargent et al. 2009). Since changes in the grain size affect the F11.3/F9.8 ratio, our results also imply that the grain growth and crystallization in the inner disk must occur concurrently, on similar timescales (e.g., Apai et al. 2005). Detailed dust composition analysis of the IRS spectra of T Tauri stars in various star-forming regions has shown that both large (≳1 μm) and crystalline grains are present in most protoplanetary disks (e.g., Sargent et al. 2009).
4.3. Median SED of Class II Objects
We constructed median SEDs for the Class II objects in Cha I from 0.9 μm to 36 μm using I, J, H, and Ks photometry and IRS spectra in order to study the average disk properties. Two separate medians were computed for objects belonging to the spectral type bins of K5–M2 and M3–M8 to compare the emission from protoplanetary disks with different central star properties. The median was computed for 25 objects with spectral types between K5 to M2 and for 29 objects between M3 to M8. Objects which have only upper limits in I, J, H, and Ks measurements were excluded from the median. The medians for each of these bins were obtained by first normalizing the dereddened flux densities at I, H, and Ks and IRS spectrum of each object to the dereddened J-band flux of that object, and then computing the median at I, J, H, and Ks and the IRS wavelengths. We also obtained the quartiles for the medians: the upper and lower quartiles define the range above and below the median within which 50% of the flux values lie. The median SEDs for the Class II objects in the spectral bins of K5–M2 and M3–M8, along with the quartiles are presented in Figure 30. The gray shaded regions in the figure are bound by the lower and upper quartiles of the medians. The photospheres plotted in the figure are that for a K7 star for the K5–M2 median and that for a M5 star for the M3–M8 median, both computed from the photospheric colors listed in Kenyon & Hartmann (1995) and normalized to the J-band flux.

Figure 30. Median SEDs of Class II objects in the spectral type range of K5–M2 (top panel) and M3–M8 (bottom panel). The gray shaded regions are bound by the lower and upper quartiles of the median in both the panels. Synthetic SEDs generated from accretion disk models for a 0.5 M☉ star (top panel) for accretion rates of 10−7(blue), 10−8 (red), and 10−9 (green) M☉yr−1 and for depletion factors = 0.001 (solid line), = 0.01 (dashed line), and = 0.1 (dotted line) are overplotted on the K5–M2 median. SEDs generated from accretion disk models for a 0.2 M☉ star (bottom panel) for accretion rates of 10−8 (red), 10−9 (green), and 10−10 (cyan) M☉yr−1 and for depletion factors = 0.001 (solid line), = 0.01 (dashed line), and = 0.1 (dotted line) are shown for the M3-M8 median. The models shown are for an inclination angle of i = 60°. The photospheres plotted (solid black line) are for a K7 star (K5–M2; top panel) and for an M5 star (M3–M8; bottom panel). The photospheres are from Kenyon & Hartmann (1995) and are normalized at J band.
Download figure:
Standard image High-resolution imageThe median SEDs computed for the T Tauri stars (K5–M2) and very low mass stars and brown dwarfs (M3–M8) clearly show mid-IR excess emission and 10 and 20 μm silicate emission features. The mid-IR continuum spectral indices, n6–13 and n13–31, of both the medians are very similar: n6–13 = −0.9 for both K5–M2 and M3–M8 medians and n13–31 = −0.26 for K5–M2 and −0.28 for M3–M8 median. However, the nature of excess emission below 8 μm is very different for these two medians; the excess emission in K5–M2 median begins at ∼2 μm whereas for the M3–M8 median significant excess starts to show up only at 4–5 μm. This is because the ratio of the disk emission to the stellar photospheric emission scales as T3⋆, and for cooler stars (M3 or later) it is difficult to see the disk excess above photospheric emission at λ ≲ 6 μm (Ercolano et al. 2009). In addition, we also find the continuum slope at wavelengths ≲8 μm for M3–M8 median is much steeper (bluer) than that for the K5–M2 median: K5–M2 median has the continuum index n2–6 = −1.42 while M3–M8 median has n2–6 = −1.74.
It is important to recognize that very low mass stars and brown dwarfs on average have fainter and steeper SEDs at wavelengths ≲8 μm, especially when identifying TD and PTD candidates. They are identified by virtue of the flux deficit and steeper slope that they show at wavelengths ≲8 μm compared to the median Class II SED. A very low mass object or a brown dwarf with normal disk could easily be misidentified as a TD or PTD candidate if compared to a T Tauri (K5–M2) median (see Ercolano et al. 2009).
The effect of dust sedimentation in protoplanetary disks is best seen in the SED at wavelengths ≳13 μm (D'Alessio et al. 2006; Furlan et al. 2006; Watson et al. 2009). To demonstrate this, in Figure 30 where the median SED of K5–M2 Class II objects in Cha I is presented (top panel), we also show synthetic SEDs generated from the accretion disk models for a 0.5 M☉ star with accretion rates of 10−7, 10−8, and 10−9 M☉yr−1 and the settling parameter of 0.001, 0.01, and 0.1. It can be seen that the median SED longward of 13 μm is best described by disk models with settling parameter = 0.01 and 0.001 for accretion rates of 10−7 and 10−8 M☉ yr−1; even for an accretion rate of 10−9 M☉ yr−1, most disks have ≲ 0.1. The median and the quartiles suggest significant dust settling in the Class II disks in Cha I: small grains in the upper layers of more than 75% of the disks have been depleted by a factor of at least 10; about 50% of the disks have depletion factor ≳100.
In Figure 30 (bottom panel), we show the synthetic SEDs generated from the accretion disk models for a 0.2 M☉ star with accretion rates of 10−8, 10−9, and 10−10 M☉yr−1 and the settling parameter of 0.001, 0.01, and 0.1. The observed median and the quartiles at wavelengths ≳13 μm, where the dust sedimentation effects are seen, are best explained by disk models with settling parameter values of = 0.01 and 0.001 for the above accretion rates indicating significant dust depletion in the upper layers of these disks. Both the K5–M2 stars and the low-mass objects with spectral types M3–M8 seem to have dust depletion factors of 100–1000 in their upper layers, similar to what was found for Taurus (Furlan et al. 2006).
However, the match between the model predictions and the median SEDs is not satisfactory at shorter wavelengths. The accretion disk models for the 0.5 M☉ significantly underpredicts the observed flux of the K5–M2 median at wavelengths ≲8 μm. Also, the upper quartile of the M3–M8 median at wavelengths ≲13 μm cannot be explained by the 0.2 M☉ models even for an accretion rate 10−8 M☉yr−1. These discrepancies between the models and the observed medians and the possible reasons for them are discussed in detail by Espaillat (2009). Here we only discuss behavior of the median at wavelengths ≳13 μm which is relevant for the dust sedimentation effects.
5. MULTIPLICITY AND DISK STRUCTURE
In this section, we discuss the effect of multiplicity on the structure and dust properties of the Class II disks in Cha I. Close companions can gravitationally perturb and truncate the disks around individual components (Lubow & Artymowicz 2000). For orbital separations of ∼200 AU, companions truncate the disk from outside (for typical disk sizes of ∼100 AU); for even smaller orbital separations (≲a few tens of AU) the disk could be truncated from inside as in the case of CoKu Tau/4 (Ireland & Kraus 2008). An outwardly truncated disk is likely to show a steeper mid-IR continuum slope, i.e., n13–31 less than that for a flat disk (McClure et al. 2008). Similarly, disks truncated from inside will have significantly steeper n6–13 continuum index. There have also been suggestions that close companions could affect the dust properties in protoplanetary disks (Meeus et al. 2003; Sterzik et al. 2004).
We compared the observed disk properties of the objects in multiple systems to those in single systems in order to study the effect of companions on the disk structure. Figure 31 compares the distribution of continuum indices of close (<1'' ∼ 165 AU) binaries and wide (⩾1'') binaries among Class II objects with those with no known companions. A two-sided K-S test shows that the distributions of the n2–6 and n13–31 indices for the subarcsecond binaries are similar to those for the wide binaries and single stars. However, the n6–13 distribution for the subarcsecond binaries appears to be different from that for the wide binaries and single stars at a significance level of 97%. The n6–13 distribution for the subarcsecond binaries peaks at bluer value than that for other objects. We also compared the silicate feature properties, W10 and W20, and dust processing indicators, F11.3/F9.8 and W33, of the subarcsecond binary systems with those of other Class II objects. The silicate feature properties and the dust processing indicators of objects with close (<1'') companions are statistically similar to those of wide binaries and single stars. These results suggest that the disk properties are only weakly affected by the presence of companions. The multiple systems in our sample have companions with projected separations ≳20 AU (see Table 3), and the above results hold for such systems. However, only 12 out of the 68 Class II objects in our sample are known to have subarcsecond companions. The small number makes the statistical comparison less certain. In addition, the multiplicity census of the Cha I sample is likely to be incomplete, as it is harder to rule out extremely close (≪1'') companions. Therefore, we are not able to draw any definite conclusions on the effect of multiplicity on the disk structure from the comparison based on our sample. Below we discuss the disk properties of Class II objects which show clear evidence for disk truncation and examine if close companions are responsible for it.
Figure 31. Distribution of the continuum indices for close (<1'') and wide (⩾1'') binaries and single stars among the Class II objects in Cha I.
Download figure:
Standard image High-resolution imageWe first examine the multiplicity of TDs and PTDs which have holes/gaps within their disks. The SED of a close (separation ∼a few AU) binary system with a circumbinary disk can appear TD-like, as has been shown in the case of CoKu Tau/4 (Ireland & Kraus 2008). However, only two of the TDs/PTDs in Cha I, namely, CS Cha and T54 are known to have close stellar companions (see Table 3). T54 has a 026 companion (∼43 AU at 165 pc) and the disk around it could be truncated from inside by the gravitational influence of the close companion; the mid-IR excess that we observe could be from the circumbinary disks surrounding these systems. On the other hand, CS Cha, which has an estimated inner hole of 43 AU in radius (Espaillat et al. 2007b; Kim et al. 2009), is a spectroscopic binary (Guenther et al. 2007). It is not clear, though, if such a close companion can carve out the hole of this size in the disk (see Kim et al. 2009; Furlan et al. 2009). CHXR 22E, T25, T35, and T56 do not have known companions around them: companions up to 5, 12, 12, and 15 times as faint as the primary in the Ks band have been ruled out for separations ≳01 (∼17 AU) for CHXR 22E, T25, T35, and T56, respectively (Lafrenière et al. 2008). Further, the companions reported in the literature for SZ Cha are not confirmed members of the Cha I association (Luhman 2007). Comparative studies of various mechanisms that could possibly create holes or gaps in disks have shown that most of the observed characteristics of a large sample of TDs/PTDs from various star-forming regions are best explained by Jovian mass planets opening up gaps and holes in the disks (Kim et al. 2009; Najita et al. 2007; Rice et al. 2003; Calvet et al. 2005; Espaillat et al. 2007a).
Next, we discuss objects which show clear evidence for disk truncation, i.e, continuum indices bluer than that for an optically thick, flat disk, to see if known companions are responsible for disk truncation. Among the Class II disks in our sample, nine show n6–13< −1.33, steeper than that for an optically thick, flat disk. Five of them are TDs, only two of which, CS Cha and T54, are subarcsecond binaries as discussed above. Among the remaining four objects, 2M J11062942−7724586, CHXR 30A, C7-1, and ISO 282, only CHXR 30A is known to have a close (∼046) companion which could be responsible for the disk truncation. Two class II objects, T51 and Hn 5, show n13–31 < −1.33, indicating that they have outwardly truncated disks; no subarcsecond companions have been reported for these two objects (see Section 4.1) (see Furlan et al. 2009). Thus, there is evidence that disk truncation is caused by a close companion in a few objects; however, no subarcsecond companions are known for most objects with truncated disks. While undetected companions at small separations (≪1'') could still be responsible for disk truncation in these objects, available multiplicity data for Class II objects in Cha I do not clearly demonstrate that close (projected separation ≳20 AU) companions affect disk structure. Similar results have also been found for Class II disks in Taurus, where no statistically significant differences were found in the structure and dust properties of disks in single and multiple systems (Pascucci et al. 2008).
6. ACCRETION AND DISK STRUCTURE
In Section 3, we classified the Class II objects in Cha I into WTTS and CTTS using the Hα emission strength as an accretion indicator (see Table 2). WTTS are young T Tauri stars that have little if any accretion and probably have dissipated their inner disk, unlike CTTS that are actively accreting from the disk. Here, we compare the mid-IR emission of the WTTS and CTTS in our sample as revealed by their IRS spectra. There are 48 CTTS and 15 WTTS in our Cha I sample: two of the WTTS are Class III objects and two are TDs.
All of the WTTS in our sample except the Class III objects show mid-IR (≳6 μm) excess emission as can be seen from their SEDs (Figure 5). All of them except the two TDs, CHXR 22E and T25, and CHSM 10862, also show both 10 and 20 μm silicate feature in emission. The mid-IR excess and the silicate features seen in the IRS spectra of the WTTS indicate that they still have dusty disks around them. However, most WTTS show low or no near-IR (≲6 μm) excess emission (Figure 5). In Figure 32, we compare the distribution of spectral indices n2–6, n6–13, and n13–31 for WTTS and CTTS. The distribution of all three continuum indices for the WTTS is shifted to more negative values compared to those for the CTTS, indicating that the WTTS have steeper continuum slope of the SED in the infrared wavelengths. As can be seen from Figure 32, this effect is more conspicuous at shorter wavelengths, in the n2–6 index than in the other two indices. A two-sided K-S test shows that the distribution of the n2–6 index of CTTS and WTTS is statistically different at 99.99% significance level.
Figure 32. Frequency distribution of the spectral indices n2–6 (a), n6–13 (b), and n13–31 (c) for the CTTS (top panel) and WTTS (bottom panel) in our sample. The solid histogram represents TDs and PTDs among CTTS and WTTS.
Download figure:
Standard image High-resolution imageMost TDs and PTDs in Cha I, except CHXR 22E and T25, could be classified as CTTS based on the strength of their Hα emission (see Table 2). T54, for which Hα measurement is not available in the literature, has been reported to be accreting at a relatively high rate based on its U-band flux (Kim et al. 2009). Thus, most TDs/PTDs in Cha I are active accretors. All the objects identified as having enhanced 10 μm emission (W10 ≳W ; see Figure 23), except T33A, are CTTS based on their Hα equivalent widths indicating that they are actively accreting from their disks. T33A is a close binary and the IRS spectra has contribution from both the components. The interpretation of W10 and the continuum index in this system are inconclusive. Thus, most objects in Cha I which show evidence for holes or gaps in their disks appear to be actively accreting.
Apart from the TDs and PTDs discussed earlier, there are a few other objects in our sample which show significant flux deficits at wavelengths ≲8 μm, but show silicate emission features and continuum excesses longward of 8 μm with n13–31 index comparable to that of Class II objects. They are CHXR 20, CHXR 30A, C7-1, and CHXR 47. The slope of their continuum between 2 and 13 μm is steeper (more negative) than that for most (∼80%) Class II disks and they show little excess emission below 8 μm. The dust grains in their inner disks appear to be greatly depleted creating an opacity deficit. They differ from the TDs and PTDs in that their excess flux, even at wavelengths longer than 13 μm, is considerably lower than that of the Class II median. Also, they do not have a rising continuum longward of 13 μm indicating that the outer disk probably is not as optically thick as that of Class II disks and the "wall" emission is not significant. This class of disks has been identified by various names in the literature: "evolved disks," "anemic disks," and "homologously depleted disks" (Lada et al. 2006; Hernández et al. 2007; Currie et al. 2009; Luhman et al. 2010). Among these objects, CHXR 20, CHXR 30A, and CHXR 47 are WTTS (see Table 2); they have stopped accreting or are accreting at very low rates. C7-1, however, has an Hα equivalent width of 60 Å (Luhman 2004a) and is accreting. It probably has gas in the innermost parts of the disk. It is not clear if evolved disks fit into an evolutionary sequence in which the optically thick disk develops inner gaps and holes and eventually dissipates inside out. It is possible that they represent a different evolutionary path for the primordial optically thick disks where the disk dissipation does not proceed inside out. In this sense, evolved disks could also be considered to be in a transitional phase between the primordial optically thick disks and the optically thin debris disks (Lada et al. 2006; Currie et al. 2009; Muzerolle et al. 2010). A more detailed discussion of these objects and the question of disk dissipation in Cha I will be addressed in a forthcoming paper (E. Furlan et al. 2011, in preparation).
7. SUMMARY AND CONCLUSIONS
We have presented the mid-IR spectra of 82 young sources (most of them later than K5, including very low mass stars and brown dwarfs) in the Chamaeleon I star-forming region, obtained with the IRS on board the Spitzer Space Telescope. The IRS spectra and the photometry compiled from the literature have been used to construct the SEDs of these objects. Based on the observed SEDs, we classified the young stars in Cha I into various evolutionary classes. Our sample consists of six Class I objects, five Flat spectrum sources, 68 Class II objects, and three Class III stars. Eight of the Class II sources appear to be transitional disk candidates.
We analyzed the IRS spectra of the Class II objects in order to study the structure and evolution of their disks. To do this, we compared the shape of the observed mid-IR continuum to that predicted by the irradiated, accretion disk models which incorporates effects of disk evolution, such as grain growth and sedimentation. We analyzed the silicate emission features in the IRS spectra to study the structure and dust properties of protoplanetary disks in Cha I. We computed median SEDs representative of T Tauri stars (K5–M2) and very low mass objects (M3–M8) in our sample and compared them to the model SEDs and to each other to investigate the differences in disk properties as a function of stellar mass. We also examined the effects of multiplicity and accretion on the observed disk properties. Finally, we compared the properties of protoplanetary disks in Cha I (age ∼2 Myr) with those in slightly younger (ages ≲1 Myr) Taurus and Ophiuchus star-forming regions. The main results of this study are summarized below.
- 1.The observed continuum indices n6–13 and n13–31 for most Class II objects are best explained by the disk models where the surface layers of the disk are depleted of small grains by a factor of 100–1000 compared with that of the standard ISM dust-to-gas mass ratio. Substantial dust settling has occurred in most protoplanetary disks surrounding Class II objects in Cha I. The distribution of n6–13 and n13–31 continuum indices of Class II objects in the ∼2 Myr old Cha I, ∼1 Myr Taurus, and ≲1 Myr Ophiuchus is statistically indistinguishable indicating that the degree of dust settling in the disks and the frequency of settled disks are quite similar in these three regions. Most protoplanetary disks undergo significant dust settling by ≲1 Myr. No evidence for temporal evolution is seen in the observed degree of settling in ≲1–2 Myr old disks. Grain growth and sedimentation in protoplanetary disks appear to be balanced by counteracting processes such as fragmentation of large grains in the midplane and turbulent mixing.
- 2.The absence of objects showing high n2–6 index in Cha I indicates a paucity of high accretors among the Class II objects in Cha I as compared to Taurus and Ophiuchus. The apparent lack of high accretors in Cha I is consistent with the accretion rates in Class II disks declining with age.
- 3.We confirmed the TDs and PTDs in Cha I reported by Kim et al. (2009) and identified and additional TD candidate of spectral type M5, 2M J11241186−7630425. TDs and PTDs show the presence of holes or gaps in their inner disks, but have optically thick outer disks similar to that in Class II disks. Most TDs and PTDs are active accretors. Some of them have close stellar companions which are likely responsible for their altered disk structure; but in most TDs and PTDs, the holes and gaps are probably caused by very low mass, hitherto undetected substellar or planetary mass objects.We also identified a few objects that show significantly high 10 μm silicate equivalent widths (W10 ≳ W
 ) than what the models for "full" disks would predict, but have n13–31 index within the allowable range for the "full" disks. These objects are possibly opening up gaps in their disk (Espaillat 2009; Furlan et al. 2009). However, detailed modeling of their disk structure is required to confirm this. Most of these objects are actively accreting.We further confirmed four objects that could be classified as "evolved" disks based on their observed SEDs. Their continuum emission is considerably lower than the "full" disks in the entire infrared wavelength range (2–36 μm) indicating that their outer disks are relatively optically thin. Most of these objects have stopped accreting or are accreting at a low rate.
 - 4.Almost all Class II disks show mid-IR continuum excess and silicate emission features centered at 10 and 20 μm. The strength of both the 10 and 20 μm silicate features, on average, decreases as the degree of dust settling increases. Flared disks with less sedimentation show stronger silicate features whereas flatter disk with high degree of dust settling show weaker silicate features. We further find that the relative strength of the 20 μm feature over the 10 μm feature drops with increasing degree of dust sedimentation in the disks.
- 5.The 10 and 20 μm silicate features in Class II disks display a wide variety of feature strengths and shapes. The flux ratio F11.3/F9.8 and the equivalent width of the 33.6 μm forsterite feature indicate that the dust grains in the disk in Cha I have undergone significant processing (grain growth and crystallization). Additionally, we find a tight correlation between the equivalent width of 10 μm silicate feature and the flux ratio F11.3/F9.8, which is a measure of the degree of dust processing in the inner (≲1–2 AU) disks. Less settled disks, with stronger silicate emission, show low degree of dust processing. The more settled disks in our sample, in general, show higher degree of dust processing.However, disks with radial holes/gaps in general, show larger silicate emission equivalent widths and relatively pristine dust composition compared to that found for radially continuous "full" disks.We find a tight correlation between the flux ratio F11.3/F9.8 and the equivalent width of the forsterite feature at 33.6 μm which suggests that the inner (≲1–2 AU) and outer (≲10 AU) disk crystallinity track each other well for Class II disks in Cha I. The correlation between crystalline content of the inner and outer regions of the disks has also been found for Class II objects in Taurus and Ophiuchus regions.
- 6.Median SEDs computed for Class II objects in the spectral type range of K5–M2 and M3–M8 show crucial difference in the shape and strength of the continuum emission at wavelengths ≲8 μm: mid-M type stars and brown dwarfs show excess emission only at wavelengths ≳4–5 μm while in T Tauri stars (K5–M2) the excess emission begins at ∼2 μm; the observed continuum at wavelengths ≲8 μm in mid-M type stars and brown dwarfs is considerably steeper than that observed for T Tauri stars. However, both the medians look similar at longer wavelengths: they show 10 and 20 μm silicate emission features and their continuum slopes at wavelengths ≳8 μm are not very different.
- 7.Most WTTS in our sample show mid-IR (≳8 μm) excess emission and the silicate features at 10 and 20 μm, indicating the presence of disks around them. However, most of them do not show measurable excess at near-IR (≲6 μm) wavelengths. Their mid-IR continuum indices are steeper (bluer) than those for CTTS. The observed mid-IR excess of WTTS is considerably weaker than that of CTTS at all wavelengths.

This work is based on observations made with the Spitzer Space Telescope, which is operated by the Jet Propulsion Laboratory (JPL), California Institute of Technology (Caltech), under NASA contract 1407. Support for this work was provided by NASA through contract no. 1257184 issued by JPL/Caltech, JPL contract 960803 to Cornell University, and Cornell subcontracts 31419-5714 to the University of Rochester. E.F. was partly supported by a NASA Postdoctoral Program Fellowship, administered by Oak Ridge Associated Universities through a contract with NASA, and partly supported by NASA through the Spitzer Space Telescope Fellowship Program, through a contract issued by JPL/Caltech under a contract with NASA. K.L. was supported by grant AST-0544588 from the National Science Foundation. The Center for Exoplanets and Habitable Worlds is supported by the Pennsylvania State University, the Eberly College of Science, and the Pennsylvania Space Grant Consortium. C.E. was supported by the National Science Foundation under Award No. 0901947. P.D. acknowledges a grant from PAPIIT-UNAM, Mexico. This publication makes use of the SIMBAD and VizieR databases, operated at CDS (Strasbourg, France) and NASA's Astrophysics Data System Abstract Service.
Facility: Spitzer (IRS) - Spitzer Space Telescope satellite
Footnotes
- 13
The IRS was a collaborative venture between Cornell University and Ball Aerospace Corporation funded by NASA through the Jet Propulsion Laboratory and the Ames Research Center.