
Abstract
Ionizing radiation delivered by a medical linear accelerator (LINAC) generates Cherenkov emission within the treated tissue. A fraction of this light, in the 600–900 nm wavelength region, propagates through centimeters of tissue and can be used to excite optical probes in vivo, enabling molecular sensing of tissue analytes. The success of isolating the emission signal from this Cherenkov excitation background is dependent on key factors such as: (i) the Stokes shift of the probe spectra; (ii) the excited state lifetime; (iii) the probe concentration; (iv) the depth below the tissue surface; and (v) the radiation dose used. Previous studies have exclusively focused on imaging phosphorescent dyes, rather than fluorescent dyes. However there are only a few biologically important phosphorescent dyes and yet in comparison there are thousands of biologically relevant fluorescent dyes. So in this study the focus was a study of efficacy of Cherenkov-excited luminescence using fluorescent commercial near-infrared probes, IRDye 680RD, IRDye 700DX, and IRDye 800CW, and comparing them to the well characterized phosphorescent probe Oxyphor PtG4, an oxygen sensitive dye. Each probe was excited by Cherenkov light from a 6 MV external radiation beam, and measured in continuous wave or time-gated modes. The detection was performed by spectrally resolving the luminescence signals, and measuring them with spectrometer-based separation on an ICCD detector. The results demonstrate that IRDye 700DX and PtG4 allowed for the maximal signal to noise ratio. In the case of the phosphorescent probe, PtG4, with emission decays on the microsecond (μs) time scale, time-gated acquisition was possible, and it allowed for higher efficacy in terms of the probe concentration and detection depth. Phantoms containing the probe at 5 mm depth could be detected at concentrations down to the nanoMolar range, and at depths into the tissue simulating phantom near 3 cm. In vivo studies showed that 5 nmol of dye was readily detected with radiation doses less than 5 cGy. Since concentration, radiation dose and depth each contribute to the level of the detected signal, it may be possible to improve any of these parameters at expense of the others. This paradigm of nanoMolar sensitivity for optical reporters in vivo introduces the concept of molecular sensing of tumors during therapy or diagnostically with biologically relevant concentrations of fluorescent reporters.

Original content from this work may be used under the terms of the Creative Commons Attribution 3.0 licence. Any further distribution of this work must maintain attribution to the author(s) and the title of the work, journal citation and DOI.
1. Introduction
X-rays or electrons from linear accelerator (LINAC) irradiation are the two main types of radiation therapy used in tumor treatment. These types of megavoltage (MV) radiation delivery produce Cherenkov emission within the irradiated tissue (Glaser et al 2013). This light has been used in the past as an internal light source to excite fluorescence such as from protoporphyrin IX (PpIX) (Axelsson et al 2011) or other fluorescence dyes (Demers et al 2013) as well as the oxygen sensitive probe Oxyphor PtG4 (Lebedev et al 2009, Esipova et al 2011, Zhang et al 2012, 2013a). When used for imaging, Cherenkov-excited luminescence scanned imaging (CELSI) has been demonstrated to have increased spatial resolution, compared to traditional diffuse light imaging, because of the confined excitation within the tissue (Zhang et al 2015a). The key features of this new modality are broadband excitation, high spatial resolution, minimal invasiveness and low radiation doses. Perhaps the most exciting aspect of this work is that Cherenkov emission can be used to excite different molecular probes and thus can be useful in quantifying tissue microenvironment, but the particular types of reporters have yet to be fully investigated. So in this study, the efficacy of several NIR-active fluorescent and phosphorescent probes was systematically compared in tissue simulating phantoms and in vivo, to examine which wavelength ranges and acquisition parameters would maximally enhance Cherenkov-excited luminescence (CEL).
Cherenkov emission occurs when charged particles move through a dielectric medium with a phase velocity greater than the speed of light in that medium. Reports on Cherenkov emission imaging of probes for positron emission tomography (PET) and single photon emission computed tomography (SPECT) and radiotherapy have demonstrated the ability of Cherenkov emission imaging to show the radioactivity distribution in vivo (Robertson 2009, Li et al 2010, Spinelli et al 2010). Studies have shown that the emission from radioisotope probes can be used to excite fluorescence of luminescent nanoparticles (Dothager et al 2010). Furthermore, hybrid imaging agents that contain both a radioactive source and a fluorescent dye were developed for image-guided surgery applications (Chin et al 2013). Validation and applications of combined Cherenkov emission imaging agents and radioactive/fluorescent agents in terms of preclinical studies have been described (Mitchell et al 2011, Thorek et al 2013, Hu et al 2014, Kim et al 2014). In 2014, a PET/Cherenkov light hybrid imaging system was developed to study the merits of Cherenkov emission imaging in translational use (Yamamoto et al 2014). Radioisotope radioactive/fluorescent hybrid imaging agents have yet to become available for clinical use (Chin et al 2013) but a number of investigational studies are underway with commercial application showing promise.
Since MV x-rays used in radiotherapy of cancer generate significant Cherenkov emission in tissue (Glaser et al 2013, Zhang et al 2013b, 2013c, 2015b, Holt et al 2014, Jarvis et al 2014), it is possible to use CEL imaging for non-invasively sensing of the tumor microenvironment during the course of fractionated treatment. A large number of metabolic, immunologic and genetic features are significantly different in tumors compared to the normal tissue, and imaging modalities such as PET, magnetic resonance imaging (MRI) and optical tomography have been extensively used to investigate these features in tumors (Miao et al 2011, Meng and Li 2013, Sample et al 2014). In our previous work, a phosphorescent probe PtG4 (Lebedev et al 2009, Esipova et al 2011) was used to quantitatively image the partial pressure of oxygen (pO2) in the rat lymph node by means of the CELSI approach (Zhang et al 2015a). One of the key advantages of CEL based imaging is that the radiation beam dose is highly optimized for the targeted tissue, and the collateral damage to the surrounding healthy tissues is kept minimal (Zhang et al 2012). While phosphorescent probes are ideal optical sensors for oxygen, there exist many more luminescent probes that can be used for metabolic, immunologic and genetic sensing in vivo. The goal of this study was to compare some of these probes and to develop quantitative guidelines for selection of optimal reporters.
In this study, a LINAC beam was used to excite near-infrared (NIR) fluorescent probes IRDyes (LI-COR Biosciencs, Nebraska, USA), i.e. IRDye 680RD, IRDye 700DX and IRDye 800CW, as well as phosphorescent probe PtG4, within tissue simulating phantoms. The probes efficacy was compared as a function of concentration, depth of position into the tissue simulating phantom and with/without temporal-gating acquisition methods employed. In addition, the relationship between the radiation dose and the signal was studied in vivo (see figure 1).

Figure 1. Schematics of the experimental setups are shown in (a) with the linear accelerator and a phantom placed in the target region. A photograph of the container was inserted; (b) a diagram of the measurement system is shown consisting of a linear accelerator, the tissue simulating phantom container, the molecular probe sample, and an optical fiber that couples light from the phantom into the spectrometer-ICCD, as synchronized to the radiation pulses of the LINAC. The depth estimated was the lateral distance from the edge of probe tube to the fiber bundle tip, measuring the signal transmission in the medium; (c) the factors affecting CEL sensitivity are illustrated as 3 orthogonal axes in which there is reciprocity between them for constant SNR.
Download figure:
Standard image High-resolution image2. Materials and methods
2.1. Molecular probes and tissue simulating phantoms
NIR fluorescent probes IRDye 680RD, IRDye 700DX, IRDye 800CW and phosphorescent probe PtG4 (Lebedev et al 2009, Esipova et al 2011) were prepared as stock solutions in the standard phosphate buffer (PBS, pH7.2) at 100 μM concentration. The absorption and emission spectra of the probes are shown in figure 2. The tissue simulating phantoms were prepared using PBS, 1% v/v Intralipid© (Fresenius Kabi, Uppsala, Sweden) and 1% v/v whole blood (Lampire Biological Labs, Pipersville, USA). A tube containing the solution of the probe (~1 ml) at a concentration between 0.1 and 25 μM was placed inside the phantom at a depth which was varied between 1 to 25 mm from the phantom surface being imaged.

Figure 2. Experimental measured (a) absorption and (b) emission spectra of IRDye 600RD, IRDye 700DX, IRDye 800CW and PtG4 in PBS.
Download figure:
Standard image High-resolution image2.2. Cherenkov-excited luminescence (CEL) detection
All experiments were performed using a linear accelerator (Varian Linac 2100CD, Varian Medical System, Palo Alto, CA) based at the Norris Cotton Cancer Center, within the Dartmouth–Hitchcock Medical Center (see figure 1(a)). The initial beam cross-section was either 10 × 10 mm2 or 20 × 20 mm2, incident on the top of the inclusion tube, and adjusted for each experiment as needed. The beam energy was 6 MV x-rays, and the radiation dose rate chosen was 600 monitor units per minute (MU min−1), which is standard for patient treatment. The CEL spectral measurement system has been described previously (Zhang et al 2012), but briefly, the luminescence optical signal was collected by a fiber bundle consisting of nineteen silica fibers, 200 micron diameters packed tightly together in a circle at the tissue phantom end. The bundle was 15 m long, connecting out to the entrance of the detector. The fiber end was placed at the exterior surface of the phantom container or on the animal skin for in vivo studies. This optical fiber bundle relayed the optical signal to a vertical line of fibers at the entrance slit of the spectrometer (Acton Insight 300 mm, Princeton Instruments, Acton, USA), and the spectrometer coupled the spectrally resolved light to a gated ICCD (PI-MAX3, Princeton Instruments, USA). The ICCD was cooled to −25 °C, and the intensifier set to its maximal gain. The ICCD chip was of 1024 × 256 pixels with acquisition using all 256 rows binned to sum the signal into a single spectrum. Radiation from a clinical 2100CD LINAC was delivered in 3.25 μs bursts at a repetition rate of 360 Hz. So the ICCD was synchronized with the LINAC for detection of the light, with luminescence detection using an acquisition delay and gate width particularly set for either continuous wave (CW) or time-gated mode. In CW CEL detection, the acquisition was coincident with the LINAC pulse so that the Cherenkov and fluorescence were captured at the same time, in the 3.25 μs bursts of signal. But when temporally delayed luminescence was being detected, the acquisition gate start was delayed to ensure no detection of the Cherenkov signal into the ICCD. In this latter time-gated CEL detection, the acquisition delay was increased to 4 μs, beyond the time of the LINAC pulse, and the acquisition gate width was expanded to 50 μs to capture as much of the delayed phosphorescence as possible. Since Cherenkov emission was instantaneous with the 3.25 μs radiation pulse, the time-gated detection effectively removing all background Cherenkov from the detected signal. This set up is as shown in figures 1(a) and (b).
In tissue simulating phantom study, CEL from 2500 radiation pulses was integrated on the CCD chip prior to read out of the integrated signal, requiring acquisition for several seconds. This process was found previously to provide an optimal signal level without saturation. The background signal was measured using a tube containing PBS with the same volume of probe.
2.3. Dose efficacy experiments in vivo
All animal studies completed here where approved by the Institutional Animal Care and Use Committee at Dartmouth. To assess basic in vivo detection capability, the simulation of a tumor was created in vivo, using Matrigel mixed with PtG4 at 20 μM final concentration, injected subcutaneously into rat tissue. The rat tissue was injected with 250 μl of the Matrigel-PtG4 mix on the right flank and kept warm for 1 h while the Matrigel solidified. In order to guarantee the stability of the experimental process, the CEL detection experiments were completed immediately after animal euthanasia. To study the dose efficacy for CEL in vivo, the tissue was irradiated with doses which varied from 7200 pulses (about 200 cGy) down to 1 pulse (about 0.02 cGy). This last dose is the lowest value that the LINAC can reliably deliver. In each of these, the signal was acquired using the time-gated mode with phosphorescence detection.
2.4. Data processing
Each spectrum was processed by an important sequence of steps, which have been determined through previously published studies. These steps included temporal median filtering over 5 successive acquisitions, followed by background subtraction from a signal without luminescence, and wavelength smoothing through the implementation of a moving window average filter spanning ten neighboring points. The probe efficacy for CEL in the tissue simulating phantoms and in vivo was evaluated by using the signal-to-noise ratio (SNR) as a standard metric, which was defined by the differencing process of signal minus background at each wavelength, integrated over the wavelength band where the emission peak was found, and then divided by the standard deviation. This is described as,

where, IS and IB are the spectrum of the signal with and without probe respectively, and λ1 and λ2 are the bounds of the integrated wavelength range, and σ is the standard deviation. In the concentration sensitivity experiment, these spectra were integrated separately after subtraction of the background, and the standard deviation value for each was estimated by the variance between these samples. In the concentration sensitivity experiment, the standard deviation value for each was estimated by the variance between these samples. In the case of the experiment varying the object depth, the background changed with position of the object and the beam, so an individual background was taken for each beam position, and the standard deviation value for each position was estimated by the variance of 5 successive background acquisitions. In the animal model study, the estimation of standard deviation was the same as the method used in the concentration sensitivity experiment.
3. Results
3.1. Probes properties experiments
The absorption and emission spectra of IRDyes and PtG4 are shown in figures 2(a) and (b). The IRDyes and PtG4 can all efficiently absorb red and NIR light in the 600–800 nm wavelength band. As listed in table 1, compared with fluorescent probe IRDyes, phosphorescent probe PtG4 (emission maximum 772 nm) has a larger Stokes shift.
Table 1. Characteristics of NIR IRDyes and PtG4 in PBS (Lebedev et al 2009, Peng et al 2009, Esipova et al 2011, Tynan et al 2012).
| IRDye 680RD | IRDye 700DX | IRDye 800CW | PtG4 | |
|---|---|---|---|---|
| Quantum yield | 0.21 | 0.44 | 0.1 | 0.12 |
| Peak absorption (nm) | 672 | 689 | 774 | 435/623 |
| Extinction coefficient (M−1 cm−1) | 165 000 | 165 000 | 240 000 | 90 000(623) |
| Peak emission (nm) | 694 | 700 | 789 | 772 |
3.2. Background measurements
Figure 3 is the measured background Cherenkov emission spectra under CW and time-gated detection in the tissue simulating phantoms. In CW detection of the background, the Cherenkov emission during the radiation pulse was detected at the same time, so that there is a continuous emission across the visible and NIR spectrum with intensity varying as noted early (Jelley 1955). From this emission, it is obvious that the absorption of these probes were all in the range of Cherenkov emission within the tissue, so that they could all be used with this excitation light source. The absorption in 500–600 nm spectrum region was mainly from oxygenated hemoglobin in tissue simulating phantoms. When compared with the results of CW detection, Cherenkov emission was completely isolated from the radiation pulse under time-gated detection.

Figure 3. The background Cherenkov emission spectra are shown as measured from the tissue simulating phantoms under CW and time-gated detection. Gating removed nearly all Cherenkov background signal, as shown by the red line (as well as shown in insert), relative to the black.
Download figure:
Standard image High-resolution image3.3. Cherenkov-excited luminescence (CEL) measurements
The raw spectrum of CEL exhibits bloom of counts as shown in figure 4(a) (red arrow), which was removed by temporal median filtering, see figure 4(b). In addition, the smoothing method is helpful to reduce the low pass noise after temporal median filtering as shown in figure 4(c). The spectra shown below were all processed by using temporal median filtering and smoothing.

Figure 4. The CEL of (a) the raw spectrum, (b) the temporal median filtered spectrum, (c) the moving window averaged spectrum. Signal processing consisted of the steps, temporal median filtering from successive acquisitions, as well as moving window wavelength-averaged filtering.
Download figure:
Standard image High-resolution imageThe measured spectra of molecular probes with CW detection are shown in figures 5(a)–(d). After background subtraction, the absorption and emission spectra of the molecular probes appeared as shown in figures 5(f)–(i). Compared with CW detection, the PtG4 phosphorescence signal was effectively isolated from the Cherenkov emission under time-gated detection as shown in figure 5(e), even without background subtraction.

Figure 5. CEL spectra and background subtracted CEL spectra in (a) and (f) for IRDye 680RD, (b) and (g) for IRDye 700DX, (c) and (h) for IRDye 800CW, (d) and (i) for PtG4 under CW detection and (e) and (j) for PtG4 under time gated detection in tissue simulating phantoms with different concentrations.
Download figure:
Standard image High-resolution imageAccording to the background subtracted spectra, the luminescence intensity of probes were integrated at the range of 713–790 nm for IRDye 680RD, 708–805 nm for IRDye 700DX, 850–890 nm for IRDye 800CW, 750–850 nm for PtG4 under CW detection and 730–880 nm for PtG4 under time gated detection. Figure 6(a) shows the results of the integrated intensity of CEL for different concentrations of IRDyes probes and PtG4 under CW and time-gated detection. The slope of concentration with integrated intensity saturated at higher concentrations, so measurement in this range would be problematic in tissue. According to equation (1), the SNR in concentration efficacy experiment was estimated using the standard deviation of the integrated intensity of the signal. The SNR versus concentration is shown in figure 6(b), with lines connecting the similar data points from the different dyes. In this experiment, the lowest concentrations used were 3.3, 1.6, 6.3 and 0.2 μM for the agents IRDye 680RD, IRDye 700DX, IRDye 800CW and PtG4, respectively. These were all with CW detection. When compared with CW results, the lowest concentration used was 0.1 μM for PtG4 under time gated detection. The SNR versus concentration plots were extrapolated to estimate the minimum sensitivity at which SNR = 1, and these ultimate limits of detection are what was listed in table 2.

Figure 6. (a) The integrated intensity of CEL is plotted with increasing concentration. (b) The SNR versus concentration for IRDyes and PtG4 in tissue simulating phantoms is plotted.
Download figure:
Standard image High-resolution imageTable 2. Concentration sensitivity and depth sensitivity for IRDyes and PtG4 in tissue simulating phantoms under CW or time gated detection (estimated for SNR = 1with linear fitting).
| Concentration sensitivity (μM) | Depth sensitivity (mm) | |||
|---|---|---|---|---|
| CW | Gated | CW | Gated | |
| IRDye 680RD | 0.98 | Not possible | 14 | Not possible |
| IRDye 700DX | 0.28 | Not possible | 29 | Not possible |
| IRDye 800CW | 1.75 | Not possible | 7 | Not possible |
| PtG4 | 0.25 | 0.0089 | 26 | 30 |
Figures 7(a)–(e) show the background Cherenkov subtracted luminescence spectra at different depths for IRDye probes and PtG4 at the fixed concentration of 6.3 μM. The absorption and probe luminescence signals are decreased with depth increase. The luminescence intensity of probes were integrated at the range of 720–780 nm for IRDye 680RD, 710–850 nm for IRDye 700DX, 825–900 nm for IRDye 800CW, 760–810 nm for PtG4 under CW detection and 750–860 nm for PtG4 under time gated detection. In figure 8(a), the integrated fluorescence and phosphorescence intensity were plotted with depth. In depth efficacy experiment, the SNR was estimated by using different σ. Compared with using standard deviation of the integrated intensity of signal as σ, the SNR was reasonable by using the standard deviation of the detected background as σ. The SNR versus depth are shown in figure 8(b). In this study, the detectable depth was 10 mm, 20 mm and 5 mm for IRDye 680RD, IRDye 700DX and IRDye 800CW with CW detection, and PtG4 has the detectable depth of 20 mm with CW and 25 mm with time gated detection mode. The depth sensitivity was estimated for SNR = 1, representing an ultimate lower limit, and the results are listed in table 2.

Figure 7. Background subtracted CEL spectra of (a) IRDye 680RD, (b) IRDye 700DX, (c) IRDye 800CW and (d) PtG4 under CW detection, and (e) PtG4 under time-gated detection in tissue simulating phantoms for different depth.
Download figure:
Standard image High-resolution image
Figure 8. (a) Integrated intensity of CEL with increasing depth, (b) SNR versus depth for IRDyes and PtG4 in tissue simulating phantoms.
Download figure:
Standard image High-resolution image3.4. Animal model study
We embedded PtG4 in Matrigel solutions for in vivo measurement. The Matrigel-PtG4 phosphorescent spectra were measured 5 times and the temporal median filtered spectra of Matrigel-PtG4 (data not shown) were obtained to calculate the background, using a least-squares fitting algorithm. The original phosphorescent spectra were acquired for doses varying from 200 cGy down to 0.02 cGy. When including the number of the temporal median filtering steps used in data processing, the total radiation doses delivered for each background subtracted spectra was varied from 1000 cGy down to 0.1 cGy. The smoothed background subtracted phosphorescent spectra for different radiation doses are shown in figure 9(a). The result clearly shows the phosphorescent peak at 772 nm for Matrigel-PtG4. The integrated intensity of 80 nm spectral window centered on the emission peak is plotted for each radiation dose in figure 9(b). The integrated intensity was offset by 600 to make the last three data point at lower dose range visible in the figure. Least-squares linear fitting was applied and the results of the fitting are listed. The integrated intensity of Cherenkov-excited phosphorescence was directly proportional to the radiation dose and the monotonically proportional dynamic range was 4 orders of magnitude. The SNR of Matrigel-PtG4 phosphorescence for different radiation dose is plot in figure 10. The signal was detectable when radiation dose was 7 cGy, under the conditions stated here. The ultimate lower limit dose was 4.6 cGy when estimated for SNR = 1 with linear fitting.

Figure 9. (a) Background subtracted CEL spectra of Matrigel-PtG4 for different radiation doses, and (b) the wavelength integrated intensity is plotted for each different radiation dose.
Download figure:
Standard image High-resolution image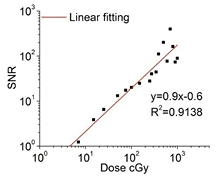
Figure 10. The SNR value from the Matrigel-PtG4 CEL studies in vivo is shown for different radiation doses. The extrapolation fit down to SNR = 1 provides an estimate of the lowest possible dose that can be used under these conditions.
Download figure:
Standard image High-resolution image
4. Discussion
The major results here include estimation of the minimum detectable concentrations and largest detectable depths, as summarized in table 2, for the investigated probes. Results from CW and time domain gated acquisition were compared to PtG4. For the fluorescent probes, measured under CW acquisition, the ultimate lower limit concentration for IRDye 700DX was 0.28 μM, which was 3 times lower than IRDye 680RD at depth of 5 mm, and the ultimate largest detectable depth for IRDye 700DX was 29 mm at the concentration of 6.3 μM. IRDyes results mean that at the same extinction coefficient and closed absorption peak (as listed in table 1), the higher quantum yield the more CEL sensitivity. In comparison for phosphorescent probes, the ultimate lower limit concentration for PtG4 was 8.9 nM with time gated detection, which was about 28 times lower than CW detection results, while the ultimate largest detectable depth showed an improvement of 4 mm (26 mm for CW and 30 mm for gated). IRDye 800CW has very closed quantum yield and higher extinction coefficient to PtG4, however, the Cherenkov emission was exponential decay at NIR wavelength region, which greatly decrease the CEL sensitivity of IRDye 800CW. CEL could be detected even when irradiated by only 4.6 cGy with a 5 nmol PtG4 inclusion in vivo. The ability to detect nmol levels of a dye in vivo with only 5 cGy presents a fundamentally new way to sense molecular concentrations in vivo. This concentration range at tracer dose levels combined with radiation doses consistent with diagnostic radiology imaging demonstrates that in vivo molecular sensing with CEL could be feasible even outside the context of therapeutic radiotherapy. Improvements beyond these sensitivity numbers can come from improved emission quantum yields, improved detection configuration or increased radiation doses. For example, sensing within a therapeutic radiation therapy fraction, typically about 2 Gy, would lead to a signal level nearly 1000 times higher than what was sampled here.
Taking the signal detection method into consideration, some limitations exist for CEL measurement from the LINAC. This type of LINAC delivers 3.25 μs radiation pulses at 360 Hz, and so for fluorescent probes with nanosecond lifetimes, the measurement had to be carried out during the radiation beam time. This means that the Cherenkov emission appears as the signal added onto the Cherenkov emission. So the contrast of signal to background is limited by this contamination, as well as potentially increasing the noise level. As shown in figure 6(a), the linearity of the data was better for time-gated measurements for a wider range of concentrations, as might be expected. However, because the pulse is slow (3.25 μs), relative to the fluorescence signal (nanoseconds), this means that phosphorescent probes are ideally suited for excitation targets in LINAC based sensing, so that the Cherenkov background can be effectively eliminated using the time gated approach. If a LINAC with short pulse lengths was used then time gating of the pulse to detect nanosecond fluorescence mightbe achieved, but these are not as widely available as the standard clinical LINACs.
An interesting aspect of this work is that even though there is high absorption of UV/blue light over distances greater than a few 100 microns in biological tissue, it may be feasible that microlocalized blue absorbing dyes which are co-localized with the site of Cherenkov generation could be effective molecular probes, if they have a larger Stokes shift for their emission. The Cherenkov emission in the NIR region was examined here, as shown in figure 3, under the assumption that NIR signals propagate better in tissue, and that most useful emitters have a small Stokes shift in excitation to emission. Yet because the Cherenkov spectra varies with the inverse-square of wavelength, there is substantially more UV/blue light than there is red/NIR light available for excitation (Jelley 1955). The probes studied here, each have red/NIR absorbance, and excitation between 700–800 nm appears to have maximal efficiency within tissue. Yet, it is possible that fluorescent dyes with a high Soret absorption band, which are not localized within the blood vessels, and have a large Stokes shift could be even more efficient than these. While this concept is supported by Monte Carlo data and phantom studies in the absence of blood, initial tests with these dyes have not exhibited improved signals to date, yet further research may still prove this.
One limitation in probe efficacy for CEL from the LINAC is noise induced in the ICCD sensor, due to stray radiation in the room during the time of each LINAC pulse (Archambault et al 2008). Leakage x-rays or electrons from the LINAC strike the sensor, resulting in a non-localized bloom of counts randomly placed in the spectrum, which is directly proportional to the x-ray energy, usually saturating the pixels. A decrease of the radiation dose per unit time, can contribute to improved SNR values. However shielding of the ICCD coupled spectrometer outside of the treatment room can also drastically remove noise from the measurement, as has been done in our previous work, using a long fiber optic cable to couple the optical signal out of the room. Further noise reduction methods can directly improve the potential for CEL sensing of molecular signals.
5. Conclusion
In summary, the concentration and depth sensitivity of NIR molecular probes with Cherenkov excitation have been studied during external radiation beam therapy in tissue simulating phantoms. The conclusion from this work is that for fluorescent probes from the IRDye type the lowest detectable concentration was just under 0.3 μM for IRDye 700DX with CW detection, and the largest detectable depth in tissue simulating phantoms was 29 mm. This can be compared with the superior results of the time-gated detection which is possible with phosphorescent agents, with a lowest detectable PtG4 concentration near 9 nM. The largest detectable depth improves from 26 mm for CW to 30 mm for gated detection. Under phosphorescence time-gated detection, the integrated signal was found to be linear with radiation dose and could be detected with as low as 4.6 cGy for a 5 nmol sample in vivo. This paradigm introduces the potential for nanoMolar sensitivity of probes in tumors for molecular imaging and sensing with radiotherapy excitation used in diagnostic mode. These concentrations would allow immunologic or metabolic sensing in tissue with diagnostic radiation dose levels. Future studies will focus on sensing these important biological changes during a course of therapy to assess potential pre-clinical or research value in specific tumors and therapies.
Acknowledgments
This study has been fund by NIH research grants R01CA109558 (B W P), R01GM103591 (S V), R01EB018464 (S V) and Norris Cotton Cancer Center Pilot funding (B W P, D J G, L A J). H L is supported by the Scholarship of Education Department of Fujian Province.