

Abstract
Gold nanoparticles (GNPs) have shown potential as a radiosensitizer for radiation therapy using photon beams. Recently, experimental studies have been carried out using proton beams showing the GNP enhanced responses in proton therapy. In this work, we established a biological model to investigate the change in survival of irradiated cells due to the radiosensitizing effect of gold nanoparticles. Results for proton, megavoltage (MV) photon and kilovoltage (kV) photon beams are compared. For each particle source, we assessed various treatment depths, GNP cellular uptakes and sizes. We showed that kilovoltage photons caused the highest enhancement due to the high interaction probability between GNPs and kV photons. The cell survival fraction can be significantly reduced for both proton and MV photon irradiations if GNPs accumulate in the cell. For instance, the sensitizer enhancement ratio (SER) is 1.33 for protons in the middle of a spread out Bragg peak for 1 µM of internalized 50 nm GNPs. If the GNPs can all be internalized into the cell nucleus, the SER for proton therapy increases from 1.33 to 1.81. The results also show that for the same mass of GNPs in the cells, one can expect the greatest sensitization by smaller GNPs, i.e. a SER of 1.33 for 1 µM of internalized 50 nm GNPs and a SER of 3.98 for the same mass of 2 nm GNPs. We concluded that if the GNPs cannot be internalized into the cytoplasm, no GNP enhancement will be observed for proton treatment. Meanwhile, proton radiotherapy can potentially be enhanced with GNPs if they can be internalized into cells, and especially the cell nucleus.
Export citation and abstract BibTeX RIS
1. Introduction
Gold nanoparticles (GNPs) have shown potential as a radiosensitizer in radiation therapy. The radiosensitizing effect of GNPs was first demonstrated in vivo using 1.9 nm GNPs intravenously injected in mice bearing subcutaneous mammary carcinoma. The one year survival using 250 kVp x-rays with GNPs was demonstrated to be 4 times higher compared to using x-rays alone (Hainfeld et al 2004). Subsequently, several in vivo experiments have shown significant GNP sensitization using different cell lines with GNPs of various sizes and surface modifications (Hainfeld et al 2008, Chattopadhyay et al 2012, Hainfeld et al 2013, Joh et al 2013). To understand the biological mechanism for GNP radiosensitization, many studies have investigated the effect on in vitro cell survival fraction and DNA damage in the presence of GNPs (Chithrani et al 2010, Butterworth et al 2012). Despite the wide range of GNP sizes and surface coatings used in these reports, it has been shown that in general the cell survival decreases with increased cellular internalization of GNPs (Hainfeld et al 2004, Hainfeld et al 2008, Butterworth et al 2010, Chithrani 2010, Chithrani et al 2010, Chattopadhyay et al 2012, Hainfeld et al 2013, Joh et al 2013) and under the same experiment conditions, kilovoltage (kV) photons produce greater sensitization than megavoltage (MV) photons (Chithrani et al 2010, Liu et al 2010, Jain et al 2011). Several theoretical models have been proposed to interpret and predict the GNP dose enhancement. Early macro-dosimetric models calculated the average dose increase in the tumor volume due to the addition of GNPs. These models did not consider the microscopic inhomogeneity of dose deposition induced by the GNPs and resulted in a discrepancy between the predicted dose enhancement and the experimental results for both kV and MV photon beams (Cho 2005, McMahon et al 2008, Lechtman et al 2011). Several studies have investigated the dose enhancement in the vicinity of GNPs at micrometer or nanometer scales and provided the characteristics of secondary electrons produced through interactions between photon beams and GNPs (Jones et al 2010, Leung et al 2011). Recently, McMahon et al proposed a biological model relating the nano-dosimetric characteristics of GNPs and the biological effect using the local effect model (LEM) (McMahon et al 2011a). This model was able to describe experimental cell survival curves for both kV photon sources and clinical MV sources (McMahon et al 2011a, 2011b, Lechtman et al 2013).
There have only been a few studies investigating the radiosensitization induced when irradiating GNPs with proton beams. Recently, in vivo and in vitro studies have investigated the feasibility of using GNPs as a radiosensitizer using both proton and heavy ion therapy (Liu et al 2010, Kaur et al 2013a, 2013b). Kim et al demonstrated in vivo that a proton treatment of mice subcutaneously bearing CT26 mice colorectal adenocarcinoma cancer in combination with GNPs causes an increase of one year survival of over 50% versus proton irradiation alone (Kim et al 2012). Polf et al have shown an approximately 15% increase in cell killing of DU145 prostate cancer cells with GNPs in vitro using a clinical proton beam (Polf et al 2011). In order to understand the mechanism of GNP dose enhancement using proton radiation, our group has recently investigated the characteristics of the secondary electron spectrum produced through interactions between GNPs and proton beams using Monte Carlo simulations (Lin et al 2014). We calculated and compared the dose deposited in water by secondary electrons generated from GNPs interacting with clinical spread out Bragg peak (SOBP) proton beams, kV photon beams and clinical MV photon beams. We concluded that for the same amount of energy absorbed inside the GNPs the doses deposited by secondary electrons within several nanometers of the GNP surface differ by less than 20% for the three radiation sources. However, secondary electrons produced by kV photons have a longer range compared to those caused by protons.
In this paper, based on our previous work (Lin et al 2014), we applied a model following the approach of the local effect model (LEM) to describe the biological effects caused by introducing GNPs in a radiation field to investigate 1) cell survival changes due to GNP radiosensitization affected by cellular uptake and the distribution of GNPs inside a cell, 2) the difference of cell survival changes due to GNPs between proton beams, kV photon beams and MV photon beams, 3) the cell survival changes from the use of different GNP sizes and 4) The effect of input parameters of the biological model on predicted GNP radiosensitization. We did not include the effects of potential chemical or stress induced cell death caused by GNP internalization in this analysis.
2. Method
2.1. Monte carlo simulation
Monte Carlo simulations were carried out using TOPAS (tool for particle simulation; version beta 12) (Perl et al 2012), which is layered on top of Geant 4, version 9.6p02 (Agostinelli et al 2003). The simulations were split into three steps as follows.
Step 1. A 20 × 20 × 40 cm3 water phantom was irradiated with three types of particle sources and the particle spectrum at a given depth (indicated in figure 1) was recorded as a phase space profile passing a 50 mm diameter surface perpendicular to the beam axis. The phase spaces contain all primary and secondary particles. The simulation details for each particle source are:

Figure 1. Percentage depth dose for (a) a SOBP proton beam, (b) a pristine Bragg peak proton beam, (c) a 6 MV photon beam and (d) a 150 kVp photon beam. The particle spectrum was obtained at the depths indicated by the red dots.
Download figure:
Standard image High-resolution imageSpread out Bragg peak (SOBP) proton beam.
A proton beam with 12.7 cm range in water and 7 cm modulation width was simulated according to the treatment delivery system at massachusetts general hospital (MGH) (Paganetti et al 2008, Testa et al 2013). The percentage depth dose is shown in figure 1(a). Phase spaces were acquired at three depths equally spaced along the SOBP (SOBP1, SOBP2 and SOBP3) as indicated in figure 1(a).
Pristine Bragg peak proton beam.
A 10 × 10 cm field size, 100 MeV proton beam was used to irradiate the 20 × 20 × 40 cm3 water phantom. The percentage depth dose is shown in figure 1(b). The phase spaces were acquired at the pristine Bragg peak as indicated in figure 1(b).
6 MV photon beam.
A 10 × 10 cm field size Varian TrueBeam 6 MV phase space file was downloaded from the IAEA website (Capote et al 2006). The percentage depth dose is shown in figure 1(c). Three depths coinciding with the maximum dose (PDD100) and 80% and 50% of the maximum dose (PDD80 and PDD50) were chosen to acquire the particle phase space file as indicated in figure 1(c).
Kilovoltage photon beam.
A tungsten target with a 2 mm aluminum filter was simulated which produces a 150 and 250 kVp photon spectrum impinging on the water phantom. The depth at 1 mm below water surface was selected to obtain the particle phase space, as indicated in figure 1(d).
Step 2. Four sizes of spherical GNPs were investigated with diameters of 50, 20, 10 and 2 nm. To address the low chance of hitting a GNP in the water phantom, the phase space file obtained from Step 1 was modified by adjusting both the length scale and angular distribution (see (Lin et al 2014) for more details) to have the same beam diameter as a single GNP as shown in figure 2. The electrons produced through ionizing interactions in the GNP were recorded in a phase space on the outer surface of the GNP. The Geant4-Penelope physics list was used for this simulation step and electrons were tracked down to an energy of 250 eV in gold (Bernal and Liendo 2009). The secondary electron production threshold was set to 800 eV. The number of particles interacting within the GNP was calculated as the difference between the number of particle tracks that entered the GNP and the number of tracks that emerged from the GNP without interacting. This value was then used to calculate the probability of having an ionization event inside the GNP as described in section 2.2.
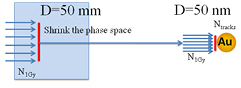
Figure 2. Illustration of Step 2. N1Gy represents the number of particles passing a 50 mm diameter circle that deposit 1 Gy in a water phantom. The particles at the circle are then modified to irradiate a single GNP as explained in Step 2. The number of particle tracks that interacted in the GNP volume by N1Gy incoming particles is represented by Ntracks.
Download figure:
Standard image High-resolution imageStep 3. For this step, we used the phase-space recorded in Step 2 as a source, which was placed at the center of a 40 × 40 × 40 µm3 water phantom. The Geant4-DNA physics package (Incerti et al 2010) was used, which allows tracking of electrons down to an energy of 7 eV in water. The dose was scored in a voxelized grid with a voxel size of 1 × 1 × 1 nm3 for the first 200 nm from the center, 10 × 10 × 10 nm3 from 200 nm to 2 μm and 100 × 100 × 100 nm3 from 2 to 20 μm. For a more detailed description of the setup and simulation parameters see (Lin et al 2014).
2.2. Calculation of ionization rate
We can calculate the interaction probability per Gray with the geometrical concept illustrated in figure 2.
For 1 Gy prescribed dose, the chance of hitting a single 50 nm GNP is given by:
where N1Gy represents the number of particles passing a 50 mm diameter circle that deposit 1 Gy in a water phantom. The dose used in proton dose calculation is 1 Gy physical instead of 1 Gy(RBE) biological equivalent dose. The same number of particles is used to irradiate a single GNP as described in Step 2. The probability of having an ionization event by a single incoming particle is calculated as:

where Ntracks is the number of particle tracks for N1Gy incoming particles that interacted in the GNP volume and resulted in ionized atoms. Ntracks is also defined as the number of ionization events in GNP. The interaction probability is then defined as the product of the probability of hitting a single GNP and the probability of causing an excitation event for one particle:

2.3. Local effect model approach
The local effect model (LEM) originally developed for carbon ion therapy seeks to relate the dose response curve following high linear energy transfer (LET) radiation to a reference x-ray radiation (Scholz and Kraft 1994, Scholz et al 1997, Elsässer and Scholz 2007). In order to consider the secondary delta electrons, the radial dose distribution produced by secondary electrons around the primary particle track is used as input. The dose deposited as a function of the distance to the ion path (r) has a 1/r2 dependence, indicating a high dose near the ion track followed by a rapid dose decrease as r increases.
The dose in close vicinity of a GNP is particularly high due to the large number of secondary electrons ejected from the GNP. The dose decreases rapidly as the distance from the GNP surface increases (McMahon et al 2011a, Lin et al 2014). The LEM concept thus provides a framework to predict the dose response curve for GNP radiosensitization by replacing the radial dose deposition around an ion track with the radial dose deposition around a GNP. In our approach, 'GNP-LEM', three inputs are needed, 1) a spatial dose distribution around a GNP for a given particle source, 2) the Linear-Quadratic (LQ) model to parameterize the x-ray dose response curve into α and β components and 3) a geometrical model of the cell to characterize the volume of the nucleus and the distribution of the GNPs.
Within the LEM framework, the number of lethal events N as a function of dose (D) follows a Poisson distribution, thus the surviving fraction as a function of photon dose (Sx(D)) is determined by

Because the LQ model overestimates the response at high doses (Astrahan 2008) above a threshold dose Dt, the dose response curve reaches a maximum slope given by  As a result, the dose response curve can be represented as a linear quadratic linear (LQL) model:
For a homogeneously irradiated cell nucleus volume V, the lethal event density ν(D) is
For a subvolume ΔV, the number of lethal events is
For an inhomogeneous radiation field, the total number of lethal events Ntotal can be calculated by integrating the lethal events over the whole target volume based on the distribution of local doses within the nucleus, which gives
where d(x,y,z) represents the distribution of local doses. The dose response curve in the presence of GNPs can then be calculated by

In the presence of GNPs, the local dose distribution is represented by a homogeneous dose from the delivered treatment field in addition to the dose deposited in the vicinity of GNPs (doseGNP). The doseGNP is determined by multiplying the dose from a single ionizing event by the number of GNPs, the interaction probability per Gray and the prescribed dose.
The GNP-LEM developed in this study was implemented in 2D, where the volume integration is reduced to an area integration over the cell nucleus. Cells appear to be flattened out when they attach to a petri dish as compared to in cell suspension and the thickness of the cell is set to be 2 µm.
2.4. Cellular model geometry
The dose response relationship of MDA-MB-231 breast cancer cells was considered in this work. The parameters for the linear-quadratic equation were α = 0.019 and β = 0.052 (Jain et al 2011). In addition, two other α and β values representing a high and low α/β ratio cell line were considered, which are DU145 prostate cancer cells with α = 0.13 Gy−1, β = 0.022 Gy−2 and α/β = 6 Gy, and human brain tissue with α = 0.1 Gy−1, β = 0.05 Gy−2 and α/β = 2.0 Gy (Van der Kogel 1986).
The size of the cell and nucleus varies depending on cell lines and cell cycle. For instance, MDA-MB-231 cells have an average size of 13.5 µm (Coulter et al 2012) while PC-3 cells have an average cell size of 13.1 µm and nucleus size of 8.2 µm (Lechtman et al 2013). For this study, we used 13.5 µm as cell diameter with an 8 µm diameter radiation sensitive nucleus at the center, which is in good agreement with the range of many cancer cell lines (Zhao et al 2008, Jiang et al 2010). An additional 2.5 µm thickness was added outside of the cell to represent the extracellular media region.
The following five GNP geometries were investigated:
- (a)Nucleus: GNPs are randomly distributed in the cell nucleus only (figure 3(a)).
- (b)CellHomo: GNPs are randomly distributed in the whole cell including the nucleus and cytoplasm space (figure 3(b)).
- (c)Cytoplasm: GNPs are randomly distributed in the cytoplasm only (figure 3(c)).
- (d)Media: GNPs are randomly distributed in the extracellular media only (figure 3(d)).
- (e)Complex: GNPs are randomly distributed inside of the cell and extracellular media with the same concentration. Within the cell, 90% of GNPs are distributed in the cytoplasm and 10% of GNPs are distributed throughout the whole cell volume including the nucleus (figure 3(e)).
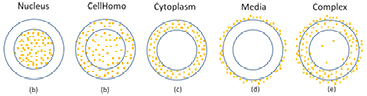
Figure 3. The cell geometry and five GNP distributions used as input for the GNP-LEM. (a) Nucleus geometry, GNPs randomly distributed in the cell nucleus. (b) CellHomo geometry, GNPs randomly distributed in the whole cell. (c) Cytoplasm geometry, GNPs randomly distributed in the cytoplasm. (d) Media geometry, GNPs randomly distributed in the extracellular media. (e) Complex geometry, GNPs randomly distributed inside of the cell and extracellular media with the same concentration. Within the cell, 90% of GNPs randomly distributed in the cytoplasm and 10% of GNPs distributed in the whole cell volume including the nucleus region.
Download figure:
Standard image High-resolution imageThe threshold dose Dt is an empirical and cell line dependent parameter, and may be approximated for some cell lines by experimental or clinical data (Astrahan 2008). A Dt of 20 Gy is used for this study but the effect of several Dt values ranging from 10 to 30 Gy as described in the literature (Krämer and Scholz 2000, Paganetti and Goitein 2001, Astrahan 2008) was also considered.
2.5. GNP-LEM predictions
Dose response curves were calculated from 0–8 Gy for scenarios covering a range of GNP distributions, sizes and concentrations for the three irradiation modalities. The sensitizer enhancement ratio (SER) was used to quantify the enhancement. SER was calculated from the mean inactivation dose (MID), defined as the area under the dose response curve. The SER was obtained by dividing the MID for the control sample by the MID in the presence of GNPs. The MID for the control sample is defined as the MID of the survival curve without GNPs added. The MID for gold-treated samples was obtained from the dose response curve calculated by GNP-LEM.
- (a)For each particle source, we investigated the GNP SER for the five GNP geometries as described in section 2.4. A concentration of 1 µM using 50 nm diameter GNPs results in 1.4 × 10⁵ GNPs for the Nucleus, CellHomo and Cytoplasm geometries (based on a cylindrical volume of 13.5 μm diameter and 2 μm thickness). For the Complex case, there were 1.26 × 10⁵ GNPs in the cytoplasm and 1.4 × 10⁴ GNPs homogenously distributed outside the cell.
- (b)We then repeated a) using 20, 10 and 2 nm GNPs for the CellHomo geometry, once assuming the same number of GNPs and once assuming the same weight of GNPs.
- (c)The SER as a function of GNP concentration was investigated using 50 nm GNPs. We investigated two GNP geometries (the CellHomo and Cytoplasm) for each modality. For the kV photons, the considered range of GNP concentration was between 10 nM and 1 µM, while for the proton source and 6 MV Linac photon source, the considered concentration ranged from 100 nM to 10 µM.
3. Results
3.1. Radial dose distribution from GNPs for different therapy modalities
The interaction probability per prescribed Gray as defined by Ptotal in section 2.2 for the three particle sources is shown in table 1. Figure 4(a) shows the dose per ionization event as defined in section 2.2 by the average dose deposited per incoming particle track that interacts in a GNP. It has been shown that the GNP dose using 6 MV photons has a considerable contribution from electron ionization as well as photon ionization (McMahon et al 2011a, Lin et al 2014). For the 6 MV photon beam, the dose per ionization is plotted for the electron and photon contribution individually. Within 10 nm from the GNP surface, the dose per ionization for the 6 MV particle spectrum electron component is the highest, but drops off below the photon component after 100 nm. The dose deposited at the GNP per ionization agrees within 20% for the proton beam, the 250 kVp photon beam and the photon component of the 6 MV photon beam. As the distance from the GNP surface increases, the dose from proton irradiation drops off fastest. At a distance of 1 μm from the GNP surface the dose from 250 kVp photons and the photon component of the 6 MV photon beam is ten times higher than the dose from proton irradiation. The difference increases further and at a distance of 10 μm from the GNP surface and beyond, the dose from 250 kVp photons is 30 times higher than the dose from proton beam irradiation at the center of the SOBP (SOBP2).
Table 1. The interaction probability of 50 nm GNPs per Gray for three therapy modalities.
| GNP Size | SOBP protons | 6MV photons | Kilovoltage photons | ||||||
|---|---|---|---|---|---|---|---|---|---|
| SOBP1 | SOBP2 | SOBP3 | Pristine | PDD100 | PDD80 | PDD50 | 150 kVp | 250 kVp | |
| 50 nm | 7.0 × 10⁻⁴ | 6.9 × 10⁻⁴ | 6.9 × 10⁻⁴ | 5.6 × 10⁻⁴ | 4.9 × 10⁻⁴ | 8.3 × 10⁻⁴ | 1.0 × 10⁻³ | 2.9 × 10⁻² | 2.2 × 10⁻² |

Figure 4. (a) Comparison of the radial dose deposition per ionization for a single 50 nm GNP in a SOBP proton beam (SOBP2), a 6 MV photon beam (electron component and photon component, respectively) and a 250 kVp photon beam. (b) Comparison of the radial dose deposition per ionization for four GNP sizes in a SOBP proton beam at SOBP2.
Download figure:
Standard image High-resolution imageBeside the differences in spatial dose deposition per ionization interaction for different treatment modalities, the interaction probability also differs by up to two orders of magnitude as shown in table 1.
The kilovoltage photon source has the highest interaction probability with GNPs per Gray, and it is energy dependent. 150 kVp photons have a 30% higher interaction probability than 250 kVp photons.
The MV photon source has a much lower interaction probability compared to kV photon and the probability increases with increasing depth. The interaction probability at PDD50 is nearly twice as high as at PDD100 depth. This increase is mainly due to the beam softening due to scattering, as shown in our previous study (Lin et al 2014).
The interaction probability for the considered proton source is on the same order of magnitude as for the MV photon source. For a SOBP proton beam, the interaction probability is independent of depth, and about 20% higher than in a pristine (mono-energetic) proton beam.
3.2. Size dependence of GNP radial dose distributions
The interaction probability per prescribed Gray for four GNP sizes at the center of the proton SOBP (SOBP2) is shown in table 2. The dose per ionization event for a proton beam impinging on GNPs of various sizes is shown in figure 4(b). For one ionization event, 2 nm GNPs produce nearly a 215 times higher dose near the surface of the nanoparticles compared to 50 nm GNPs. The difference is reduced to less than 10% as the distance from the surface increases to 1 µm. For the same energy absorbed by a single GNP, the secondary electrons generated in a large GNP are more likely to lose their energy before reaching the surface. Such self-absorption contributes to the lower dose deposited around the GNP by one ionization event for larger GNPs.
Table 2. The interaction probability per Gray for different GNP sizes at the center of the SOBP (SOBP2).
| GNP Size | 50 nm | 20 nm | 10 nm | 2 nm |
|---|---|---|---|---|
| Interaction probability | 6.9 × 10⁻⁴ | 2.3 × 10⁻⁵ | 4.3 × 10⁻⁶ | 3.0 × 10⁻⁸ |
3.3. GNP SER for various GNP spatial distributions
The results are shown in figure 5 and table 3. The relative biological effect (RBE) of protons and different photon radiation types is not considered in the current study, and the enhancement effect is calculated solely based on the addition of GNPs. The survival curve for 'noGNP' for all cases is produced from a homogeneous dose in the nucleus area using α and β values from the photon survival curve.
Table 3. The sensitizer enhancement ratio (SER) of three therapy modalities and four GNP distribution geometries.
| Modality | Position | Nucleu | CellHomo | Complex | Cyto | Media |
|---|---|---|---|---|---|---|
| Protons (1 µM) | SOBP1 | 1.81 ± 4E − 3 | 1.33 ± 1.3E − 2 | 1.045 ± 4E − 3 | 1.018 ± 1E − 3 | 1.001 ± 6E − 6 |
| SOBP2 | 1.81 ± 4E − 3 | 1.34 ± 1.6E − 3 | 1.046 ± 4E − 3 | 1.018 ± 9E − 4 | 1.001 ± 5E − 6 | |
| SOBP3 | 1.81 ± 3E − 3 | 1.34 ± 1.4E − 3 | 1.046 ± 4E − 3 | 1.018 ± 1E − 3 | 1.001 ± 6E − 6 | |
| Pristine BP | 1.93 ± 4E − 3 | 1.33 ± 1.5E − 2 | 1.048 ± 5E − 3 | 1.016 ± 1E − 3 | 1.000 ± 4E − 6 | |
| Kilovoltage photons (100 nM) | 150 kVp | 5.97 ± 2E − 2 | 4.88 ± 0.14 | 2.16 ± 3E − 2 | 1.77 ± 2E − 2 | 1.08 ± 2E − 4 |
| 250 kVp | 5.74 ± 1E − 2 | 4.04 ± 0.15 | 1.86 ± 3E − 2 | 1.56 ± 2E − 2 | 1.06 ± 1E − 4 | |
| 6 MV photons (1 µM) | PDD100 | 4.35 ± 1E − 2 | 2.59 ± 0.12 | 1.23 ± 3E − 2 | 1.08 ± 1E − 2 | 1.004 ± 3E − 5 |
| PDD80 | 5.78 ± 6E − 3 | 4.32 ± 0.25 | 1.47 ± 5E − 2 | 1.14 ± 1E − 2 | 1.006 ± 4E − 5 | |
| PDD50 | 5.89 ± 6E − 3 | 4.74 ± 0.30 | 1.53 ± 7E − 2 | 1.16 ± 2E − 2 | 1.008 ± 4E − 5 |
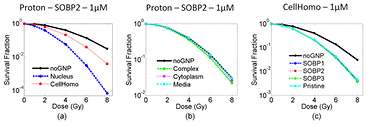
Figure 5. Dose response curves for five GNP distributions for the proton SOBP at the depth of SOBP2. (a) Dose response curve for Nucleus and CellHomo geometry, and (b) dose response curve for Complex, Cytoplasm and Media geometry. (c) Dose response curves for the CellHomo geometry for pristine BP, as well as three depths in the proton SOBP. The GNP concentration is 1 µM.
Download figure:
Standard image High-resolution imageFor all three irradiation modalities, GNPs distributed according to the Nucleus geometry resulted in the highest GNP enhancement. In general, GNPs located inside of the cell nucleus contribute most significantly to the cell killing.
3.3.1. For protons.
The GNP sensitization is not depth dependent, and the interaction probability is nearly the same for the three depth positions along the SOBP and is about 20% less for the pristine BP (table 1). The SER differs less than 10% for all depths and geometries (see table 3). At the center of the SOBP (depth SOBP2, see figure 5(b)), the SER is 1.046 for the Complex geometry and 1.018 for the Cytoplasm geometry. The GNP enhancement increases when more GNPs are internalized into the cell nucleus. The SER is 1.34 for the CellHomo geometry and increases to 1.81 for the Nucleus geometry where all GNPs are internalized inside of the cell nucleus.
3.3.2. For kV photons.
Kilovoltage photons cause significant GNP enhancement at as low as 100 nM GNP concentration. The SER is 5.97 and 4.88 for Nucleus and CellHomo geometry (figure 6(a)). For kV photon, GNP sensitization is more effective for a 150 kVp photon source (SER = 4.88) than a 250 kVp source (SER = 4.04) for the CellHomo geometry (see figure 6(c)). Even when no GNPs are internalized in the cell nucleus, the SER is 1.77 and 1.56 for 150 and 250 kVp x-rays, respectively. In addition, at a GNP concentration of 100 nM in the media, the SER is only 1.08 and 1.06 for 150 and 250 kVp x-rays, respectively, but increased to 1.82 and 1.62 when the concentration increased to 1 µM.

Figure 6. Dose response curves for five GNP distributions for 250 kVp photon beam. (a) Dose response curve for Nucleus and CellHomo geometry, and (b) dose response curve for Complex, Cytoplasm and Media geometry. (c) Dose response curves for the CellHomo geometry for two kilovoltage photon beams. The GNP concentration is 100 nM.
Download figure:
Standard image High-resolution imageFor the proton SOBP at the depth of SOBP2, the SER only increases from 1.001 to 1.008 when the GNP concentration in the media increases from 1 to 10 µM. As shown in figure 4(a), at a distance of 1 μm from the GNP surface the dose induced by the GNP from 250 kVp photons is 10 times more than when using proton irradiation. For instance, the GNP dose from kV photon irradiation is approximately 0.05 Gy per ionization events at 1 µm from GNP surface, while the GNP dose is about 0.005 Gy per ionization for proton irradiation. Therefore, the GNPs present in the media contribute to the cell damage more effectively for kV photons than protons. When the cells are treated with a high concentration of GNPs, sensitization can be achieved for kV photons even without cellular uptake of GNPs.
3.3.3. For MV Photons.
GNP sensitization is more effective at deeper depths. The SER increased from 2.59 at PDD100 to 4.74 at PDD50 for the CellHomo geometry at 1 µM GNP concentration (see figure 7(c)). Like protons, 6 MV photons have a lower interaction probability than the kV photons, and thus we list the SER for 1 µM GNP concentration in table 3.
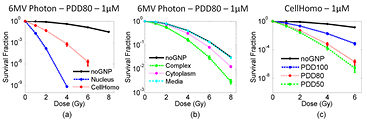
Figure 7. Dose response curves for five GNP distributions for 6 MV photon beam at the depth of PDD80. (a) Dose response curve for Nucleus and CellHomo geometry, and (b) dose response curve for Complex, Cytoplasm and Media geometry. (c) Dose response curves for the CellHomo geometry for the 6 MV photon beam at three depths. The GNP concentration is 1 µM.
Download figure:
Standard image High-resolution image3.4. GNP SER for various GNP sizes
The effect of GNP sizes on radiosensitization in proton beams is shown in figure 8 and table 4. The dose response curve is calculated for proton irradiation at the center of the SOBP (SOBP2) according to the CellHomo geometry. The enhancement reduces with decreasing GNP size when using the same number of GNPs inside a cell because of the difference in the probability of GNP particle interaction for a given particle fluence (see table 2). On the other hand, if the same weight of GNPs is taken up by the cell, smaller GNPs cause more damage. Smaller GNPs have a much higher dose per ionization at their surface due to lower internal absorption of secondary electrons by the GNPs, as shown in figure 4(b). As a result, 10 nm GNPs cause about a factor 3 more damage than the same weight of 50 nm GNPs.
Table 4. Sensitizer enhancement ratio (SER) of three GNP sizes for the CellHomo Geometry compared to the SER of 50 nm GNPs.
| Modality | 50 nm | 2 nm | 10 nm | 20 nm |
|---|---|---|---|---|
| Proton-SOBP2 (1 µM GNP) | 1.33 ± 0.015 | Same number | ||
| 1.00 | 1.008 ± 5E − 3 | 1.039 ± 9E − 3 | ||
| Same weight | ||||
| 3.98 ± 0.24 | 2.56 ± 0.13 | 1.67 ± 0.05 | ||

Figure 8. Comparison of dose response curves using GNPs of four sizes using proton irradiation at the center of the SOBP (SOBP2). The results are compared using either the same weight of GNPs (a) or the same number of GNPs (b).
Download figure:
Standard image High-resolution image3.5. The dependency on the input parameter Dt
We evaluated the impact of the choice of Dt. The dose response curve is calculated for proton irradiation at the center of the SOBP (SOBP2) with 1 µM GNPs distributed according to the CellHomo geometry. 50 and 2 nm GNPs are used for the calculation. The results are shown in figure 9 and table 5. Three values of Dt, i.e. 10, 20 and 30 Gy are compared for proton beams. The results are displayed for 2 nm GNPs and 50 nm GNPs.
Table 5. Sensitizer enhancement ratio (SER) of the 50 nm GNPs and the 2 nm GNPs for different choices of Dt for the CellHomo Geometry at the center of the proton SOBP (SOBP2).
| Dt = 10 Gy | Dt = 20 Gy | Dt = 30 Gy | |
|---|---|---|---|
| 50 nm GNP | 1.28 ± 0.011 | 1.33 ± 0.015 | 1.35 ± 0.015 |
| 2 nm GNP | 3.24 ± 0.19 | 3.88 ± 0.27 | 4.32 ± 0.32 |

Figure 9. Dose response curve of cells irradiated in a proton SOBP. 50 nm GNPs (a) and 2 nm GNPs (b) are considered. The curves correspond to the use of different Dt as the input parameter for the GNP-LEM model. Dt values of 10, 20 and 30 Gy were investigated.
Download figure:
Standard image High-resolution imageThe choice of Dt does not affect the results for 50 nm GNPs significantly (see figure 9(a)). Changes in the SER are within 5% as shown in table 5. However, for 2 nm GNPs the SER increased from 3.24 to 4.32 when Dt increases from 10 to 30 Gy. As shown in figure 4(b), the dose per ionization near the GNP surface for the 2 nm GNPs is more than 100 times higher than the dose for 50 nm GNPs and is in the range of several hundreds or thousands of Gray within several nanometers of the GNP surface. Truncating the LQ model for a linear transition at the lower dose (small choice of Dt) therefore has a higher impact on 2 nm GNPs than 50 nm GNPs.
3.6. GNP sensitization for different cell lines with different α and β values
The radiosensitization for three cell lines with different α and β values were evaluated in the presence of GNPs, while the cell geometry is left unchanged. The three cell lines are: MDA-MB-231 breast cancer cells with α = 0.019 Gy−1, β = 0.052 Gy−2 and α/β = 0.37 Gy (Jain et al 2011), DU145 prostate cancer cells with α = 0.13 Gy−1, β = 0.022 Gy−2 and α/β = 6.0 Gy, and human brain tissue with α = 0.1 Gy−1, β = 0.05 Gy−2 and α/β = 2.0 Gy (Van der Kogel 1986). The dose response curve is calculated for proton irradiation at the center of the SOBP (SOBP2) with 50 nm GNPs distributed according to the CellHomo geometry. As shown in figure 10, the change in SER is about 7% for the three different cell lines, while the survival fraction at 8 Gy is two orders of magnitude smaller for MDA-MB231 and DU145 cells and one order of magnitude smaller for cells from the human brain.
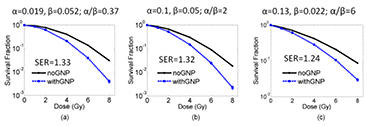
Figure 10. GNP sensitization for three different cell lines with different α and β values assuming 50 nm GNPs distributed according to the complex geometry at the center of the proton SOBP (SOBP2).
Download figure:
Standard image High-resolution image3.7. GNP SER for various GNP concentrations
The results are shown in figure 11. For kV photons, the GNP enhancement increases quickly as the GNP concentration increases. A GNP concentration of 80 and 120 nM is needed to reduce the 2 Gy survival fraction to 0.5 for the Complex and Cytoplasm geometry, respectively.
For 6 MV photons, a GNP concentration of 4.4 µM is needed to reduce the 2 Gy survival fraction to 0.5 for the Cytoplasm geometry. A much lower concentration of 1.3 µM is needed to reduce the 2 Gy survival fraction to 0.5 for the Complex geometry.
For protons, a much higher concentration of GNPs beyond 10 µM is needed to reduce the 2 Gy survival fraction to 0.5 for both Complex and Cytoplasm geometry. However, if the GNP can be internalized into cell nucleus, a GNP concentration of 1.9 µM is needed to reduce the 2 Gy survival fraction to 0.5 for the Nucleus geometry.
4. Discussion
We investigated several potential configurations for GNP induced radiosensitization using a modified LEM based on Monte Carlo simulations. Three particle sources representing three clinically relevant scenarios were studied and compared. We find that kV photon irradiation causes the highest interaction probability with GNPs. A high interaction probability for a given GNP concentration indicates a large number of GNPs are excited and contribute to the dose enhancement. For instance, when delivering a dose of 1 Gy to a cell with the same number of 50 nm GNPs internalized, 2% of the GNPs will interact with a 250 kVp photon beam and only 0.07 and 0.08% of the GNPs will interact with a proton beam in the middle of SOBP (SOBP2) and 6 MV photon beam at the depth of PDD80, respectively. As a result, significant GNP induced cell killing can be observed for kV photons at 100 nM GNP concentration.
In our previous work, we compared the dose enhancement effect for the three particle sources, and investigated the characteristics of secondary electrons of the three particle sources interacting with GNPs. We showed that the mechanism by which GNPs can lead to dose enhancements in radiation differs when comparing photon and proton radiation (Lin et al 2014). The GNP dose enhancement using protons can be up to 14 and is independent of proton energy. The GNP enhancement using proton beams are caused by the higher electrons density in gold. For the same volume of gold and water, the number of electrons differs by approximately 14 times. The previous work only investigated the interaction of GNP and the three particle sources and consequent dose deposition in water. This work links the spatial dose deposition in water with the biological end point, the survival curve. We demonstrated in this work the effect of biological GNP enhancement is dependent on various parameters, such as the size of GNP, location of GNPs with respective to the cell nucleus, and concentration.
The photon and proton beam spectrum investigated in this study represents reasonable characteristics for three treatment modalities but do not cover all possible beam conditions for all treatment parameters. For instance, for kV photon beam, the filter material and thickness will change the quality of the photon beam. For MV photon, using a larger field size increases dose and softens the beam as the contribution from laterally scattered photons increases. We investigated several parameters that affect the GNP enhancement such as the depth of treatment and kilovoltage photon energy.
We find that for the same weight of internalized GNPs, 2 nm GNPs give the largest enhancement (see table 3). This effect is due to a higher fraction of low energy electrons escaping from the GNP and contributing to the local dose enhancement (figure 4(b)). However, the size of the GNPs is an important factor determining cellular uptake. It has been shown that 50 nm GNPs have the best cellular uptake in terms of both weight and number (Chithrani et al 2006, Chithrani, 2010). Therefore, having a smaller GNP size may not be superior despite the higher dose per ionization each GNP produces if the smaller GNPs do not reach the same weight concentration as 50 nm GNPs.
In our current study, the relative biological effect of clinical protons is not taken into account. The survival curve for 'noGNP' for both proton and photon sources are produced from a homogeneous dose in the nucleus area using α and β values from the photon survival curve. In clinical practice, a generic RBE of 1.1 for proton treatment is used (Paganetti et al 2012). When a RBE of 1.1 is applied for proton beam, the particle fluence is reduced for the same biological damage. This will result in a further reduced interaction probability between protons and GNPs per Gray. However, the purpose of not applying RBE is to investigate the enhanced cell killing due to the addition of GNP alone.
Due to the longer range of electrons generated by kV photon beams compared to proton irradiation (see figure 4(a)), the GNPs in the media space can still contribute to direct DNA damage for kilovoltage photon irradiation. This is not the case for proton therapy, where the cellular uptake is crucial to bring GNPs in close proximity to the nucleus. The dose per ionization for GNPs irradiated by protons is high in close proximity to the GNPs, thus significant DNA damage can be expected if the GNPs are internalized inside the cells. One should also note that we considered that damage is solely caused by dose to the cell nucleus in our calculation. There are possible non-DNA targets and other GNP induced cellular stresses that can cause a decrease in cell survival in the presence of GNPs as shown in literature (Jain et al 2013, Taggart et al 2014).
Further, we only investigated a simplified cell geometry although a wide range of cell sizes and nucleus sizes exists for various cell lines (Zhao et al 2008, Jiang et al 2010, Jain et al 2011, Coulter et al 2012). Changing some of the geometric parameters used here may alter the results. For instance, having the same nucleus size but a larger cell size would result in less damage compared to a smaller sized cell if the GNPs are only present in the media due to the increased distance between the GNPs and the DNA. Similarly, a cell with a compact cytoplasm space would produce more DNA damage due to the now shorter distance between the GNPs and the nucleus. Nevertheless, our results can serve as qualitative estimates.
The GNP-LEM used in our work is a 2D computation model. Cells in culture usually appear flat when they are attached to the petri dish, which makes a 2D model suitable. The reduction of the third dimension leads to a small increase in predicted dose deposition. However, the effect does not alter our conclusion significantly because it only affects the dose to a small portion of the nucleus area that is in close proximity to GNPs (<100 nm).
The accumulation of GNPs within tumor cells enhances cell killing. However, the presence of GNPs also creates a dose shading effect due to the high absorption cross-section of gold. Several studies have investigated the feasibility of taking the effect into account in clinical treatment plans for photon sources (Cho et al 2009, Ngwa et al 2011). Though this is beyond the scope of this work, the same shading effects should also be investigated using clinical proton treatment planning system.
Finally, the LEM has one critical assumption for our application simulating GNP sensitization: the dose Dt at which the LQ curve transits to a linear curve is an empirical value. We investigated the change of the Dose response curve using Dt ranging from 10 to 30 Gy. We found a strong dependence for 2 nm GNPs. A strong dependence on the choice of Dt has also been shown previously (Paganetti and Goitein 2001). Nevertheless, even though the absolute survival fraction value is dependent on the choice of Dt, our study is designed to compare different particle sources and cellular uptake scenarios, and thus our results are still valid qualitatively.
5. Conclusions
We established a biological model and investigated the radiosensitizing effect of GNPs using proton beams and compared the results to kV and MV photon beams. The interaction probability between GNPs and proton beams is of the same order as for 6 MV photon beams; kV photons have the highest interaction probability. Secondary electrons produced by protons have a much shorter range in water compared to photons, e.g. they cause a dose enhancement 30 times lower than that caused by kilovoltage photons at a distance of 10 μm from the GNP surface. We concluded that if the GNPs cannot be internalized into the cytoplasm, no GNP enhancement will be observed for proton treatment. When internalized into the cytoplasm, our model predicts a smaller sensitization after a given dose from a proton treatment than when treated with a kVp and MV photon beam. If GNPs can be internalized into the cell nucleus, a significant increase in sensitization is seen for all modalities.

Figure 11. The 2 Gy survival fraction as a function of the GNP concentration for (a) a proton SOBP (at depth of SOBP2), (b) a 6 MV photon beam (at the depth PDD80) and (c) a kilovoltage photon beam (250 kVp).
Download figure:
Standard image High-resolution image