Abstract
Breast-conserving surgery (BCS) is increasingly employed for the treatment of early stage breast cancer. One of the key challenges in BCS is to ensure complete removal of the tumour while conserving as much healthy tissue as possible. In this study we have investigated the potential of Raman micro-spectroscopy (RMS) for automated intra-operative evaluation of tumour excision. First, a multivariate classification model based on Raman spectra of normal and malignant breast tissue samples was built and achieved diagnosis of mammary ductal carcinoma (DC) with 95.6% sensitivity and 96.2% specificity (5-fold cross-validation). The tumour regions were discriminated from the healthy tissue structures based on increased concentration of nucleic acids and reduced concentration of collagen and fat. The multivariate classification model was then applied to sections from fresh tissue of new patients to produce diagnosis images for DC. The diagnosis images obtained by raster scanning RMS were in agreement with the conventional histopathology diagnosis but were limited to long data acquisition times (typically 10 000 spectra mm−2, which is equivalent to ~5 h mm−2). Selective-sampling based on integrated auto-fluorescence imaging and Raman spectroscopy was used to reduce the number of Raman spectra to ~20 spectra mm−2, which is equivalent to an acquisition time of ~15 min for 5 × 5 mm2 tissue samples. This study suggests that selective-sampling Raman microscopy has the potential to provide a rapid and objective intra-operative method to detect mammary carcinoma in tissue and assess resection margins.
Export citation and abstract BibTeX RIS

Content from this work may be used under the terms of the Creative Commons Attribution 3.0 licence. Any further distribution of this work must maintain attribution to the author(s) and the title of the work, journal citation and DOI.
1. Introduction
Breast cancer is the most common cancer and second leading cause of cancer-related death among women. Every year more than 430 000 new cases are diagnosed in Europe (Ferlay et al 2007) and 250 000 in the USA (Bandi et al 2009). Breast cancer has also a high economic cost, being the second most expensive cancer in Europe (~€15.0 billion in 2009) (Luengo-Fernandez et al 2013). Although systemic therapy is based on prognostic and predictive markers, complete removal of cancer with or without radiotherapy is the standard treatment for all cases. Breast-conserving surgery (BCS) is now a commonplace surgical technique for the treatment of early stage cancers (58% in the UK (Jeevan et al 2008) and 60–75% in the USA (Katipamula et al 2009)). BCS aims to remove the tumour but at the same time conserve as much healthy breast tissue as possible. However, one of the main challenges in BCS is the detection of tumour margins during surgery. Preoperative imaging by established oncology imaging techniques (CT or MRI) does not suffice to guide the surgeon to ensure clear margins. Negative margins have been directly associated with lower local recurrence rates. An early study showed that the tumour recurrence rate was as high as 18.2% if positive margins were not re-excised, while the recurrence rates dropped to 3.7% when negative margins were confirmed (Spivack et al 1994). Therefore, the detection of positive margins triggers another surgical intervention, which varies from excision of the positive margin shaves to mastectomy. Recent reports indicate that 11 032 out of the 55 297 of the patients treated by BCS in England during April 2005–March 2008 required secondary surgery (Bennet 2012) while re-excision among women estimates ranged from 30%–60% in the USA (Waljee et al 2008). Thus, the availability of fast and objective techniques that would allow intraoperative assessment of tumour margins and ensure complete removal of the tumour can significantly reduce the rates of secondary surgery. However, frozen section pathology and cytology require lengthy sample preparation procedures that make intra-operative assessment of the entire resection surface impractical for breast conserving surgery. The current methods of visual or x-ray inspection of the excised specimens do not have sufficient diagnosis accuracy (Ellis et al 2005).
Raman micro-spectroscopy (RMS) is an optical imaging technique based on inelastical light scattering that can provide both morphological and biochemical contrast between healthy and tumour tissues (Kendall et al 2009, Diem et al 2013). RMS relies on intrinsic molecular contrast and diagnosis can be obtained without tissue sectioning and staining. RMS has been used to detect tumours with typical sensitivity and specificity higher than 90% for a wide range of tissues, including breast tissues (Haka et al 2005, 2006, 2009). A hand-held probe based on Raman spectroscopy has also been developed for in-vivo single-point Raman spectra during breast cancer surgery (Haka et al 2006, 2009). The feasibility of using transmission Raman spectroscopy for non-invasive identification of calcification types in phantom samples was also reported, showing the potential for in-vivo diagnosis of breast cancer (Stone and Matousek 2008).
However, the main limitation of RMS for detection and imaging of tumours during surgery is that the raster-scanning methods used to build Raman spectral images for accurate tumour diagnosis in tissue specimens obtained during surgery is extremely slow (more than 5 h mm−2) (Kong et al 2013). Therefore, most Raman spectroscopy studies of tissues based on raster scanning have been restricted to imaging tissue areas less than 1–2 mm (typical acquisition times of several hours) (Kendall et al 2009, Diem et al 2013). Although hand-held Raman spectroscopy probes have been developed for guided biopsy and intra-operative diagnostic of breast tumours (Haka et al 2005), these probes rely on single-point spectral measurements and have large sampling errors. While several methods to increase the speed of RMS have been proposed, including line-mapping (Hutchings et al 2009), selective sampling based on interpolation of spectral features (Rowlands et al 2012) or coherent Raman scattering (Yang et al 2011), these methods do not provide sufficient speed up, require a trade off in diagnosis accuracy (under-sampling or limited spectral bands) or are based on subjective interpretation of images rather than quantitative classification models. Recently, selective-sampling based on integrated auto-fluorescence imaging and Raman scattering was developed to increase the diagnosis speed for basal cell carcinoma (BCC) by a factor higher than 100 compared to raster-scanning RMS (Kong et al 2013). Auto-fluorescence imaging, which has high speed and high sensitivity but low specificity for tumour diagnosis, was used for rapid estimation of the spatial features of the tissue sample, then this information was used to determine the necessary sampling points for Raman spectroscopy measurements. Using this sampling strategy, objective diagnosis of large skin tissue samples (i.e. 1 × 1 cm2) obtained during Mohs micrographic surgery of BCC was obtained with only 500–1500 Raman spectra (20–60 minutes) without requiring tissue sectioning or staining (Kong et al 2013).
In this study we report the development of a multivariate spectral classification model based on Raman microscopy for diagnosis of mammary carcinomas and investigate the feasibility of multimodal spectral imaging based on auto-fluoresce imaging and selective-sampling Raman microscopy for providing diagnosis of large breast tissue samples within time-scales compatible with intra-operative use for breast conserving surgery.
2. Materials and methods
2.1. Patients and tissue samples
All breast tissue samples (from 60 patients) were provided by the Nottingham Health Science Biobank and were obtained during routine breast cancer surgery at the Nottingham University Hospitals National Health Service (NHS) Trust. Tissue sections were cut from blocks removed during surgery into 20 µm sections. The samples were kept frozen at −20 °C until used for Raman spectral measurements. Adjacent tissue sections (7 µm) were stained by haematoxylin and eosin (H&E) and the diagnosis was provided by two histopathology consultants. Only samples for which the diagnoses provided by the two histopathologists agreed were included in the study.
2.2. Raman micro-spectrometer
The Raman spectra were recorded using a custom-built Raman micro-spectrometers based on an inverted optical microscope (Eclipse-Ti Nikon) with an automated sample stage (H107 with Proscan II controller, Prior Scientific) and a 50 × / 0.55 objective (Leica), 785 nm laser (Starbright XM Torsana, power 100 mW at sample surface), 77 200 Oriel spectrograph equipped with a deep-depletion back-illuminated cooled CCD (DU401-A-BR-DD, Andor Technology). The acquisition time for the Raman measurements was 2 s per position. The spectrometer was calibrated using naphthalene and 1,4-bis(2-methylstyryl) benzene samples (both from Sigma-Aldrich, UK) to an accuracy of 0.5 cm−1. The auto-fluorescence images of tissue sections were measured using a wide-field fluorescence imaging system integrated to the Raman microscope: 365 nm high-power LED (Thorlabs), CCD camera (01-QIClick-F-M-12 Mono, QImaging) and fluorescence filters (Semrock, DAPI-5060 C-NTE-ZERO). A 10 × / 0.25 objective (Leica) was used to obtain the fluorescent images with 500 ms integration time. A number of images were stitched into a single tissue image.
2.3. Spectral classification model
Raman spectral maps were recorded from tissue sections deposited on MgF2 discs by raster scanning with 5 or 10 µm step sizes (total 10 000 spectra per sample). The following pre-processing procedures were applied to all Raman spectra: removal of cosmic-ray peaks, subtraction of the background Raman signal of the microscope objective and MgF2 substrate, subtraction of a baseline based on a rubber band method (the rubber bands were chosen between the regions 750–850 cm−1, 855–950 cm−1, 951–1050 cm−1, 1135–1254 cm−1, 1488–1600 cm−1, 1675–1750 cm−1), and normalisation to zero mean and unit variance. For each spectral map a 3 × 3 moving average filter was applied and followed by a two-step k-means clustering, with k1 = 6, k2 = 10. After the Raman spectral measurements, the analysed tissue section was compared with the adjacent H&E-stained section and the tissue structures were identified by the histopathology consultants. The pseudo-colour spectral images obtained by k-means clustering were correlated with the tissue structures revealed by the H&E images. The centroid spectra of every cluster containing at least 10 measurement sites was included in the database and labelled using the following five classes: ductal carcinoma of non-specific type (DC NST), tumour-surrounding inflammatory stroma (Infl. Stroma), lobules and ducts, stroma, and fat. A maximum of 5 centroid spectra per class per sample were included in the database. For the classification model, a total number of 230 000 Raman spectra were recorded from 45 patients. After the k-means clustering, 627 centroid spectra were used in the classification model: 229 for DC-NST, 95 for tumour-surrounding inflammatory stroma, 51 for lobules and ducts, 151 for stroma, and 101 for fat.
Several data reduction methods (principal components followed by the multi-class linear discriminant analysis (LDA) rank reduction to obtain four features for each spectrum) and classification techniques (LDA, quadratic discriminant analysis, multinomial logistic regression (MNLR) were compared based on a 5-fold cross-validation algorithm. All classifiers were tuned to the regime providing 95% sensitivity on the training data. Hence, the classification model was set for 95% sensitivity level as first priority for DC-NST, and second priority for tumout-surrounding inflammatory stroma. The rest of classes were detected at their maximum level of probability without any prioritisation.
2.4. Raster-scanning spectral imaging and diagnosis of breast tissues
The Raman spectra from a selected region of the tissue were acquired at 5 or 10 µm steps. After pre-processing, all spectra were analysed by the two-step k-means clustering algorithm to identify the tissue regions. The diagnosis of each region in the pseudo-colour spectral image was obtained by applying the classification model to the centroid spectrum of each cluster.
2.5. Multimodal spectral histopathology (MSH)
For each tissue section, the auto-fluorescence intensity images corresponding to collagen (excitation 365 nm/emission 447 nm) were segmented using an unsupervised segmentation algorithm (O'Callaghan and Bull 2005) and Matlab code developed by Naidu (Naidu 2010). The edge pixels of the segments were trimmed off in order to avoid sampling points for Raman spectral measurement at the segment boundaries. To avoid the out-of-focus problem in Raman spectroscopy, the measurements were divided based on a 3 × 3 grid, and focusing was manually adjusted at each region. Segments smaller than 0.02 mm2, normally found within the stroma, were ignored and were labelled as stroma without any Raman measurement. The following pre-processing was applied to the Raman spectra: removal of cosmic-ray peaks, subtraction of the background and baseline, normalisation to zero mean and unit variance, followed by de-noising based on an independent set of Raman spectra from five patients (40 000 spectra) using principle component analysis with 50 loadings (Marcsisin et al 2012, Kong et al 2013). The classification model was applied on each individual spectrum and the diagnosis of each segment was based on majority-voting. A segment was diagnosed as DC NST or tumout-surrounding inflammatory stroma if at least two spectra were classified as belonging to these classes. For spectra for which the classification uncertainty as measured by the Shannon entropy was 5% higher than the maximum value (i.e. log K, where K = 5 is the number of classes) were labelled as 'Unknown' (most unknown spectra were found to correspond to holes in the tissue).
3. Results and discussion
3.1. Classification model for objective diagnosis of breast tumours based on Raman spectra
The first step in the development of the spectral classification model for breast tumours was to establish a method to assign the measured Raman spectra to the correct tissue structures in the breast tissue samples. Figure 1 shows typical examples of breast tissue samples containing ductal carcinoma of no special type (DC NST) and normal tissue. By comparing the pseudo-colour images obtained by k-means clustering of the Raman spectra with the histopathology image obtained by H&E staining, the centroid spectra for each cluster were assigned a label corresponding to tumour (invasive carcinoma) or normal breast tissue (fibro-fatty tissue and parenchyma). The centroid Raman spectra show that significant differences can be detected between Raman spectra of tumours and normal tissue that originate from their different molecular compositions.
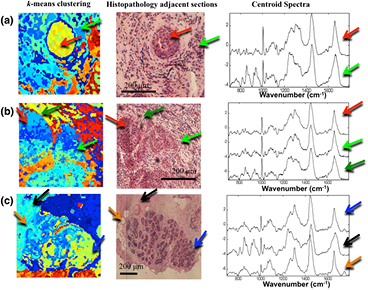
Figure 1. Assigning the Raman spectra to tissue structures and ductal carcinoma by two-step k-means clustering: (a) and (b) samples with invasive ductal carcinoma, (c) normal breast tissue. Typical centroid Raman spectra are shown for the clusters indicated by arrows: focus of invasive ductal carcinoma (red arrows), tumour-surrounding inflammatory stroma (green arrows), lobules and ducts (blue arrows), stroma (black arrows) and fat (orange arrows).
Download figure:
Standard image High-resolution imageFigure 2(a) presents the mean of the Raman spectra corresponding to ductal carcinoma no special type (DC NST), surrounding inflammatory stroma (Infl. Stroma), lobules and ducts, stroma and fat. The results show that the Raman spectra of DC have more intense spectral bands assigned to nucleic acids (788 cm−1, 1098 cm−1) compared to other tissue structures, while the Raman spectra of stroma are dominated by intense bands assigned to collagen fibres (851 and 950 cm−1). These findings are consistent with the H&E images showing a higher number of cells with enlarged nuclei in the tumour regions (figure 1), and with the Raman spectra of other tumour types reported in the literature, such as basal cell carcinoma (Nijssen et al 2002, Larraona-Puy et al 2009, Kong et al 2013), bladder (de Jong et al 2006), oesophagus (Shetty et al 2006) or cervical cancers (Lyng et al 2007). The fat regions showed specific Raman bands characteristic to lipids (850 cm−1, 1070 cm−1, 1267 cm−1, 1301 cm−1, 1450 cm−1, ~1660 cm−1) (Tu 1982). The Raman spectra of tumour-surrounding inflammatory stroma were found to have lower intensity bands corresponding to collagen and higher intensity for the bands assigned to nucleic acids compared to the Raman spectra of normal stroma.
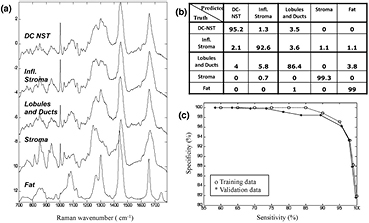
Figure 2. (a) The mean Raman spectra of the healthy breast tissue structures and tumours: ductal carcinoma of non specific type (DC-NST), tumour-surrounding inflammatory stroma (Infl. Stroma), lobules and ducts, stroma and fat. (b) The confusion matrix for the 5-fold cross-validation (at target 95% sensitivity for both DC). The calculated sensitivity was 95.6% and specificity 96.2% 9 (at target 95% specificity). (c) Receiver operating characteristic for the classification model (ductal carcinoma and surrounding inflammatory stroma versus all other classes combined).
Download figure:
Standard image High-resolution imageSeveral spectral classification models were tested based on various data reduction and statistical classification methods, and were optimised for diagnosis of DC NST as first priority and tumour-surrounding inflammatory stroma as second priority. These two classes were grouped together in the first step of classification because of the clinical relevance and high similarities between the Raman spectra. The best performance for detection of tumours (highest specificity when sensitivity was set at 95%) and consistence between the training and validation datasets was obtained when 10 principal components of the raw spectra were further reduced to K − 1 (with K = 5 being the total number of tissue classes) canonical features using the rank-reduced multi-class linear discriminant analysis, then used with the multinomial logistic regression classifier. At a target sensitivity of 95%, the cross-validation results indicated 95.6% sensitivity and 96.2% specificity for classification of DC NST and the surrounding inflammatory stroma. The confusion matrix for the cross-validation is shown in the figure 2(b). The most misclassifications occurred between the 'lobules and ducts' class and DC. It is worth noting that the specificity was not affected by misclassification between DC-NST and tumour-surrounding inflammatory stroma. The receiver-operating characteristic (ROC) is presented in figure 2(c), and it shows consistency between the training and validation dataset, with the validation accuracy slightly less training accuracy, as this is expected for the cross-valuation. The specificity for DC diagnosis decreases from about 100% at 85% sensitivity to 82% at 100% sensitivity. The area under the ROC curves for the training set is 0.994, and validation set is 0.973.
3.2. Imaging and diagnosis of ductal carcinoma by raster-scanning Raman micro-spectroscopy
Although raster-scanning requires long acquisition time that are impractical for intra-operative diagnosis, we first established the full capabilities of Raman microscopy to image and diagnose DC for independent tissue samples under this idealised setting. Figure 3 presents the diagnosis images for five independent breast tissue samples (four positive and one negative) when the target sensitivity of the classification models was set at 95%. The results show that the tumour regions were correctly diagnosed by the classification model, confirming the high sensitivity and specificity of Raman spectroscopy to detect molecular changes in tissue related to mammary invasive carcinoma. As the corresponding specificity of the classification model was ~96%, for each sample (60 clusters per sample) we expected, on average, 2.4 clusters corresponding to healthy tissue to be misclassified as DC (false positives). Such misclassifications can be observed for example in the diagnosis images in figure 3(b), where epithelium regions were mislabelled as ductal carcinoma or tumour-surrounding inflammatory stroma (blue arrows). In certain tissue samples, 100% specificity for tumour was observed, as shown in figure 3(e).

Figure 3. Examples of quantitative diagnosis by Raman micro-spectroscopy using raster scanning. (a–d) breast tissue samples containing DC. (e) DC-negative breast tissue sample. The histopathology images for adjacent sections are included for comparison. False positives are indicated by blue arrows.
Download figure:
Standard image High-resolution image3.3. Multimodal spectral histopathology (MSH)
To reduce the data acquisition time associated with the raster-scanning, tissue auto-fluorescence imaging can be used to determine the main spatial features a tissue sample, and this information is then used to select and prioritise the sampling points for Raman spectroscopy (Kong et al 2013). To evaluate this sampling strategy, multimodal spectral histopathology (MSH) was compared with raster scanning Raman microscopy images using 2 × 2 mm2 tissue regions containing DC and other tissue structures. Figure 4(a) shows that the auto-fluorescence imaging has high sensitivity for detection of tumours (blue arrows) as tumours can be well delineated. However, the specificity of tissue auto-fluorescence is low, as other tissue structures with low collagen content, such as epithelium and fat, also elicit similar auto-fluorescence intensity to DC. Rather than using the auto-fluorescence intensity for diagnosis, the unsupervised image segmentation algorithm (O'Callaghan and Bull 2005, Naidu 2010) was used to divide the auto-fluorescence image into segments and determine the structural pattern of the tissue sample as shown in figure 4(b). For every segment, a space-filling algorithm was used to generate 5 sampling locations for the Raman spectral measurements. Figure 4(c) shows that after the segmentation of the 2 × 2 mm2 tissue region into 117 segments, only 585 Raman spectral measurements were required to obtain a correct diagnosis of the tissue sample. Figure 4(d) shows that the diagnosis images obtained by raster scanning Raman spectroscopy and MSH were in agreement with the histopathology diagnosis based on the H&E-stained adjacent section (figure 4(e)). However, in this case, MSH provided a dramatic decrease in the acquisition time as it required 68-fold fewer Raman spectra compared to raster scanning, while providing a similar diagnosis accuracy for DC. A slight drop in diagnosis accuracy was observed in the MSH image compared to raster scanning, which was attributed to the fact that in MSH the classification model was applied to individual Raman spectra, which had lower signal-to-noise ratio compared to the centroid spectra used for the classification of the raster-scanning images.

Figure 4. Comparison between DC diagnosis obtained by MSH and raster scanning Raman spectroscopy: (a) use of tissue auto-fluorescence images to determine sampling points for Raman spectroscopy measurements in MSH; (b) segmented image with sampling points for Raman spectral measurements. (c) MSH diagnosis obtained with Raman 585 spectra as indicated in the segmented image; (d) diagnosis obtained by 200 × 200 raster-scanning Raman spectroscopy (40 000 spectra); (e) histopathology image of the adjacent tissue section. Scale bars: 0.5 mm.
Download figure:
Standard image High-resolution imageThe selective-sampling was then implemented to provide diagnosis of eight new independent breast samples. Typical examples of diagnosis of ductal carcinoma are presented in figure 5. While the number of Raman spectra required for the diagnosis of the tissue samples depended on the size and structural complexity of the samples, the results show that for typical 5 × 5 mm2 samples, accurate diagnosis by MSH can be obtained with ~500 Raman spectra. For the target 95% sensitivity level, the multimodal spectral histopathology successfully detected the tumours in all analysed tissue samples.

Figure 5. Typical examples of MSH diagnosis of ductal carcinoma in breast tissue samples. The number of Raman spectra measured for every sample is included in the segmented auto-fluorescence (AF) images. Histopathology images for adjacent sections are included for comparison.
Download figure:
Standard image High-resolution image
For our laboratory-based instrument, the acquisition time for the auto-fluorescence images was 4 min and integration time for each Raman spectrum was 2 s. Using these estimates, the diagnosis time for MSH was 20 min, which is shorter than the typical diagnosis time by frozen section histopathology. However, as the MSH diagnosis is no longer limited by the time-consuming tissue sectioning and staining, the development of an optimised prototype instruments using optimised high speed Raman microscopes (e.g. integration time per spectrum of 0.2–0.5 s/spectrum) could allow intra-operative assessment of larger breast resections (~2 × 2 cm2) within 10–15 minutes. The key advantage of MSH over other techniques is that the diagnosis is objective and can be obtained without any tissue preparation (sectioning and staining).
4. Conclusions
In this study we have showed that Raman spectroscopy is a powerful technique for imaging ductal carcinoma (DC) in breast tissue samples. The classification model based on Raman spectra of normal breast tissue samples and samples with mammary tumours provided diagnosis of ductal carcinoma with 95.6% sensitivity and 96.2% specificity. To reduce the long data acquisition time associated to raster-scanning Raman microscopy, a selective-sampling strategy was developed based on integrated auto-fluorescence imaging to generate sampling points for Raman spectroscopy. This sampling strategy allowed diagnosis of DC in large breast tissue samples (e.g. 5 × 5 mm2) with only ~500 spectra, which based on our instrument (integration time 2 s/spectrum) is equivalent to ~17 min. However, the development of optimised Raman spectrometers with shorter integration time could reduce further the diagnosis times, providing a unique tool for intra-operative assessment of resections without requiring tissue sectioning, fixation or staining. This study demonstrates the potential of Raman spectroscopy for providing fast and objective feedback to the surgeon on whether the entire tumour has been excised and whether further tissue removal is required or not. Apart from diagnosis of mammary carcinomas, this technique may be also developed for fast intra-operative assessment of sentinel axillary lymph node biopsies during breast cancer surgery.
Acknowledgements
This paper presents independent research commissioned by the National Institute for Health Research (NIHR) under its Invention for Innovation (i4i) Programme (grant number II-AR-0209-10012). The views expressed are those of the author(s) and not necessarily those of the NHS, the NIHR.