Abstract
Proton and ion beams open up new vistas for the curative treatment of tumors, but adequate technologies for monitoring the compliance of dose delivery with treatment plans in real time are still missing. Range assessment, meaning the monitoring of therapy-particle ranges in tissue during dose delivery (treatment), is a continuous challenge considered a key for tapping the full potential of particle therapies. In this context the paper introduces an unconventional concept of range assessment by prompt-gamma timing (PGT), which is based on an elementary physical effect not considered so far: therapy particles penetrating tissue move very fast, but still need a finite transit time—about 1–2 ns in case of protons with a 5–20 cm range—from entering the patient's body until stopping in the target volume. The transit time increases with the particle range. This causes measurable effects in PGT spectra, usable for range verification. The concept was verified by proton irradiation experiments at the AGOR cyclotron, KVI-CART, University of Groningen. Based on the presented kinematical relations, we describe model calculations that very precisely reproduce the experimental results. As the clinical treatment conditions entail measurement constraints (e.g. limited treatment time), we propose a setup, based on clinical irradiation conditions, capable of determining proton range deviations within a few seconds of irradiation, thus allowing for a fast safety survey. Range variations of 2 mm are expected to be clearly detectable.
Export citation and abstract BibTeX RIS

Content from this work may be used under the terms of the Creative Commons Attribution 3.0 licence. Any further distribution of this work must maintain attribution to the author(s) and the title of the work, journal citation and DOI.
1. Introduction
Proton and ion beams provide new and promising opportunities for the treatment of cancer (Haberer et al 1993), but adequate technologies for monitoring the compliance of dose delivery with treatment plans in real time are still missing. A real time verification of the particle range during dose delivery (treatment) is a continuous challenge limiting the full potential of particle therapies.
A comprehensive review of in-vivo range verification methods in proton therapy is given by Knopf et al (2013). A promising approach for on-line monitoring of the treatment is the utilization of high-energy photons, a byproduct of proton therapy. There are two kinds of photons that can be used as a signal for treatment monitoring.
- (a)The measurement of coincident annihilation photons resulting from decays of positron emitters produced by the therapy beam, called particle therapy positron emission tomography (PT-PET) was studied under clinical conditions (Enghardt et al 2004, Parodi et al 2007). However, the delayed decay of the β+ emitters and the corresponding metabolic washout prohibits quantitative dose reconstruction. A comprehensive review on the utilization of PT-PET is given by Fiedler et al (2012).
- (b)The second type of photons are γ-rays emitted promptly in nuclear interactions between incident protons and target nuclei. The utilization of prompt γ-rays for particle range control was proposed by S Jongen and F Stichelbaut at 2003 PTCOG meeting. Min et al (2006) firstly provided experimental evidence concerning this method. In the following it is denoted as prompt γ-ray imaging (PGI). A major advantage of prompt γ-rays is the real-time information due to the instantaneous nuclear de-excitation. Polf et al (2013) presented characteristic prompt γ-ray spectra and found an accurate agreement between measured and Geant4 based simulated spectra. Several concepts for range monitoring utilizing prompt γ-rays are under consideration. A direct measurement approach is a passively collimated prompt γ-ray camera (Min et al 2012, Smeets et al 2012). The introduction of time-of-flight (TOF) techniques (Testa et al 2010) improved the signal to noise ratio due to the separation of prompt γ-rays from those produced in reactions of neutrons with the target tissue or with surrounding materials. Electronically collimated systems such as Compton cameras are also under investigation (Kormoll et al 2011, Richard et al 2011, Llosá et al 2012, Mackin et al 2013). However, these systems require a tremendous electronic expense and still lack in the low efficiency of useable events.
PT-PET has been integrated in clinical workflows but has never been used on a routine base except for clinical studies. This is basically due to the limited benefit (no real-time information) at a comparatively large effort (huge multi-detector systems with complex electronics). PGI has not yet been demonstrated to be successful in clinical environments, there are still unsolved technical challenges.
In this paper we outline a novel method for on-line range verification based on prompt γ-ray timing (PGT) spectroscopy. These PGT spectra are distributions of the time difference between a reference time, denoting the passage of the particle bunch through a reference plane (e.g. the target entrance of the beam) and the prompt γ-ray arrival time at a detection system. PGT distributions encode information on the proton range via the finite and measurable, however range dependent proton transit time through the irradiated target. The paper proves, that this proton transit time is directly correlated to and measurable by statistical moments like mean μ and standard deviation σ of PGT spectra, although measurement uncertainties may cover this effect at first sight.
This paper is organized as follows. In section 2 we outline the kinematical considerations for charged particles decelerated in matter. We derive the energy-dependent (i.e. range-dependent) correlations of energy loss, penetration depth, and particle transit time. Based on the kinematics we describe the consequences on time profiles of prompt γ-ray emission, as these timing emission profiles are the basis of PGT. Section 3 describes a retrospective analysis of proton irradiation experiments performed at KVI-CART at the University of Groningen, The Netherlands. We present the setup used to measure PGT spectra. Furthermore we outline a Monte Carlo modeling algorithm that translates the prompt γ-ray emission kinematics described in section 2 to the experimental measurement setup. In section 4 we present the results and show an excellent agreement between experiment and model. Motivated by this conformity, we model a proposed measurement setup based on clinical treatment conditions and demonstrate that the PGT approach allows for a precise assignment of the proton transit time and thus the measurement of the proton range.
2. The concept of prompt γ-ray timing
2.1. General
The novel concept of range assessment utilizes an elementary physical effect: relativistic therapy particles penetrating tissue move very fast, but nevertheless they need a measurable time from entering the patient's body until they reach the target volume, i.e. the region of maximum energy deposition (Bragg peak). This particle transit time is about 1–2 ns in case of protons with a range of 5–20 cm. Prompt γ-rays may be emitted along the particle track in tissue. A γ-ray detection system situated outside of the target shall measure the time difference between the time of particle bunch passing a reference plane, e.g. the entrance of the irradiation target, and the arrival time of the corresponding prompt γ-ray at the detector. This time difference incorporates the particle transit time through the material tp, as well as the flight time tγTOF of the prompt γ-ray to the detector (figure 1). We define this time distribution as prompt γ-ray time (PGT) spectrum.
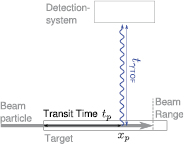
Figure 1. Sketch of prompt γ-ray emission during particle irradiation. A particle beam of fixed initial energy is irradiating a target. A prompt γ-ray is emitted along the beam track at position xp. The time tp has elapsed since the corresponding particle entered the target. The emission of the prompt γ-ray is assumed to be instantaneous. The prompt γ-ray time of flight tγTOF is necessary for the γ-ray to reach the detector. A detection system, situated outside of the target is measuring the time difference between the time of the particle entering the target and the arrival time of the prompt γ-ray at the detector. The measured distribution is denoted as prompt γ-ray timing (PGT) spectrum.
Download figure:
Standard image High-resolution imageThis configuration is similar to usual time of flight (TOF) measurements for prompt γ-rays. However, it is important to notice that the particle transit time correlation tp(xp) has a crucial effect on the shape of the PGT spectrum. The influence of the prompt γ-ray TOF tγTOF is determined by the position of the detection system with respect to the beam direction. However, for the PGT analysis approach this is not the dominating effect.
The particle transit time relation tp(xp) within the irradiation material is range dependent. Particles with a longer range have to travel a longer path and thus need more time. This means a longer period of (potential) prompt γ-ray emission and on average also a delayed emission time. In the corresponding PGT spectrum, this is reflected in a broader prompt γ-ray peak as well as in a distinct peak shift. PGT statistical moments such as the distribution mean μ and the standard deviation σ thus contain information on the particle transit time, even if the PGT spectrum is smeared out by other effects, such as particle bunch spread or detector time resolution. Some simple estimates, presented below, disclose that range differences of a few millimeters cause FWHM (full width at half maximum) increments and peak shifts which can be detected and quantified in PGT spectra of reasonable statistics measured for instance with common scintillation detectors within a few seconds of irradiation. The proposed method provides a handle for fast, robust, and very simple range assessment at minimum expense, solely based on straight time spectroscopy with a single γ-ray detector of reasonable efficiency and time resolution.
In the following paragraph we describe the kinematics of particles decelerated within an irradiated target, i.e. the correlation between particle energy Ep, position xp and particle transit time tp. In section 2.3 we outline the emission of prompt γ-rays along the particle track and the consequences on PGT spectra. We focus our analysis to protons. However, the kinematical considerations also apply for the irradiation with other ions.
2.2. Kinematics
A particle of initial kinetic energy E0 traveling in one dimension may enter a material of mass density ρ(x) at position x0 = 0 and time t0 = 0. As depicted in figure 2, the particle is decelerated along the beam path according to the stopping power S(Ep) of the material (NIST 2014), where Ep denotes kinetic energy of the particle. The particle position is described with xp.

Figure 2. Exemplary proton beam of initial kinetic energy E0 = 150 MeV traversing a homogeneous PMMA (C5H8O2, density ρ = 1.19 g cm−3) target. Energy of the protons (black, solid) and proton transit time (blue, dashed) as a function of penetration depth x according to (1) and (4), respectively. The stopping power data of PMMA were taken from the NIST database (NIST 2014).
Download figure:
Standard image High-resolution imageAt the particle position xp along the beam track, the charged particle deposits the energy dEp within dx

until it comes to rest at xp(Ep = 0) = R(E0), with R(E0) being the range of the particle. The energy-dependent particle velocity v(Ep) is given by
where m0 is the particle rest mass and c the speed of light. With (1) and (2) we describe kinetic energy Ep and the particle transit time tp at position xp along the beam track as

and

Figure 2 shows the correlation between longitudinal position, transit time and particle energy for an exemplary target (homogeneous PMMA, density ρ = 1.19 g cm−3) and particle beam (150 MeV protons). tp(xp) as well as Ep(xp) are implicit, but for all that these expressions are bijective, i.e. the triple of (xp, Ep, tp) is entirely defined, if one of these quantities is assigned. Thus we may note xp(tp), xp(Ep), and Ep(tp) although these terms are not explicitly given here.
2.3. Prompt γ-ray emission
Along the beam track prompt photons may be emitted. There is an effective nuclear cross section σN for the emission of prompt γ-rays of a certain γ-energy range. The prompt γ-rays may result from various nuclear reactions. The production of prompt γ-rays dG within dx is given by

where A is the effective atomic number of the target and u is the atomic mass unit. With (2) and (5) we describe the prompt γ-ray production rate gt as

In the results section, we model the PGT spectra for a dedicated experimental setup based on the introduced kinematics and the measurement setup. The prompt γ-ray emission profile gx used to model the experimental PGT spectra is a substantial requisite. For the modeling, we utilize two different profiles gx to discuss the resulting prompt γ-ray emission time distributions gt. The first one is a simple box model, denoted as simBox (figure 3, left). It assumes a constant emission probability along the beam path, i.e. gx = const. This model is overly simplified, but it is well suited to illustrate the subsequent correlations. Furthermore, Biegun et al (2012) report on prompt γ-ray emission profiles, based on Geant4 and MCNPX simulations, which disclose that the box model is a reasonable assumption. The second model, denoted as simG4, stems from Geant4 (Geant4 v10.00.p01, physics list QGSP_BIC_HP) simulations. We performed simulations with protons of initial energies from 50 MeV up to 230 MeV irradiating a homogeneous PMMA target. For each prompt γ-ray emission, the longitudinal position was recorded. These prompt γ-rays are filtered according to their simulated emission energy, where the energy region of interest (ROI) was set to 4.3–4.5 MeV (figure 3, right). This range of simulated emission energy corresponds to the detected energy ROI filtered within the experimental data. The resulting distributions for simBox and simG4 are given in figure 3.

Figure 3. Modeling of prompt γ-ray emission profiles. The left part presents the simple box model (simBox), whereas the right part shows the Geant4 simulation data (simG4). Absolute values are Geant4 based and are discussed in the text. In both illustrations: (a): longitudinal prompt γ-ray emission profile (gx). (b): proton transit time tp versus penetration depth xp. (c): time emission profile (gt).
Download figure:
Standard image High-resolution imageFigure 3 demonstrates how the longitudinal γ-ray emission profiles gx translate into prompt γ-ray time emission profiles gt by using (1)–(6). A 150 MeV proton beam was assumed. The left-hand side presents the results for the box model (simBox), the right-hand side for the Geant4-based model (simG4). In the right part of figure 3(a) we find a peak at the end of the proton path in the prompt γ-ray emission spectrum. These prompt γ-rays mainly stem from 12C* (4.438 MeV) and 11B* (4.444 MeV) de-excitations (Kozlovsky et al 2002). The resulting gx profile is in good agreement with the corresponding nuclear cross section reported by Dyer et al (1981).
For both models we changed the proton range to illustrate the effect on the prompt γ-ray time distribution gt. With a change of the proton range, the longitudinal emission profile gx is stretched or compressed in x-direction. In the example, this is realized by a reduction of material density by 10% (figure 3(a)). The black (solid) curves correspond to the original range, the red (dashed) curves to the altered proton range, respectively. Here, the maximum proton transit time increases when the density is reduced. Due to the larger proton transit time, the prompt γ-ray emission time distribution gt is stretched as well. Consequently, the mean prompt γ-ray emission time μγ increases. We also observe a broadening of the distribution, i.e the standard deviation σγ of the distribution increases. In the following we use the standard deviation σγ as measure for the width of the distribution.
The emphasis of the presented exemplary γ-ray emission profiles (figure 3) lies on the shape of the distributions gx and gt with changing target density, rather than on the magnitude, as this paper does not aim to discuss prompt γ-ray emission yields in detail. However absolute values of gx suffice

where Γγ is the integral prompt γ-ray emission rate per proton. Its absolute value is extracted from Geant4 simulations.
Γγ is 0.14 prompt γ-rays per proton for the simBox model of gx. Here the minimum prompt γ-ray emission energy was set to 1 MeV. Smeets et al (2012) report 0.09 prompt γ-rays per proton for 160 MeV irradiating PMMA. For the simG4 model Γγ is 0.01 prompt γ-rays per proton. The γ-ray emission energy ROI is 4.3–4.5 MeV, as stated above. It has been reported that Geant4 simulations typically overestimate prompt γ-ray yields Γγ. Gedes et al (2014) compare Geant4 simulations with respective experimental data and report an overestimation by a factor of 1.7 for 160 MeV protons irradiating PMMA.
The distributions gt given above directly result from the presented kinematic considerations. A measurement of these quantities, however, will be affected by a variety of measurement uncertainties, e.g. the time resolution of the detection system. These uncertainties typically result in a convolution of the original distributions with Gaussian convolution kernels. The magnitude of such an uncertainty is described by the kernel width σconv.
To illustrate this impact of a measurement uncertainty we performed convolutions of the presented distributions gt(simBox, simgG4) with Gaussian kernels of varying width. The results are shown in figure 4. The graphs show the original distribution (top), which is identical to figure 3(c) and the convolution with Gaussian kernels of σconv = 0.1 ns (middle) and σconv = 0.5 ns (bottom). Figure 4 demonstrates the integral distribution parameters μγ and σγ of gt being sensitive to a change of the proton transit time. Although the spectral shape of gt changes with the convolution, μγ and σγ still show a shift due to the increased proton transit time. This means the statistical moments μγ and σγ are sensitive to an altered proton range, even if the time resolution of the system is poor. Absolute values of μγ and σγ are given in the figure.
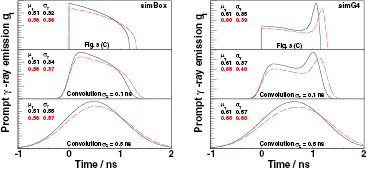
Figure 4. Convolution of the prompt γ-ray emission time profiles gt of figure 3(c) for the simBox model (left column) and the simG4 model (right column). The top graph shows the original gt profile, in the middle graph the Gaussian convolution kernel had a σconv of 0.1 ns, in the lower graph σconv was 0.5 ns. Resulting distribution values μγ and σγ are given in the graphs. Here the black (solid) curves represents the original PMMA density. For the red (dashed) curves, the target density was reduced by 10%, i.e. the proton transit time is increasing. This results in a shift of the gt distribution mean value μγ and a broadening of gt, i.e. σγ is increasing. The sensitivity of these integral distribution parameters to the altered proton range however is not affected by the convolution.
Download figure:
Standard image High-resolution imagePlease note that in the experimental section we also performed experiments with targets of a thickness z smaller than the proton range R(E0), i.e. the protons are not stopped inside the target. In this case, the corresponding gx models are then set to zero if x > z.
3. Experimental verification
3.1. Experimental setup
At KVI-CART at the University of Groningen, The Netherlands, we performed irradiation experiments with protons at a test setup following figure 5. The cyclotron was operated at a radio frequency (RF) of 55 MHz, corresponding to an RF period of 18.2 ns. The proton beam had a fixed energy of 150 MeV for all the experiments. Various PMMA and graphite targets were irradiated and PGT spectra were measured with a common scintillator-based timing spectroscopy setup. We used a ∅ 1'' × 1'' cylindrical GAGG:Ce (cerium-doped Gd3Al2Ga3O12) scintillator (Kamada et al 2012) coupled onto a Photonis XP2972 photo multiplier tube (PMT) as primary detector. The PMT anode signal was amplified and split by a CAEN N979 fast amplifier (FA). One detector signal branch was sent to an ORTEC 935 constant fraction discriminator (CFD). The CFD output signal was sent to a CAEN V1290A time-to-digital converter (TDC). This module was used to measure the time difference between the radio frequency (RF) of the cyclotron and the detector timing signal. The CFD output was additionally fed into a CAEN V1495 logic module to generate the integration gate used for the energy measurement of the detector signal. The second branch of the FA output was fed into a CAEN V965 charge-to-digital converter (QDC). The QDC modules were read out via a custom programmed software toolkit based on the ROOT framework (Brun and Rademakers 1997). The event data from the QDC module and the TDC module were taken in coincidence in order to receive the energy-time correlation of each detector signal. The data acquisition, i.e. the QDC module, the logic module and the TDC module are based on the Versa Module Eurocard-bus (VME). The trigger generation, i.e. the CFD module as well as the FA module are based on the Nuclear Instrumentation Methods (NIM) standard.

Figure 5. Beam setup: the timing detector was placed at an angle  with respect to the beam direction at a distance d of the target beam entrance.
Download figure:
Standard image High-resolution imagePrior to the beam experiment, we determined the detector time and energy resolution. The energy resolution is about 7% FWHM at photon energies of 1.173 MeV. The detector time resolution was measured in coincidence with a BaF2 detector coupled to a Photonis XP2059 PMT. In both detectors, the energy threshold of the discriminators was set to 1 MeV. We obtained 900 ps time resolution FWHM with a 60Co source. These values are worse than data published by Iwanowska et al (2013), who found an energy resolution of 6.1% FWHM at 662 keV and a time resolution of 570 ps FWHM at the 511 keV annihilation photons of a 22Na source. Within the proton irradiation of the graphite target, the detector was placed at an angle  ≈ 60° at a distance of d ≈ 24 cm (section 4.1). Within the proton irradiation experiment of a PMMA target, the GAGG detector was placed upstream at an angle of
  with respect to the beam direction at d = 60 cm distance to the target beam entrance. The beam current was approximately 10 pA for all presented experimental data and the proton beam had a diameter of about 1 cm FWHM at the target front face.
3.2. Measurement of prompt γ-rays
In the following paragraph, we describe the measurement of prompt γ-rays and the extraction of PGT spectra. The presented data result from a retrospective analysis of experiments that were planned with different experimental aims.
Exemplary time-resolved prompt γ-ray data of an irradiated PMMA target (10 cm × 10 cm × 15 cm) are shown in figure 6.
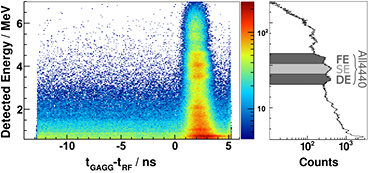
Figure 6. Time resolved prompt γ-ray spectrum of a PMMA target (left) and the corresponding energy deposition spectrum (right). Prominent lines above 3 MeV are 4.44 MeV due to de-excitation of 12C* (4.438 MeV) and 11B* (4.444 MeV). Further the de-excitation of 16O* (6.13 MeV) is to be seen. The marked energy regions of interest cover the full energy peak (FE), the single escape peak (SE) and the double escape peak (DE) of the 4.44 MeV prompt γ-ray line. We accumulated the PGT spectra comprising all events within this energy ROI.
Download figure:
Standard image High-resolution imageThe graph on the left-hand side shows a two-dimensional plot of the photon energies deposited within the detector versus the detector time signal relative to the cyclotron RF (tGAGG − tRF). The cyclotron RF is the reference signal of the proton beam. This means that a defined phase of the sinusoidal RF signal corresponds to a specific position of the respective proton bunch. However, this absolute proton bunch position is not known. Thus, there is an unknown time offset Toff of the PGT spectra, i.e. the absolute value of the time difference (between RF and detector) is arbitrary. However, if neither the beam adjustment (trajectory, energy, optics etc.) nor the detector electronics is changed during the experiments, a relative analysis of PGT spectra is reasonable.
The presented graph reveals the emission of prompt photons in a time interval of about 2 ns FWHM. Verburg et al (2013) studied this type of prompt γ-ray energy versus time profiles. By synchronizing the cyclotron radio frequency to the detector time signal Verburg et al separated the prompt γ-ray signals from later-arriving neutron induced background.
Figure 6 (right) shows the prompt γ-ray energy deposition spectrum. In the energy range above 3 MeV there are two prominent photon lines: the 4.44 MeV line from the de-excitations of 12C* (4.438 MeV) and 11B* (4.444 MeV) as well as 6.13 MeV from 16O* de-excitation (Kozlovsky et al 2002). As we used a rather small detector, single escape (SE), double escape (DE), and full energy (FE) peaks appear. The gray shaded areas mark the energy regions of SE, DE and FE of the 4.44 MeV photon line. In the following, we introduce experimental prompt γ-ray timing (PGT) spectra. These PGT spectra are projections of events within a specific energy ROI onto the time axis. In the result section we present various PGT spectra with two different energy ROI. The first one, marked as All4440, is the energy range of 3.1 MeV–4.6 MeV. This includes the SE, DE and FE of the 4.44 MeV prompt photon line. The second one, marked as SE, comprises the energy range from 3.6 MeV–4.2 MeV. An exemplary PGT spectrum is given in figure 7. There are two reasons to choose these energy ROI.
- (a)A narrow energy window reduces the influence of electronic time walk effects, that are present despite the usage of CFDs.
- (b)In the next paragraph we describe a numerical algorithm to model PGT spectra based on the introduced kinematical approach. In the results section we compare these modeled PGT spectra with experimental data. Note that the prompt γ-ray emission energy spectrum is not equal to the detected energy spectrum, due to the detector specific response. With the above stated detected energy ROI (All4440, SE) we narrow the experimental data down to the same nuclear reactions defined within the Geant4 simulations, where the emission energy ROI is defined. This especially applies for the simG4 model.
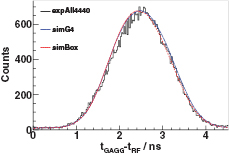
Figure 7. Exemplary experimental PGT spectrum of 150 MeV protons stopped within a PMMA target of the size 10 cm × 10 cm × 15 cm. The experimental setup corresponds to figure 2. The energy ROI is All4440. The modeled data account for the same experimental setup, i.e. initial proton energy, target material and detector position. PGT spectra are modeled based on the gx profiles simBox as well as on the Geant4 based gx profile simG4 (see section 2.2). The assumed system time resolution σΣ is 450 ps.
Download figure:
Standard image High-resolution image3.3. Modeling of prompt γ-ray timing (PGT) spectra
In the following paragraph a Monte Carlo (MC) algorithm for the modeling of PGT spectra based on the kinematical considerations is described. So far, the introduced relations of prompt γ-ray emission did not account for a certain type of detection system. The modeling of a PGT measurement setup, however, needs to incorporate the geometrical position of the detection system (figure 5), as the time of flight of the prompt γ-ray (tγTOF) from its point of emission (xp) to the detection system influences the shape of the PGT spectrum. The time distribution measured by the detector will therefore not be identical with gt. However, due to the constant prompt γ-ray velocity, this transformation between gt and the detected PGT spectrum is a bijective relation.
The following MC steps have been performed to model PGT spectra. First of all, the prompt γ-ray emission profile gx is chosen. We either utilize the box model (simBox) or the Geant4 model (simG4) introduced in section 2.3. Prompt γ-ray emission points (xp) are randomly chosen in accordance with gx. With (4) the respective prompt γ-ray emission time tp(xp) is calculated, as well as the respective prompt γ-ray time of flight tγTOF to the detector. For xp  [0, R(E0)] we find

where tPGT is the time elapsed from the entrance of the proton beam into the target until the prompt photon has reached the detector, assuming the prompt photon to be instantaneously emitted at xp. Note that the resulting modeled PGT time distribution is weighted with the square of the distance between xp and the detector. However, this algorithm does not simulate a detector energy response. As stated above, the detected energy ROIs are selected in a way, that experimental and simulated data predominantly refer to the same nuclear reaction, i.e. to the same longitudinal emission profile gx. In the next paragraph, measurement uncertainties concerning the timing information are outlined as well as their inclusion into the modeling algorithm.
3.4. Timing uncertainty in prompt γ-ray time spectra
There are two major factors limiting the measurement precision of tPGT within an experiment. The first factor is the proton bunch width σbeam provided by the beam line. The limited accuracy of the actual bunch position with respect to the cyclotron RF is mainly due to the kinetic energy spread of the beam bunches, delivered by the accelerator. This includes inter-bunch and intra-bunch effects. A second limiting factor is the detector time resolution σD. These two effects could not be separated during the measurement. However, for the modeling algorithm it is not necessary to clearly separate the influence of σD and σbeam. Therefore we introduce the system time resolution σΣ. We assume Gaussian shaped uncertainty distributions and define

Here σΣ, σD, and σbeam are the standard deviations of the respective distributions. In the last step of the MC algorithm, the prompt γ-ray time distribution of tPGT is convolved with a Gaussian function with the standard deviation σΣ. The result of this convolution is denoted as modeled PGT spectrum.
In order to estimate a value of the system time resolution σΣ during the irradiation experiment, we analyzed the prompt γ-ray profile measured with a thin PMMA target (z = 6 mm). The standard deviation σ6 mm of the resulting PGT spectrum with the energy ROI All4440 and SE is 450 ps ± 10 ps. This value includes both of the discussed effects and is an upper limit for the system uncertainty σΣ, as we neglect the finite proton transit time through this thin target.
Due to previous experiments concerning the detector time resolution, we suppose the AGOR cyclotron to have a bunch width of less than 1 ns. Roellinghoff et al (2014) used a prompt γ-ray time of flight (TOF) technique with a collimated detector system at a clinical cyclotron. The measured time profiles revealed a bunch spread of the beam of about 1.5 ns FWHM at 160 MeV proton energy. This suggests that a slightly higher system time resolution σΣ is to be expected at a clinical cyclotron.
The results section compares experimental and modeled PGT spectra. Experimental data are drawn as histograms, whereas the modeling results are given as smooth lines of the same color. An example of an experimental PGT spectrum compared to the modeled data (simBox, simG4) is given in figure 7. The MC algorithm accounts for PGT spectral shapes, but does not consider absolute prompt γ-ray production rates. Therefore, the modeled spectra are scaled to the maximum of the respective experimental spectra.
4. Results
4.1. Measurement of the absolute target shift
A homogeneous graphite target of the size of 10 cm × 10 cm × 30 cm and density of ρ = 1.7 g cm−3 was irradiated with protons. The beam of 150 MeV initial proton energy was completely stopped within the target, where protons of this energy have a range of about 10.3 cm. The target was irradiated at three different positions, denoted as A, B, and C (see figure 8 (left)). For position A, the beam entrance of the target is at (x, y, z) = (0 mm, 0 mm, 0 mm) in Cartesian coordinates. The GAGG detector is placed at (195 mm, 0 mm, 140 mm). For B, the target was shifted by 20 mm downstream, for C, the target was shifted again by 20 mm downstream. The detector position was kept fix. Table 1 lists the target location in Cartesian coordinates, as well as in polar coordinates, as defined in figure 5.

Figure 8. (Left) Setup of the irradiation experiment with a graphite target (density ρ = 1.7 g cm−3). The target was irradiated at three different positions A, B, and C. Exemplary prompt γ-ray times-of-flight from half proton-range to the detection system are noted (details see text). The proton beam had an initial energy of 150 MeV. (Right) Experimental PGT spectra for target positions A, B, and C are depicted as histograms, corresponding modeled data given as straight lines. The PGT spectra exhibit a clearly visible shift, due to varied target position. This effect is much smaller than the system time resolution σΣ of 450 ps, but is distinct due to sufficient statistics (see also section 4.3). The experimental energy ROI is All4440, the modeled gx profile is simBox.
Download figure:
Standard image High-resolution imageTable 1. Target location of position A, B, and C as depicted in figure 8 (left). The location of the target (x, y, z) is given in Cartesian coordinates denoting the target beam entrance. The respective polar coordinates  and d are defined according to the geometric definitions made in figure 5.
| Position | Target (x/mm, y/mm, z/mm) | Distance d/mm | Angle
 /° /° |
|---|---|---|---|
| A | (0, 0, 0) | 240 | 54.3 |
| B | (0, 0, 20) | 229 | 58.4 |
| C | (0, 0, 40) | 219 | 62.9 |
Figure 8 (right) shows the respective PGT spectra. Experimental data are normalized to 109 incident protons. The total number of incident protons for each measurement was about 1011, varying by 10% between the measurements. Corresponding modeled data are given as solid lines. Here, the underlying model for gx is simBox. The PGT spectra exhibit a visible shift of the center of gravity (μγ) with changing target position. There are two factors oppositely contributing to this time shift: the proton time-of-flight in air before entering the target and the average prompt γ-ray time-of-flight between target and detector. Protons of 150 MeV need 132 ps for traversing 20 mm of air prior to the target entrance. Contrary, the average prompt γ-ray time-of-flight is reduced, as the target is approaching the detector as it is depicted in figure 8 (left). Thus the respective PGT spectra should exhibit a mean shift below 132 ps.
A simple calculation allows for estimating the mean shift between A and B. We consider the emission of a (hypothetical) prompt γ-ray, emitted at the middle point between the beam target entrance and the proton range R, and divide the time track of interest in three parts: the proton time-of-flight (TOF) prior to the target, the proton transit-time inside the target and the prompt γ-ray TOF to the detector. The proton TOF prior to the target increases by 132 ps taking A as reference position. The proton transit-time inside the target is constant as the beam parameters are equal. The prompt γ-ray TOF is  ps at position B compared to
  ps at position A. Thus the difference in arrival time is 132–25 ps = 107 ps. Table 2 shows the differences of the mean values of the PGT distribution for positions B and C with respect to A based on the simple geometric calculations. The results are compared with the simulated data
  as well as with the experimental data
  .
.
Table 2. Comparison of PGT mean values according to figure 8. The geometric estimation assumes a prompt γ-ray being emitted at the half-range of the proton beam in the target for position A, B, and C, respectively. This estimation accounts for the additional proton transit time through air (due to the target shift) and the reduced prompt γ-ray time-of-flight to the detector. The simulated and experimental mean values μγ are extracted from Gaussian fits of the respective PGT spectra, errors are based on the fitting data.
| Pos | Geom. Estimation ΔtPGT/ps | Model
 /ps /ps |
Experiment
 /ps /ps |
|---|---|---|---|
| A-B | 107 | 104 | 90 ± 10 |
| A-C | 219 | 214 | 210 ± 10 |
Due to the well-known relation between the standard error of the mean SEμ and the sample standard deviation σ ( , the target induced time shift Δμγ in the PGT spectra, which is one order of magnitude lower than the system time resolution σΣ = 450 ps (FWHM 1.06 ns), can be measured easily, if sufficient statistics are provided. Here, N describes the number of observations, i.e of registered γ-rays in the sample. A quantitative discussion of the required measurement times and the resulting statistical uncertainties is given in section 4.3.
In comparison to figure 7 (example for PMMA), the modeled PGT spectra differ from the measurement, especially at the tails of the distributions (tGAGG − tRF ⩾ 2.5 ns). Furthermore, the PGT spectra exhibit an asymmetric shape. There are two reasons for this discrepancy.
- (a)The assumed model simBox for the prompt γ-ray emission profile gx has strong difference with the actual profile close to the particle range. As the detected prompt γ-ray energy ROI is All4440, the major contribution to the PGT spectra will originate from the 12C* (4.438 MeV) deexcitation.
- (b)The detector position
 63°) for the graphite experiment is disadvantageous for PGT. Secondary scattered particles, e.g. scattered protons or neutrons, are favored in forward direction. In contrast to the PGT experiments done with the PMMA target °), the signal of the (on average) later arriving scattered protons within the target are pronounced here.


4.2. Measurement and modeling of varying proton path lengths
Furthermore, we irradiated PMMA targets of varying thickness. The target front face had an area of 10 cm × 10 cm. The density of PMMA was ρ = 1.19 g cm−3. Its thickness was changed from 5–15 cm in steps of 5, 8, 11, 12, 13, 14 and 15 cm. The GAGG detector was placed at an angle  ° at a distance d = 60 cm from the front face of the target (see figure 5). The proton energy was kept fixed at 150 MeV. Protons of this energy have a range of about 13.6 cm in PMMA. Therefore, the protons were not stopped completely within the target until the target thickness exceeded this range. With increasing target thickness the proton transit time through the material was increasing as well. Thus, the PGT spectra should exhibit a shift in the center of gravity and broadening depending on the PMMA thickness. Figure 9 shows a comparison of experimental results with the modeled data. The experimental spectra are normalized to 109 incident protons. The total number of protons was about 2·1011 for each measurement and varied up to 10% between the measurements of various thickness. The detected energy ROI shown is All4440. A clear shift of the distribution mean values, as well as a broadening of the PGT spectra with increasing target thickness is obvious. Furthermore, the experimental PGT spectra reveal a good agreement with the corresponding modeled ones. Modeled data shown in the figure utilize the simG4 model.
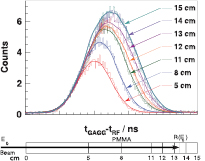
Figure 9. Comparison of experimental (histograms) and modeled time profiles (solid lines) of a PMMA target varied in thickness. All experimental curves are normalized to one incident gigaproton (109 protons). The experimental PGT spectra energy ROI is All4440 (3.2 MeV–4.6 MeV). The modeled PGT spectra are based on the simG4 profile for gx. The absolute time offset of the modeled data was set to fit the mean for 5 cm PMMA thickness. The experimental detector setup (figure 7) was taken into account to incorporate the influence of the prompt γ-ray time of flight on the spectral shape. The modeled system time resolution is σΣ = 450 ps (9).
Download figure:
Standard image High-resolution imageThe system time resolution assumed for the modeling algorithm was σΣ = 450 ps, just the value of σγ measured for a thin (6 mm) PMMA target distinguished by a negligible proton transit time. The time offset Toff is identical for all modeled spectra. It was adjusted to best fit the PGT data at 5 cm PMMA.
To compare the integral parameters μγ and σγ of experimental and modeled PGT spectra, both quantities were fit with Gaussian functions. The mean value μγ and the standard deviation σγ of these fits are shown as a function of the PMMA target thickness in figures 10 and 11, respectively. The shift of the mean, as well as the broadening of the spectra, is clearly visible and well described by the modeling results. Observed shifts and broadening of the PGT spectra are due to the increasing proton path length within the material, i.e. a result of the increased proton transit time. The error bars of the experimental data represent the uncertainties resulting from the statistics of the measured PGT distribution parameters μγ and σγ.

Figure 10. Comparison of the mean value μγ of measured and modeled PGT spectra versus PMMA target thickness. The PMMA thickness corresponds to the proton path length, i.e. to the proton transit time. Although the spectral shape is extensively influenced by the system time resolution σΣ (PGT spectra are given in figure 9), the PGT mean value μγ is highly sensitive to the change of the proton transit time. The experimental prompt γ-ray energy ROI are SE (3.6 MeV–4.2 MeV) and All4440 (3.1 MeV–4.6 MeV). Modeled data are based on the introduced profiles for gx(simBox and simG4, section 2.3).
Download figure:
Standard image High-resolution image
Figure 11. Comparison of the standard deviation σγ of modeled and measured PGT spectra versus PMMA target thickness (PGT spectra are given in figure 9). Although the spectral shape is extensively affected by the system time resolution σΣ, the standard deviation σγ is highly sensitive to the the altered proton transit time. See also figure 10.
Download figure:
Standard image High-resolution imageThe excellent agreement between experimental and modeled data proves that the physical effect of the increased proton path length is dominant and not noticeably disturbed by instabilities of the accelerator.
4.3. Modeling of varying proton range
Motivated by the good agreement between measured and modeled data in case of varying target thickness, we extrapolated the modeling to a variation of the proton range. This is a situation much closer to the therapeutic conditions.
With the described Monte Carlo (MC) algorithm we modeled PGT spectra for protons of clinically relevant energies E0 from 50 MeV–230 MeV in steps of 10 MeV. Here, the input data for the algorithm, namely the longitudinal prompt γ-ray emission profiles gx, were obtained by Geant4 simulations of protons with the respective initial energies irradiating a PMMA target. The corresponding range of the protons R(E0) went from 2 cm–27 cm. The PMMA target had the dimensions of 10 cm × 10 cm × 30 cm, thus the protons were stopped completely within the target for all initial energies. The modeled detector was situated at d = 15 cm distance to the target beam entrance at α = 150 ° upstream (see figure 5). The system time resolution σΣ was 450 ps, identical to that of the prior experiments. Figure 12 shows modeled PGT mean values μγ as well as the standard deviations σγ as a function of the proton range. MC modeling was performed for the simG4 model, as well as for the simBox model. As both curves do not differ significantly, especially in their slope, the MC algorithm is rather robust against the model for gx. In accordance with the relations derived for PMMA targets of varying thickness at fixed proton energies (figures 10 and 11), both spectral quantities show a direct correlation with the proton range R(E0). This implies that a measurement precision of μγ or σγ directly translates to a precision of the proton range determination. If the system time resolution σΣ, the time structure of the proton bunches, and the relative timing between proton bunch and the RF signal are stable, the measurement precision of spectral quantities (μγ, σγ) only depends on the number of measured events, i.e. on measurement statistics. In the following section, we discuss the basic statistical relations. We consider an exemplary measurement setup and outline the dependence of the measurement precision on the treatment time, based on the presented modeled data.
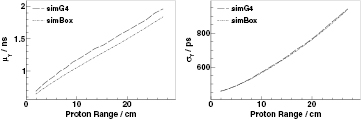
Figure 12. Range-dependent mean value μγ (left) and standard deviation σγ (right) of modeled prompt γ-ray PGT spectra. The target material is PMMA. The proton energies are in the range of 50 MeV up to 230 MeV, corresponding to proton ranges from 2 cm up to 27 cm. The assumed system time resolution σΣ is 450 ps.
Download figure:
Standard image High-resolution image4.4. Verification of the proton range
In radiation therapy there is a limited amount of time to decide whether or not the planned proton range and the actual treatment are in conformance. In the following section, we analyze a simple time spectroscopic setup. With estimations of the statistical measurement errors of the proposed PGT method, we show that a few seconds of irradiation suffice to decide precisely on the proton range, i.e. on the quality of the treatment.
Figure 12 provides the correlation between PGT statistical moments μγ and σγ and the proton range. From the confidence intervals  and
and  , we derive the respective measured confidence intervals of the proton range SER.
4.4.1. Confidence interval of the PGT mean μ.
The 95% confidence interval of the mean value μ of any random distribution is given by

where N is the number of observations (N > 200) and σ is the sample standard deviation of the distribution (Kendall et al 1952). In a given setup, the number of measured events N is defined by the detector event rate rD and the measurement time T. Based on the data of figure 12, a given confidence interval  within a PGT distribution translates to a confidence interval of the proton range
  . We find the measurement time Tμ, necessary to reach a certain proton range uncertainty
  based on the PGT mean value μγ, to be

σγ standard deviation of the PGT spectrum
rD detected event rate
δR variation of the proton range R
δ μγ variation of the mean μγ corresponding to δR
 confidence interval of the proton range
In the following we will discuss the parameters of (11).
PGT standard deviation σγ: In the modeling data, we found σγ of PGT spectra to be range dependent and of a value of up to 900 ps (figure 12). This modeling is based on a system time resolution σΣ of 450 ps (9). However, Verburg et al (2013) state that the intrinsic time bunch width of clinical cyclotrons can be as much as σbeam = 1 ns. State-of-the-art scintillation detectors reach time resolutions of σD = 50 ps. In an optimized measurement system, σbeam will therefore be a limiting parameter. Thus, we additionally modeled PGT spectra with σΣ = 1 ns. The dependence of the mean value of the proton range is not affected by the system time resolution σΣ. However, the corresponding PGT distributions then have a standard deviation σγ = 1 ns at a proton range of 2 cm and up to σγ = 1.3 ns at a proton range of 27 cm.
Detector event rate rD: State-of-the-art scintillator-based detection systems can handle a detector load of 105 counts per second (cps) (Pausch et al 2005). This limit constrains the number of detectable events and thus also limits the minimal required measurement time.
Proton range confidence interval  : A clinically acceptable precision of the proton range is 2 mm.
Variation of the proton range δR/δμγ: Physically, this factor describes the variation δμγ of the PGT mean μγ, caused by a a variation of the proton range δR. A vivid explanation of this factor can be understood in figure 12: the steeper the curve μγ(R), the shorter the required measurement time Tμ to reach a given proton range confidence interval  . The slope of this curve is rather independent of the assumed prompt γ-ray emission profile, nearly independent of the proton range and also independent of the system time resolution σΣ (figure 12). The value is about 45 ps cm−1.
4.4.2. Confidence interval of the PGT standard deviation σ.
The same formalism applies for the 95% confidence interval of the standard deviation  . In the following we use the term for
  of Gaussian shaped distributions, as the exact expression for arbitrarily shaped distributions is rather complex and the system time resolution σΣ justifies the Gaussian approximation. Thus we can write
Variation of the proton range δR/δσγ: The variation of the standard deviation δσγ caused by a variation of the proton range δR is reflected in the slope of the curves given in figure 12 (right). According to our model data, this value is also nearly independent of the assumed model for gx. However, δR/δσγ is dependent on the proton range and also dependent on the system time resolution σΣ. The value δR/δσγ is about 20 ps cm−1 for σΣ = 450 ps. The modeled data of σΣ = 1 ns result in a value of about 10 ps cm−1.
4.4.3. Time requirements for range verification.
So far, the presented results restrict the analysis of prompt γ-rays detected within a narrow energy ROI (All4440, SE). However, in order to receive fast but reliable range information based on reliable measurement statistics, it is reasonable to utilize an increased energy ROI of detected γ-rays. In the performed Geant4 simulations the resulting integral emission rates Γγ have a value of 0.05 up to 0.25 prompt γ-rays per proton at a proton range of R = 2 cm and R = 27 cm respectively. Here a prompt γ-ray emission energy Eγ of at least 1 MeV is assumed. With an increased energy ROI of the emitted prompt γ-rays the resulting simulated profiles gx resemble the box profile. This is in good agreement with data reported by Biegun et al (2012).
We estimate for a reasonable scintillator-based detection system according to the setup given in figure 5. The detector may have size of ∅2'' × 2''. We propose a fast scintillating material such as LaBr3 with a photon detection efficiency εD, which can be derived by assuming the minimum photon interaction cross-section for the given scintillator (NIST 2014), thus εD = 0.4. Note, that εD is the minimum absolute detection efficiency, i.e. the probability that a photon interacts in the detector by any type of interaction. This is valid since the timing information of an interacting prompt γ-ray is valid, even if it is not completely absorbed. The detector is situated at d = 30 cm distance of the beam target entrance (figure 5). Figure 13 shows the required measurement times Tμ and Tσ to reach the precision of the proton range  mm as a function of the beam current at the irradiated target. The respective integral emission rate Γγ is given within the brackets in the graph. All the curves show a plateau at a beam current of about 100 pA or higher. This is due to the assumed maximum of the detectable throughput of the data acquisition system which limits the detection rate to 105 cps. The continuous dashed lines represent systems with (hypothetical) unlimited throughput. Figure 13 shows, that the required measurement times are mainly limited by the detector throughput, especially at therapeutic relevant beam currents of ≈1 nA. This even applies, if the overestimation of prompt γ-ray yields by the Geant4 simulations is wrong by factor of two. The selected maximum detector throughput is a real system throughput based on a commercial digital spectrometer, i.e. the electronic data acquisition is capable of processing the event rate supplied by the detector. Modern designs based on digital pulse processing may even allow up to 106 cps system throughput.
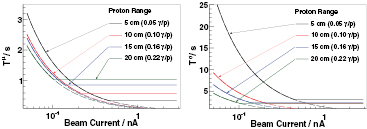
Figure 13. Required measurement times Tμ (left, (11)) and Tσ (right, (12)) to reach a proton range uncertainty  mm based on a PGT detector system comparable to figure 5. The integral prompt γ-ray emission rate Γγ per proton is given within the legend of the graph. Setup constraints are discussed in the text. The assumed system time resolution σΣ is 450 ps.
Download figure:
Standard image High-resolution image4.5. PGT of inhomogeneous targets
The intention of the presented analysis so far, is the introduction of the PGT method for range assessment aiming at the presentation of experimental results, affirmed by a rather simplified MC modeling of the underlying physics. Consequently we studied the simplest case, incorporating the scenario of a homogeneous target with a well defined stopping power.
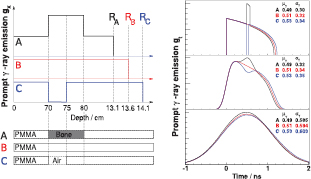
In clinical practice, range deviations are often caused by inhomogeneities along the proton track. Thus, a necessary next step towards the application of PGT under therapy conditions is the investigation of inhomogeneous targets. In the following we analyze prompt γ-ray emission spectra caused by three inhomogeneous target scenarios (figure 14(left)): A: PMMA target with a 10 mm bone structure at 70 mm depth. The material composition is adapted from the NIST database, namely BONE_CORTICAL (H (4.7%), C (14.4%), N (4.2%), O (44.6%), P (10.5%), Ca (21%), density ρ = 1.85 g cm−3). B: Full PMMA target. C: PMMA target (density ρ = 1.19 g cm−3) with a 5 mm air-filled cavity at 70 mm depth.
Figure 14. Left: prompt γ-ray emission profiles for three inhomogeneous targets. A: PMMA with a 10 mm bone insert at 70 mm depth. B: Homogeneous PMMA. C: PMMA with 5 mm air cavity at 70 mm depth. Corresponding gx profiles (simBox model) are given above. With respect to B, target A represents a beam undershoot by 5 mm, whereas C represents a beam overshoot by 5 mm. Prompt γ-ray production in the bone insert is assumed to be 1.6 times higher than in PMMA. Right: MC modeled prompt γ-ray time emission profiles gt, based on three different convolution kernels. Top: original gt profile, Middle: convolution with σΣ = 0.1 ns, Bottom: convolution with σΣ = 0.5 ns. Resulting gt mean values μγ and σγ are given in the graphs. The shift of μγ and σγ caused by a variation of the proton range is visible, values are discussed in the text.
Download figure:
Standard image High-resolution image
We assume an initial proton energy of 150 MeV. Furthermore, the target thickness is assumed to exceed the proton range.
Taking B as reference, the proton range R is decreased by about 5 mm for A (beam undershoot), whereas R is increased by about 5 mm for C (beam overshoot). Figure 14(left) depicts the denoted targets and the assumed prompt γ-ray emission profile gx, assuming the simBox model. gx is zero within the air cavity. The ratio between gx in the bone structure and gx in the PMMA is 1.6, i.e. we assume that protons in bone produce 1.6 times more prompt γ-rays than in PMMA. This is a rough estimation based on our Geant4 simulations and data published by Polf et al (2009a). Polf et al report the ratio of prompt γ-ray production of compact bone being about 1.75 times higher compared to water.
Figure 14 shows the resulting modeled prompt γ-ray emission profiles gt. Analogous to figure 4 we depict the convolution of the respective gt distributions with Gaussian kernels of σΣ = 0.1 ns and σΣ = 0.5 ns. The shift of the proton range is clearly reflected in a shift of the mean value Δμγ of about 40 ps cm−1, not affected by the convolution, i.e. not affected by the system time resolution σΣ. The increased proton range (from A to C) is also expressed in a broadening of the gt distributions. However, with increasing width of the convolution kernel the range-variation induced difference of the standard deviation Δσγ is significantly reduced. A reasonable system time resolution σΣ is therefore highly desirable to improve measurement precision.
Note that, at this point, we constrain the analysis of the inhomogeneous target to an evaluation of gt distributions and their respective convolutions. The inclusion of prompt γ-ray time-of-flight effects (given by a specific detector configuration), as it is discussed in section 3.3, is disregarded. The geometrical position of the detector defines a specific, however nonlinear deformation of the gt distribution dependent on  and d (see figure 5). gt distributions can be understood as PGT spectra of a detector situated at
  ° at a distance d ≫ R, where prompt γ-ray time-of-flight differences as well as detector solid angle effects along the proton track are negligible.
Based on the presented modeled data, we conclude that the PGT method is applicable for inhomogeneous targets as well. A comprehensive analysis of inhomogeneous targets (variation of target materials, size and position of inhomogeneities, beam energy etc.) goes, however, beyond the scope of this paper.
4.6. Limitations of PGT
Several limitations of the PGT need to be addressed. The presented MC algorithm is a straight forward implementation of the kinematical relations. It does not account for effects such as the influence of the target dimensions and the resulting contributions of scattered prompt γ-rays to the PGT spectrum, or the lateral spread of the beam. A full MC simulation of PGT spectra would account for these influences. Furthermore, the density of irradiated tissue in Treatment Plans (TP) is in practice derived from Computer Tomography (CT) data. This method includes inherent uncertainties of 1–2% in translating Hounsfield Units (HU) to water equivalent stopping power (Paganetti 2012). Paganetti (2012) also lists other sources of range uncertainties, such as beam reproducibility, patient setup, etc. As a consequence, proton TPs account for proton-range safety margins, e.g. 3.5% plus an additional 1 mm at the Massachusetts General Hospital (MGH). As the material stopping power is an important requirement for the modeling of PGT spectra, the comparison of modeled and measured PGT spectra would therefore lack from these inaccurate knowledge of the proton stopping power. The question if currently applied safety margins in particle TPs can be challenged with PGT must be subject of further investigation. However, in section 4.4.3, we have shown that a major advantage of PGT is the direct measurement method and the statistically founded result. A fast decision on a significant beam overshoot or undershoot beyond the safety-margins of the TP seems to be feasible in real time.
5. Discussion
We introduced the novel concept of prompt γ-ray timing (PGT): a fast and precise range verification in particle therapy by using a single γ-ray detector of reasonable time resolution in a common setup for timing spectroscopy.
A retrospective analysis of PGT spectra measured in proton irradiation experiments was presented and discussed. The experimental data clearly demonstrated that PGT statistical moments μγ and σγ are dependent on the transit time of protons in the target, meaning the time between entering the target and stopping, and thus on the particle range. Underlying physical processes were outlined and applied to a modeling of the experimental conditions, achieving a very good agreement with the measured PGT spectra. The compliance of the modeled and the experimental data provide a basis for the extrapolation to other scenarios closer to therapy conditions. Since the outlined analysis resulted from a reevaluation of data from experiments planned with a different intention, measured PGT spectra in dependence of the proton range could not be presented yet. Thus, PGT distributions were modeled for varying proton ranges. In conformance with the presented theoretical considerations, the modeled PGT statistical moments μγ and σγ showed the expected dependence on the varied proton range, reflecting the varied proton transit time.
The validation of these predictions, i.e. a measurement under clinical conditions with a variation of the proton range as well as the irradiation of inhomogeneous targets is a logical next step. It has to be shown that measurement uncertainties under these conditions (e.g. the system time resolution σΣ) or the expected increased radiation background caused by the treatment nozzle, do not limit the accuracy of PGT.
Clinical treatment control in real time requires information about the compliance of dose delivery and treatment plan, shortly after starting the irradiation. A rather conservative estimate presented in this paper predicts that a PGT setup with a single scintillation detector would be able to detect range deviations of about 2 mm within a few seconds, assuming therapeutic proton beams and typical ranges. This prospect of range precision, however, requires accurate knowledge of the proton stopping power of the irradiated tissue, which is limited by the accuracy of the conversion of CT data to stopping power to 1–2% . A practical scenario of PGT, i.e. the comparison of TP based PGT spectra with measurement results, needs to be subject of further investigation. However, due to the excellent measurement statistics, a decision on changes of the proton range outlying of the typical safety margins applied in the TP can be taken within a few seconds.
Our investigations—experimental as well as modeling efforts—relate to irradiation scenarios with fixed-energy beams. We are aware of the fact that an irradiation with a spread-out Bragg peak (SOPB) distorts the (in our case) fixed timing between RF and the arrival of a beam bunch at the target. A variation of the beam energy results in a variation of the transfer time of the proton bunch through the beam line. There are two options to deal with this problem.
- (a)A careful energy-dependent calibration of the transfer time of the proton bunch is necessary prior to an irradiation.
- (b)The RF reference has to be replaced by a more sophisticated method of bunch timing—e.g. an additional beam monitor or particle detector for scattered beam particles.
We presented a novel approach for range assessment in particle therapy. In contrast to PT-PET and other collimated PGI systems, PGT is based on straight measurements with an uncollimated detector. In this study we focused the analysis to a specific energy window of detected prompt γ-rays. However, the energy ROI could be larger, if the corresponding emission profile gx is well known. In this case a significantly higher proportion of prompt γ-rays could be utilized. As shown in figure 13, the measurement statistics are substantially determined by the throughput of the detection system. PGT spectra with excellent statistics can thus be collected within seconds, whereas coincidence conditions e.g. in a Compton camera or PT-PET usually lead to a strong discrepancy between detector load and useable event rate. This fact, in combination with the simplicity of the data analysis, clearly favors PGT as an approach for range assessment in real time and suggests it could be even used for active treatment control.
Acknowledgments
This work is supported by the German Federal Ministry of Education and Research (BMBF-03Z1NN12). This work is partly supported by the European Commission within the Seventh Framework Program through IA-ENSAR (contract no. RII3-CT-2010-262010) and ENTERVISION (grant agreement no. 264552). We thank the staff of the KVI-CART facility for the excellent support.