
Abstract
A beta camera has been developed that allows planar imaging of the spatial and temporal distribution of beta particles using a 14 × 14 mm2 position sensitive avalanche photodiode (PSAPD). This camera system, which we call Betabox, can be directly coupled to microfluidic chips designed for cell incubation or other biological applications. Betabox allows for imaging the cellular uptake of molecular imaging probes labeled with charged particle emitters such as 18F inside these chips. In this work, we investigate the quantitative imaging capabilities of Betabox for 18F beta particles, in terms of background rate, efficiency, spatial resolution, and count rate. Measurements of background and spatial resolution are considered both at room temperature (21 °C ± 1 °C) and at an elevated operating temperature (37 °C ± 1 °C), as is often required for biological assays. The background rate measured with a 4 keV energy cutoff is below 2 cph mm−2 at both 21 and 37 °C. The absolute efficiency of Betabox for the detection of 18F positron sources in contact with a PSAPD with the surface passivated from ambient light and damage is 46% ± 1%. The lower detection limit is estimated using the Rose Criterion to be 0.2 cps mm−2 for 1 min acquisitions and a 62 × 62 µm2 pixel size. The upper detection limit is approximately 21 000 cps. The spatial resolution at both 21 and 37 °C ranges from 0.4 mm FWHM at the center of the field of view (FOV), and degrades to 1 mm at a distance of 5 mm away from center yielding a useful FOV of approximately 10 × 10 mm2. We also investigate the effects on spatial resolution and sensitivity that result from the use of a polymer based microfluidic chip. For these studies we place varying layers of low-density polyethylene (LDPE) between the detector and the source and find that the spatial resolution degrades by ∼180 µm for every 100 µm of LDPE film. Sensitivity is reduced by half with the inclusion of ∼200 µm of additional LDPE film. Lastly, we demonstrate the practical utilization of Betabox, with an imaging test of its linearity, when coupled to a polydimethylsiloxane microfluidic chip designed for cell based assays.
Export citation and abstract BibTeX RIS
General scientific summary Positron emission tomography (PET) is a clinical tool that measures treatment response to cancer. The appeal of PET has motivated our design of a low cost tool that will allow clinicians/researchers a means to assess response to treatment with PET in cell cultures incubated in a microfluidic chip. These potentially cancerous cells can be treated with a drug and a PET probe can be used to access drug response. The aim of this paper is to investigate the performance of our direct beta imaging camera, which we call Betabox. We investigate the energy spectrum, background, efficiency, spatial resolution and count rate of our camera mainly with regards to 18F beta particles. We also consider the requirements of the microfluidic chip. Lastly, we present a study demonstrating the response linearity of Betabox when coupled to a polydimethylsiloxane microfluidic chip specifically designed to be used with Betabox for cell incubation.
1. Introduction
Clinical use of positron emission tomography (PET) has proven to be a critical tool for monitoring cancer treatment response. An increasing number of studies show that PET allows for early identification of ineffective anticancer therapy, and thus, reduces side effects and cost of ineffective therapy (Weber 2005). Treatment plans are increasingly incorporating multiple drug therapy alternatives in case a specific administered treatment is ineffective (Bollag et al 2012). The question then arises as to whether it is possible to use PET probes and a specialized device to develop an assay that will allow clinicians and researchers to assess the effectiveness of a drug therapy in-vitro by isolating small samples of patient tumor cells. Positron detection is a promising approach for such a device, given high detection efficiencies available with beta detection. Detection of beta particles is the premise behind tissue radioassays involving autoradiography (Pilgrim and Stumpf 1987) and intraoperative detection of PET probe accumulation (Piert et al 2007). The ideal cellular radioassay system will have the sensitivity to access small populations of cells down to the single cell, a task not practical with conventional gamma counters. Furthermore, the design of a non-destructive beta imaging system could allow serial studies of the same cell population. The resulting beta imaging system would find utility in any study that requires the ability to access molecular processes in-vitro using small cell numbers down to the single cell level. The system would then require an appropriate beta emitting probe that targets the biological pathway of interest.
Common beta particle imaging systems can be placed into one of two categories: indirect and direct detection systems. Indirect detection systems typically employ a scintillator to convert the beta particle energy into visible light, which is then coupled to a light sensitive detector (Barthe et al 2004, Karellas et al 1993, Ljunggren and Strand 1990, Laniece et al 1998). Direct detection systems convert the beta particle energy directly into an electric charge. Several groups have employed the direct detection approach using silicon semiconductors, commonly used in autoradiography to image ex-vivo tissue sections (Klein et al 2000, Mettivier et al 2005, Puertolas et al 1996). Most of these systems use a large number of channels to read out either discrete pixels as in the case of CCD and CMOS detectors (Cabello et al 2007, Ott et al 2000) or a series of orthogonal channels in the case of strip detectors (Bertolucci et al 1996, Overdick et al 1997, Russo et al 2008). The Medipix collaboration has demonstrated the capability to image biological processes in real time using a pixel array system (Bertolucci et al 2002, Abate et al 2000)
This paper presents the performance of Betabox, a direct detection beta particle camera based on a position sensitive avalanche photodiode (PSAPD). Betabox has high sensitivity with a low background and is capable of producing images using a simple 4 channel positioning readout. A microfluidic chip coupled to the PSAPD detector offers a system of simultaneous imaging and control of radioactive solutions with low radioactivity levels. Previous publications have demonstrated the ability of our camera to be used for in-vitro kinase radioassays (Fang et al 2010) and detect 18F-FDG uptake from small population of cells down to a single cell (Vu et al 2011). Here, we characterize the performance of our system by measuring energy spectrum, background, efficiency, spatial resolution, and count rate capability mainly with regards to 18F beta particles. Measurements of background and spatial resolution were considered both at room temperature (21 °C ± 1 °C) and at an elevated (37 °C ± 1 °C) operating temperature, as is often required for biological assays.
2. Materials and methods
2.1. PSAPD system description
The Radiation Monitoring Devices (RMD, Watertown, MA) PSAPD Model P1305-P has a compact design and 4-channel position readout (Shah et al 2002). The PSAPD measures 14 × 14 mm2 and has a p-layer thickness of 60 µm, of which 40 µm is depleted when a reverse bias voltage is applied (figure 1(a)). At a room temperature of 21 °C the device was operated with the anodes at a bias voltage of +1750 V, for a gain of approximately 1000 and a leakage current of 1 µA. For isotopes such as 18F, the positrons eventually produce two 511 keV photons by annihilation. The probability of detecting 511 keV gamma rays through the 60 µm of silicon is less than 0.1%. Gamma ray contribution was therefore ignored in the subsequent counting measurements.
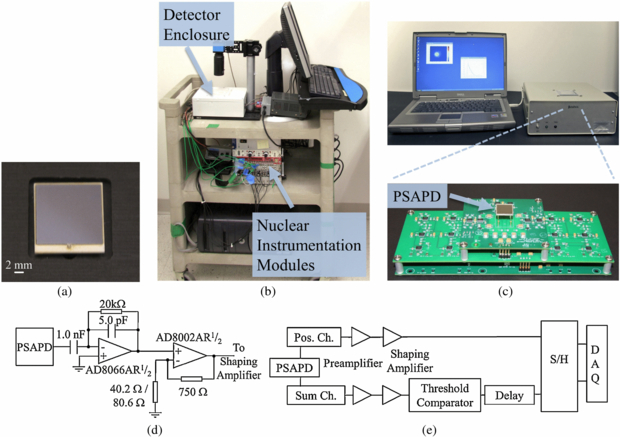
Figure 1. (a) Unpassivated 14 × 14 mm2 PSAPD. (b) Image of earlier version of Betabox utilizing nuclear instrumentation modules. (c) Current version electronics and detector are housed in a 25.5 × 24.5 × 9.8 cm3 enclosure. Also shown are the custom built readout electronics of the Betabox system, which utilize 3 stackable printed circuit boards. (d) Circuit diagram of the preamplifier electronics. For the first stage, a 100 ns RC time constant was selected for the transimpedance configuration. The second stage is composed of a voltage gain amplifier with a gain of 19.6 for the position channels and 10.3 for the common cathode channel. (e) Block diagram of the signal processing chain.
Download figure:
Standard image High-resolution imageThis work utilizes compact custom built printed circuit boards (PCBs) for the readout electronics, in contrast to earlier work which heavily relied on nuclear instrumentation modules (Fang et al 2010, Vu et al 2011) (figures 1(b) and (c)). In addition to the 4 position outputs encoded from the anodes, the PSAPD has a 5th output from the common cathode that measures the total charge collected. In this new design, the 5 outputs of the PSAPD first pass through high speed field-effect transistor input op-amps configured as transimpedance preamplifiers with a 100 ns RC time constant. This is a significant development over past approaches using charge sensitive preamplifiers (Cremat CR-110, Watertown, MA) as we wanted to optimize count rate performance (Dooraghi et al 2011). The input stage feedback network values were selected so that the resistor would provide the highest conversion gain possible and still allow for a finite parallel capacitance necessary to compensate for the large PSAPD junction capacitance (∼150 pF) and maintain circuit stability. This is followed by a gain stage to provide for volt-level signals, and then shaping amplifiers (shaping time: 500ns) (figure 1(d)). The shaped sum signal then passes to a threshold comparator. The trigger pulse output of the threshold comparator is delayed in order to align with the peak of the position channels. The delayed trigger is fed to four sample and hold (S/H) circuits (53ns acquisition time, 6 µs hold time) that maintain the peak voltage of the position channels. The delayed trigger also initiates an analog to digital conversion of the sampled position channel voltages using a DT9816-A ECON Series simultaneous sampling data acquisition system (Data Translation, Marlboro, MA), which has a maximum sampling rate of 150 kS s−1 (figure 1(e)).
Due to nonlinearity along the edges of the PSAPD, significant pincushion distortion occurs in the image when using the traditional Anger logic (Després et al 2007). A modified Anger-like algorithm was used, which employs the pairs of diagonal channels and has been shown to reduce the pincushion distortion (Zhang et al 2007).
Since this work focuses on only beta particle detection, unless otherwise stated, the PSAPD was covered with two layers of 0.3 µm of aluminum on 3 µm of Mylar film in order to block ambient light, and an additional film of 3 µm of transparent Mylar to serve as a protective layer. The covering to block out light and protect the device from damage is referred to as the passivation layer for the PSAPD.
2.2. 18F, 55Fe and 204Tl sources
18F was produced at UCLA using an RDS-111 cyclotron (Siemens Molecular Imaging, Koxville, TN). A NIST traceable 55Fe source (∼5 mm diameter, 1900 Bq), which emits monoenergetic 5.9 keV x-rays, was used to calibrate the energy spectrum. A NIST traceable 204Tl (∼5 mm diameter, 1244 Bq) point source was used to correct for temperature dependent gain differences of the PSAPD, as well as to measure sensitivity. The 204Tl source was selected as it is an electron emitter with similar average and maximum energy (245 and 764 keV, respectively) as 18F (243keV and 634keV) but with a much longer half-life of 3.8 years.
2.3. Phantom printing
The use of an inkjet printer to produce radioactive phantoms for quality assurance purposes has been shown to be reliable and inexpensive (van Staden et al 2007). While the density of the paper and the depth of the positron source inside the paper are not an exact match for microfluidic circuits, this method is analogous to the use of lucite or water phantoms to simulate soft tissues for high energy photon or charged particle tracking. These measurements introduce a level of bias, but can be used to understand basic device functionality or the effects of physical processes. Phantoms were designed using desktop drawing software and printed using a PIXMA iP4700 inkjet printer (Canon, Tokyo, Japan) on glossy photographic paper to access spatial resolution, spatial distortion, efficiency, and count rate. To determine printing reliability, the printed radioactive density as a function of total printed area was examined. A total of 32 MBq was diluted in ∼3 mL of ink and the solution was introduced into an empty ink cartridge. A printed area of 25 mm2 was sampled for every 425 mm2 region and its radioactivity measured in a Model 1480 Wizard 3'' calibrated well-type gamma counter (Perkin Elmer, Waltham, MA). The printed radioactive density was decay corrected to the time of measurement of the injected radioactive concentration. The ratio of decay corrected printed radioactive density (Bq mm−2) to initial radioactive concentration (Bq nl–1) was determined for each data sample and plotted as a function of total printed area (figure 2). The average ratio value was determined to be ∼13 nl mm−2 with a per cent standard deviation of less than 2%. The ink soaked into the photographic quality paper approximately 7 µm deep, as measured by a microscope (data not shown).
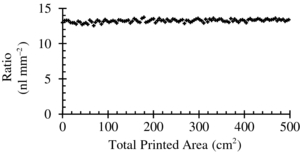
Figure 2. Graph of ratio of printed radioactive density (Bq mm−2) to initial radioactive concentration (Bq nl–1) as a function of total printed area.
Download figure:
Standard image High-resolution image2.4. Image correction
Even after the implementation of the modified Anger logic, the PSAPD exhibits increasing distortion further from the center of the device due to the four corner anode design and the logic used for producing the images (Zhang et al 2007). This pattern is expected to be distinct for each device, but constant, given the same operating parameters. To correct for this remaining distortion, nonlinearity maps are generated from measurements for each device.
To generate the nonlinearity correction maps, we performed the following steps:
- (1)Create a known dot pattern printed phantom
- (2)Align and image the known pattern on Betabox
- (3)Correlate control points on the image with their known x and y coordinate locations
- (4)Interpolate between known control points to estimate the correction for the entire image space
The interpolation method selected is Laplace interpolation (Press et al 2007) which is a more general form of bilinear interpolation that is easily applied to unevenly spaced control points (Sukumar 2003). The end results are x and y correction look up tables that give the corrected x and y coordinates xcor and ycor in terms of the distorted locations xdis and ydis:


These nonlinearity correction look up tables are then applied to the result of the positioning algorithm before creating a 2D histogram to display the image. Figure 3 shows the result of imaging an array of ∼0.3 mm printed dots (pitch 1.55 mm) containing 18F using the modified Anger positioning logic with and without distortion correction applied. The pixel size was set to 62 × 62 µm2. The pixel size was selected in order to have adequate sampling points to access spatial resolution.
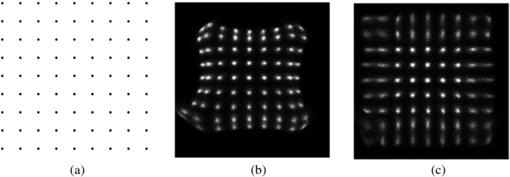
Figure 3. (a) Pattern of ∼0.3 mm diameter printed dots (pitch 1.55 mm) containing 18F to generate an image using the modified Anger logic (b) without and (c) with distortion correction applied.
Download figure:
Standard image High-resolution image2.5. Microfluidic chip
The microfluidic chip used in this study was made from a low cost polymer, polydimethylsiloxane (PDMS) (Duffy et al 1998). PDMS is a soft semi-porous material that allows the exchange of gases, but is impermeable to liquids. This makes PDMS microfluidic chips ideal for biological applications such as cell incubation. Figure 4 shows a schematic and image of our current PDMS chip design. Each chip contains five microchannels. Each microchannel consists of an inlet port for cell loading and reagent delivery via pipette, a bubble depletion region to minimize trapped air that can prevent flow within the microchannel, four cell capture chambers connected serially, and an outlet. Each cell capture chamber is 1 mm in width, 0.5 mm in height and 0.25 mm in depth, with a 0.8 mm separation between chambers. Each microchannel is separated from its neighbor by 2.0 mm, an adequate distance to avoid spillover effects between channels during measurements with 18F. Connections leading to chambers and between chambers have a cross section of 40 × 250 µm2. The bottom layer of the chip, which is in contact with the passivated PSAPD, is 50 µm and is also made of PDMS. Further details on the design and fabrication of these chips will be published elsewhere.
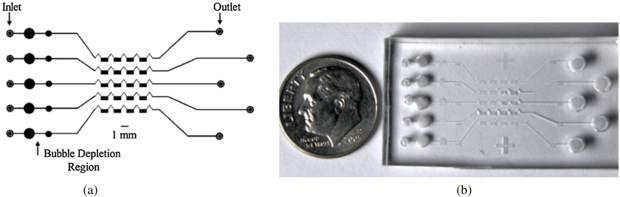
Figure 4. (a) Schematic and (b) image of the PDMS microfluidic chip.
Download figure:
Standard image High-resolution image3. Results
3.1. Energy spectrum
Figure 5 shows the measured 55Fe energy histogram plotted alongside that of 18F. The 55Fe x-ray energy resolution was measured to be 2.4 keV full width half maximum (FWHM). 18F emits positrons in a continuous energy spectrum with an average energy of 243 keV. The detection layer of the PSAPD is approximately 60 µm thick. This thin layer is insufficient to completely stop the 18F positrons as they traverse through the detector. Instead they deposit a fraction of their kinetic energy. For 18F positrons, the average energy deposited in the PSAPD was measured to be 58 keV when the source was placed directly on top of the unpassivated PSAPD. Figure 5 shows that a low energy threshold of 4 keV could be used to discriminate against most of the low energy noise from the PSAPD as shot noise due to the capacitance produced from the surface area of the device (Kim et al 2011) and readout electronics. All subsequent measurements in this work were performed with an energy threshold of 4 keV.
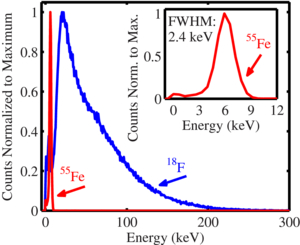
Figure 5. Energy spectra of 55Fe and 18F sources measured with Betabox. Inset shows a close-up of the 55Fe energy spectrum.
Download figure:
Standard image High-resolution image3.2. Background rate
Due to the ∼1000 fold gain of the PSAPD (Shah et al 2002) and the relatively large amount of energy deposited by beta particles such as 18F positrons, an energy threshold could be set to exclude most of the background noise. Figure 6 shows the background energy spectrum acquired in the entire device over a period of 72 h at a room temperature of 21 °C (see supplementary figure 1 for further illustration, available from stacks.iop.org/PMB/58/3739/mmedia). The background count rate of the PSAPD was measured to be 1.4 cph mm−2. As mammalian cells prefer an environmental temperature of 37 °C, operation of the PSAPD at 37 °C may be optimal for biological experiments. Consequently, the background rate at 37 °C was also investigated and found to modestly increase to 1.9 cph mm−2. The majority of the increase in counts originates just above the 4 keV threshold and can be removed with a modest increase in threshold. Since the PSAPD gain decreases with increasing temperature (Spanoudaki et al 2008), prior to the background measurement at this elevated temperature, the high voltage was increased to +1775 V. This voltage was selected by closely matching the measured 204Tl energy spectrum at 37 °C with the energy spectrum measured at 21 °C and + 1750 V, thereby correcting gain effects due to temperature (see supplementary figure 2, available from stacks.iop.org/PMB/58/3739/mmedia). The expected background rate due only to cosmic ray events on the PSAPD was estimated to be approximately 0.6 cph mm−2 (Knoll 2000). Further study is necessary to determine the relative contributions of cosmic rays, terrestrial environmental radiation and electronic noise to the PSAPD background count rate.

Figure 6. Background energy spectrum acquired for 72 h at a room temperature of 21 °C and a bias voltage of +1750 V.
Download figure:
Standard image High-resolution image3.3. Spatial resolution
A phantom line source was used to examine the position dependence of the spatial resolution of the PSAPD. The line source was approximately 110 µm wide and was placed over the protective Mylar film. Figure 7(a) shows an image acquired at 21 °C with the line source centrally positioned, as well as 1.6 mm, 3.3 mm and 4.4 mm away from center. The inset shows the central horizontal profile. A plot of the measured FWHM as a function of offset distance is shown in figure 7(b). Within 3 mm of the image center, the line profile resolution is better than 500 µm FWHM. Toward the edge of the PSAPD, 5 mm from the center, the line profile resolution degrades significantly to ∼1 mm FWHM. Measurements conducted at 37 °C demonstrate similar behavior. The intrinsic spatial resolution of the PSAPD has been reported to be 300 µm FWHM at the image center when measured with a high intensity light source (Shah et al 2002), in agreement with these measurements.
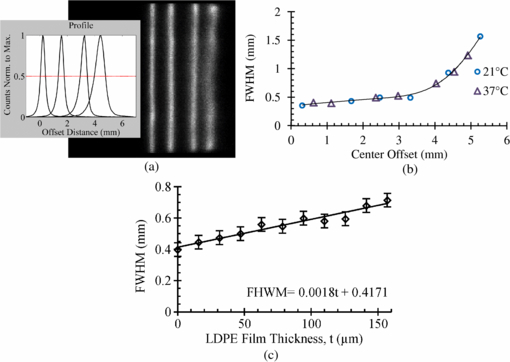
Figure 7. (a) Image taken at 21 °C of a line source positioned centrally and at 1.6, 3.3 and 4.4 mm off center. The inset shows the central horizontal profile. (b) A plot of the FWHM as a function of offset distance at 21 and at 37 °C. (c) A plot of the FWHM as a function of LDPE film thickness.
Download figure:
Standard image High-resolution imageCurrent microfluidic system designs being developed for Betabox applications use a PDMS substrate layer onto which cells are incubated, and this layer affects the measured spatial resolution. Using layers of thin low density polyethylene (LDPE) film, the spatial resolution was evaluated as a function of substrate thickness. The LDPE film was placed between the line source and the sacrificial Mylar film. Each layer of LDPE film had a thickness of 15.7 µm with a density of 0.92 g cm−3, which is similar to the density of PDMS (0.96 g cm−3). The line source was positioned at the center of the device over varying layers of LDPE. A plot of the FWHM as a function of LDPE thickness is shown in figure 7(c). At the image center, the line profile FWHM was measured to be 400 µm when the source was placed directly on top of the passivated detector. As the source to detector distance was increased by adding layers of LDPE material, the line profile FWHM degraded by approximately 180 µm for every 100 µm of LDPE.
3.4. Efficiency of beta detection
The source to detector distance degrades not only the spatial resolution of the PSAPD for beta particle detection, but also the sensitivity. Larger source to detector distances and higher density materials will attenuate the beta particles more as they traverse through. The absolute efficiency of the PSAPD detector was measured using the 204Tl source. The source to detector distance was again varied by using layers of LDPE film. Figure 8(a) shows the absolute efficiency as a function of LDPE film thickness. If the source was placed in direct contact with the PSAPD top surface, the absolute sensitivity, including the geometrical factor, would approach 50%. Given that positrons are emitted randomly and have an equal probability to be emitted toward or away from the detector, these results indicate that if a charged particle traverses the depletion layer of the detector, its detection would be almost certain.
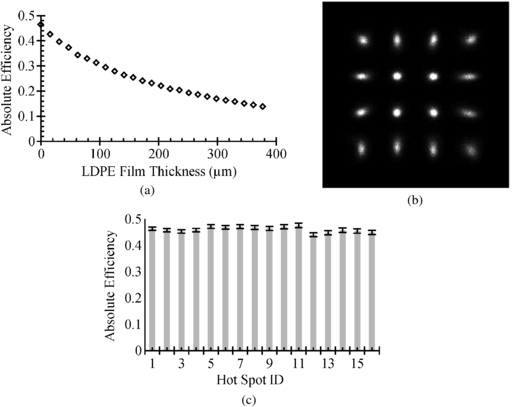
Figure 8. (a) Graph of sensitivity for 204Tl as a function of LDPE film thickness. (b) Betabox image of the 4 × 4 18F-ink printed sources (diameter ∼0.5 mm, pitch 3.1 mm) after applying spatial distortion correction. (c) Absolute sensitivity for each of the 16 sources. The order starts at the top left with source 1, then counting from left to right and ending at the far right of the bottom row with source 16.
Download figure:
Standard image High-resolution imageAn important parameter of any imaging system is the uniformity of response over the field of view (FOV) of the camera. Therefore, the sensitivity was measured as a function of position on the PSAPD FOV. An array of 4 × 4 18F-ink sources was printed on photographic paper (diameter ∼0.5 mm, pitch 3.1 mm). Figure 8(b) shows the PSAPD image of the 4 × 4 printed sources after applying the spatial distortion correction. The radioactivity of each individual FDG-ink source was measured using a Model 1480 Wizard 3'' calibrated well-type gamma counter (Perkin Elmer, Waltham, MA). The average absolute sensitivity measured for all the sources was 46% ± 1% (figure 8(c)). Excluding the 50% geometric efficiency of the detector, the intrinsic efficiency of Betabox is 92% ± 2%. This indicates that for this specific application, the Betabox performance is approaching the physical limits.
3.5. Lower detection limit
The lower detection limit (LDL), in units of cps mm−2, was determined by requiring a minimum per pixel signal to noise ratio of 5 as necessitated by the Rose Criterion (Cherry et al 2003). Thus the LDL is given as:

where σbg is the standard deviation of the background counts for a specified acquisition time measured in one pixel, T is the acquisition time in seconds, and R is the pixel per area factor.
To measure the LDL, a uniformly printed 18F-ink flood source was placed directly on top of the passivated PSAPD and allowed to decay over time. The initial radioactivity of the printed plane source was measured using a Model 1480 Wizard 3'' gamma counter (Perkin Elmer, Waltham, MA). Acquisitions of 1 min duration were taken sequentially as the source decayed on the protected PSAPD. An 18.8 mm2 region of interest (ROI) was then drawn at the center of each image. The background counts in the ROI measured independently for the same acquisition time were also subtracted. Figure 9 shows the net detected count rate per area as a function of the known radioactivity per area. In the calculation of LDL from equation 3, only statistical fluctuation in background was assumed so that σbg is equal to  where Nbg is the average number of background counts per pixel for a 60 s acquisition. Given this background rate, LDL was measured to be of 0.2 cps mm−2 for a 1 min acquisition and 62 × 62 µm pixel size. Taking into account the sensitivity of Betabox and the branching fraction of positron emission for 18F, the LDL for 1 min measurements was determined to be 0.5 Bq mm−2. The dotted vertical line represents this calculated LDL.
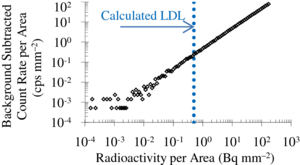
Figure 9. Determination of LDL. Plot of the background subtracted count rate per area as a function of radioactivity per area. Also shown is the calculated LDL level.
Download figure:
Standard image High-resolution image3.6. Upper detection limit
In order to measure dead time, an 18F source was placed on the camera system and allowed to decay (figure 10). A nonparalyzable dead time model was then used to estimate dead time using:

where m is the measured count rate, λ is the decay constant, τ is the dead time, n0 is the initial true count rate, and t is the elapsed time from initial measurement (Knoll 2000). The dead time from fitting to the model was determined to be 6.5 µs, which is in agreement with the nominal dead time of 6 µs set by the sample and hold circuit parameters.
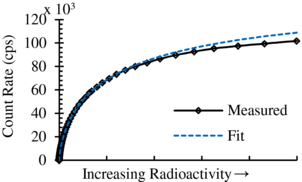
Figure 10. Plot of the measured count rate as a function of radioactivity with fit parameters determined using equation (4).
Download figure:
Standard image High-resolution imageCount rate induced image distortion was examined with two hot spots (diameter ∼1.6 mm) of approximately the same radioactivity of 18F separated by 5 mm. Figure 11(a) shows a sample image at a measured count rate of 102 000 cps. Figure 11(b) shows the resulting image with count rates <1000 cps. The chi square distortion metric was calculated using (Press et al 2007):

where Si is the number of events in pixel i for the sample high count rate data set, Ri is the number of events in pixel i for the reference low count rate data set, S = ∑Siand R = ∑Ri. The metric was used to determine the count rate at which distortion became statistically significant (5% probability level). Spatial distortion reached statistical significance at 21 000 cps (figures 11(c) and (d)). With an 18F source placed directly on the protected PSAPD, this corresponds to 55 kBq after correcting for the isotope branching fraction, system sensitivity and dead time. Since most probe uptake experiments to date (Fang et al 2010, Vu et al 2011) were performed at count rates below 5000 cps, an upper count rate limit of 21 000 cps should not affect practical experiments.
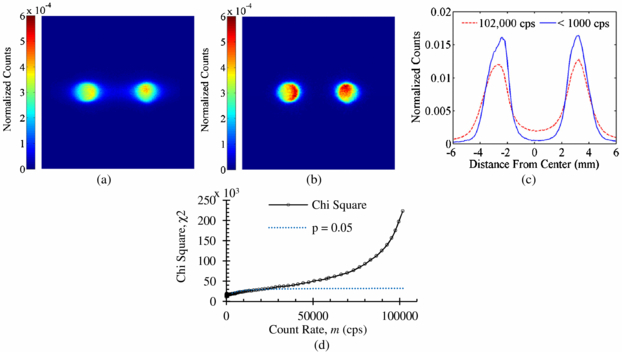
Figure 11. Image generated at a measured count rate of (a) 102 000 cps and (b) <1000 cps. (c) Horizontal projections. (d) Plot of chi square and critical value of p = 0.05 as a function of count rate.
Download figure:
Standard image High-resolution image3.7. System linearity with microfluidic chip
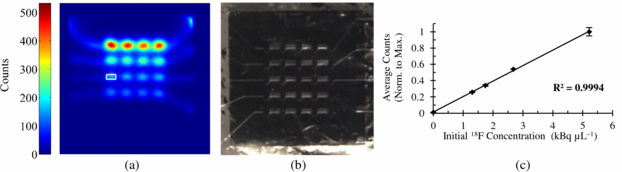
Four microchannels were filled with progressively lower radioactive concentrations of 18F in an aqueous solution, while the fifth microchannel was left unfilled. Radioactive concentrations were prepared at ratios of 1.00:0.50:0.33:0.25 with values at start of imaging 5.2, 2.7, 1.7 and 1.3 kBq µL−1 as measured using a Model 1480 Wizard 3'' gamma counter (Perkin Elmer, Waltham, MA) (figures 12(a) and (b). ROIs encompassing a region of 1.0 mm × 0.5 mm were drawn over each cell culture chamber on the acquired image. The ROI values were averaged and plotted as a function of initial 18F concentration in figure 12(c) to demonstrate the imaging linearity of the Betabox system in conjunction with a microfluidic cell culture chip.
Figure 12. (a) Betabox image of varying concentrations of 18F in an aqueous solution. A representative ROI is overlaid on the leftmost chamber of the third row from the top. (b) Optical image of PDMS microfluidic chip on the passivated PSAPD. (c) Plot of average counts (normalized to maximum) from each microchannel as a function of initial imaging radioactivity concentration.
Download figure:
Standard image High-resolution image
4. Discussion
We have demonstrated that it is possible to detect and image very low radioactivity levels of 18F positrons using Betabox, a compact PSAPD based system. Betabox uses a five analog channel readout scheme, greatly simplifying the necessary electronics. The pulse counting mode of operation and the high gain of the PSAPD allow much of the device noise to be eliminated by using a relatively low energy threshold (4 keV) both at room and at temperatures suitable for mammalian cell cultures (37 °C). This feature gives Betabox a background level that is only 2–3 times the expected rate of cosmic ray events. As a result, lengthy experiments that improve the LDL are easily performed. The simplicity of Betabox, which is based on a continuous piece of silicon, makes it a rugged device increasing its application potential. When protected from ambient light and moisture with a thin layer Mylar film, the detector is capable of very consistent measurements.
For short 1 min acquisitions, the LDL of Betabox with an 18F source placed directly on the passivated PSAPD was measured to be 0.5 Bq mm−2. The detection limit can be further improved with a longer acquisition time depending on the half-life of the isotope and/or larger pixel size. It was also shown that the geometry of the system plays a significant role in determining both the spatial resolution and sensitivity for the Betabox microfluidic imaging system. Both can be improved by decreasing the source to detector distance and by using thinner passivation layers. In terms of sensitivity, Betabox is already approaching the physical limits by detecting essentially all the 18F positrons that cross anywhere along its sensitive surface. Therefore and at least for 18F, a detector that would completely stop all the charged particles is not necessary and would not provide higher sensitivity. While in this work, we focused on 18F positrons, similar conclusions can be drawn for isotopes emitting charged particles of similar energies. Higher energy betas will be less affected by thicker substrates between the microfluidic and the detector providing higher sensitivity, but will also have lower imaging spatial resolution. The use of Betabox for imaging higher energy particles such as those of 32P has already been demonstrated in a biological application (Fang et al 2010). At the same time, the converse is also true, where betas with lower energy will be more affected by the thickness of the substrate layer and thereby Betabox will also have lower sensitivity for such isotopes.
The microfluidic imaging example demonstrated in figure 12, illustrates how Betabox can be used for multiplexed cell culture assays, in this case with 5 different conditions and four repeats of each condition. The spatial resolution of Betabox is not adequate to identify individual cells within microfluidic cell cultures, but that is not only due to the limited detector intrinsic spatial resolution. To achieve cell identification would require a system with a spatial resolution far better than the range of 18F positrons in water. Therefore the Betabox works in combination with a microscope that is used to count the number of cells in each cell culture chamber, and thereby allow the quantification of the average probe uptake per cell. These types of assays can be used as a novel tool to study the effects of single or multiple drug perturbations as a function of time in different types of cells as shown in Vu et al (2011).
5. Conclusion
In this work we investigated the performance parameters of Betabox in terms of efficiency, spatial resolution, and count rate. We also investigated with phantom sources the corresponding physical effects to these parameters due to the presence of polymer microfluidic chips enclosing the source. We found that Betabox is a high sensitivity and low noise charged particle imaging system that can operate without significant impairment of its performance at both room and at elevated temperatures, such as those suitable for culturing mammalian cells. The dark count rate is within range of the expected signal from cosmic rays, dictating a low detection limit that allows quantitative imaging of very small amounts of radioactive probes. While the use of the device has been demonstrated with cell based assays, we plan to continue its development to expand its utility.
Acknowledgments
The authors would like to thank the staff of the Crump Imaging facility at UCLA including Waldemar Ladno, Darin Williams, and Jeff Collins for their assistance with obtaining 18F solution for this study. The authors would also like to thank Hongkai Wang for valuable discussions on image distortion correction and David Prout for assistance on signal processing. Arion Chatziioannou and Nam Vu are coauthors of a patent owned by the University of California that includes the technology described in this work. This work was supported in part by the National Institutes of Health (R25CA098010 and U54CA119347), the Department of Energy (DE-SC0001249) and the UCLA Foundation from a donation made by Ralph and Marjorie Crump for the UCLA Crump Institute for Molecular Imaging.