
Abstract
The sky roller ride depends on interaction with the air to create a rolling motion. In this paper, we analyse forces, torque and angular velocities during different parts of the ride, combining a theoretical analysis, with photos, videos as well as with accelerometer and gyroscopic data, that may be collected e.g. with a smartphone. For interpreting the result, it must be taken into account that the sensors and their coordinate system rotate together with the rider. The sky roller offers many examples for physics education, from simple circular motion, to acceleration and rotation involving several axes, as well as the relation between wing orientation, torque and angular velocities and using barometer pressure to determine the elevation gain.
Export citation and abstract BibTeX RIS

Original content from this work may be used under the terms of the Creative Commons Attribution 3.0 licence. Any further distribution of this work must maintain attribution to the author(s) and the title of the work, journal citation and DOI.
1. Introduction
When amusement rides are studied in the physics classroom, the influence of air is most often neglected. However, in the new sky roller ride [1], the air plays a crucial role for inducing the rolling motion. The wings can be rotated so that the front of the wing points up or down. With different orientation of the two wings, the motion through the air leads to a torque around the direction of motion, as the ring of planes moves around the tower (figure 1). The direction of the torque is reversed when the orientations of the wings are changed. With practice, it is possible to change the orientation in phase with the motion, so that the plane makes larger and larger oscillations until it makes a full turn around its axis. It can then continue to spin ('roll') if the wings are held in position.
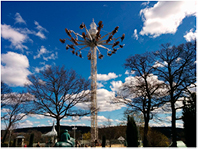
Figure 1. A SkyRoller in motion. The ring of 24 planes move up to the top of the tower, while also moving to, 11 times min−1 with an outer diameter 21.2 m for the tips of the wings.
Download figure:
Standard image High-resolution imageThis motion can be studied with, e.g. with a smartphone [2–4], which can measure rotation, as well as acceleration, in a coordinate system moving and rotating together with the rider. Only a decade ago, rotation measurements were a specialised task [5], well beyond the capabilities of most school laboratories, and they are still rarely used in education. In the sky roller ride, rotations are in focus, and this paper shows examples of measurements and interpretations of the data. Figure 2 shows one of the planes seen from front, together with a definition of the coordinate axes used to describe the motion in a comoving system. Rotations around the x, y and z axes are referred to as roll, pitch and yaw, respectively.

Figure 2. The comoving coordinate system used for the analysis. The x-axis points in the direction of motion, the y-axis to the side and the z-axis toward the head. These axes are also referred to as longitudinal, lateral and vertical axes, respectively.
Download figure:
Standard image High-resolution image2. The motion of the sky roller
2.1. Around the tower
Figure 1 shows a SkyRoller ride in motion. A plane in the outer ring moves in a circle with a radius  m. This value is obtained from the total diameter, 21.2 m [1] but accounting for the horizontal distance between the center of the plane and the outer wing tip. According to the data sheet [1], the plane moves around the tower 11 times min−1, giving a period of
  s. We can also introduce an angular velocity
  , where the negative sign holds for the clockwise motion and the stationary axis eZ marks the upwards direction of the tower. We thus find a speed
  m s−1 for the planes in the outer ring. The acceleration due to this circular motion is given by
  . A park can also choose to run the ride with 9.5 or 8.5 turns min−1 [6], which would lead to correspondingly smaller accelerations. Smaller values for velocity and acceleration are also obtained for planes in the inner ring.
To counteract the force,  , due to gravity, while also providing the force
  necessary for the acceleration
  of a rider with mass m, the force from the ride must be
  . For a centripetal acceleration
  , the size of the force from the ride becomes 1.6 mg, directed upwards and towards the centre, at an angle of about
  from the vertical, as in figure 3. A rider will perceive the direction of this force from the ride as 'up', (figure 3), due to the equivalence principle, as discussed, e.g. in [7–9].
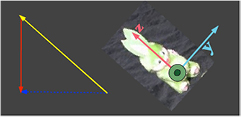
Figure 3. The forces acting on a rabbit, which is oriented with the head 'up' along the force from the ride. The yellow line marks the direction of the total force from the ride on the rider, and defines the 'upward' directions in the discussions. Due to the equivalence principle, the vector  acts as an 'effective' acceleration of gravity at any given point of the motion.
Download figure:
Standard image High-resolution image2.2. Sensor data, acceleration, rotation and coordinate axes
Figure 4 shows data collected with smartphone built-in sensors [3] during the start of the ride in a one of the planes closest to the tower, with an estimated radius of rotation  m. It gives a first illustration of the forces and rotations, expressed in the comoving coordinates. The air pressure gives an indication of elevation, and drops from 1016.7 hPa to 1013.2 hPa as the ride moves toward the top of the tower. This change in air pressure can be converted to an elevation gain, giving
  m.
m.

Figure 4. The start of a ride, illustrated with sensor data from a smartphone, collected with the app Physics Toolbox Roller Coaster [3]. The first graph shows the total and lateral forces from the plane on the the rider, expressed as a components of 'g-factor', i.e. of the vector  . The second graph shows angular velocities around the y and z axes (pitch and yaw) and the third graph shows the change in air pressure, reflecting the elevation change. At the beginning of the tour the wings were held in horizontal position, then, at around 27 s rapidly changed so that the right wing pointed down and the left wing pointed up, resulting in a positive torque around the x axis (roll). The wings were kept in position to allow the plane to find an equilibrium orientation for that wing configuration, before the wings were placed in neutral position, (at around 30 s in the graph), to allow the plane to oscillate around that configuration, before moving the wings again to exert a negative torque around the x axis (see also figure 5).
Download figure:
Standard image High-resolution imageAs long as the planes (and sensors) do not tilt, the rotation is only around the vertical axis, both in the stationary and rotating system. This rotation in relation to the body is referred to as 'yaw', and the negative sign indicates clockwise motion. From the graphs we can see that the ride starts moving upwards before the rotation starts, at around 93 s in the graph. As the plane starts to move faster around the tower the total force on the rider becomes larger, as seen by the increasing red curve in the top figure. However, the sideways (lateral) force remains close to zero—since the plane is free to rotate, to align with the vector  . The tilt of the plane is most evident in the angular velocity curve for the 'pitch', which rises around 18 s, before the effect is clearly noticeable in the force on the rider. The rotation axis, eZ, for the main rotation around the tower can be expressed in terms of the comoving coordinates as
  , if the plane is tilted by an angle θ. Since the angular velocity around the tower is negative and the angle θ is positive, both the z component (yaw) and the y component (pitch) are negative.
2.3. Oscillations around the equilibrium angle
To start the rolling of the plane, the wings must be tilted as in figure 5. The torque from the oncoming air for a tilt by an angle ϕ is proportional to  , which has a maximum [11] for
  , which is larger than the maximum tilt angles allowed by the construction (
 for airplanes in the outer circle and
  for the inner circle [6]).

Figure 5. Torque on the plane (viewed from front) for different orientations of the wings. The sign of the torque around the x axis (the direction of motion) is defined to be negative in the photo to the left. (Photos: screen shots from [12].)
Download figure:
Standard image High-resolution imageBy keeping the two wings in opposite orientation, a torque τ can be exerted on the plane, causing it to rotate slightly from the equilibrium angle defined by direction of the the vector  . As soon as the plane is at an angle θ from this equilibrium orientation, there is an opposing torque, due to gravity and acceleration. This opposing torque causes the rotation to slow down and stop and then, the plane to swing back, past the equilibrium orientation. When the plane changes its direction of rotation, the orientations of the wings must be reversed, and the plane can then rotate to a larger angle next time. With experience and practice, this change can be made more quickly and timely, leading to faster increase in the maximum angle of the swing, and ultimately to a fast rolling.
Figure 6 shows the angular velocity together with the 'vertical' and 'lateral' components of the vector  for the start of a ride, up to the transition to fast rolling. These data were collected by one of the authors (ML) with a home-built dedicated system built into a small custom-made case (figure 7).

Figure 6. Data from the start of a SkyRoller ride. The green curve shows the angular velocity (in s−1) around the x axis. The red curve, which is 1 before the ride starts, shows the 'vertical' (z) component of the force on the rider (divided by mg). The blue curve shows the lateral (y) component, which depends on the sine of the angle θ between the rider and the vector ( ). As the plane moves faster around the tower, the value
  can exceed 1. Note that the coordinate system defined in figure 2 rotates together with the body of the rider.
Download figure:
Standard image High-resolution image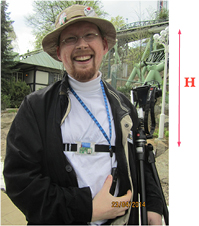
Figure 7. One of the authors (ML) ready for a ride carrying the home-built system, with a custom-made small case to enable easy measurements along the heartline. The assembly includes an MPU-6050 6DOF-sensor, PIC18F26K22 P, with FT230x USB-serial for settings and FW-updates, and an SD-card to save the data. Data are sampled with 50 Hz. The distance H between head and sensor corresponds to the rotation radius for the head as the airplane rolls as discussed in section 3.2.
Download figure:
Standard image High-resolution imageThe total torque on the airplane can be expressed as  , where M is the mass of the plane (including the rider), h is the distance between the center of mass and the axis of rotation, and τ is the torque from the two wings which is independent of the angle
  , but changes sign when the orientations of the wings are interchanged. It should also be noted that the torque from the wings is reduced for fast rotations, since the rotations reduce the relative velocity between air and wings.
The equation for the time dependence of the angle becomes

The dots denote time derivatives, but we can also use also the notation  for the angular velocity and
  for the angular acceleration. This formula can be used to obtain an expression for the rotational energy
  , using the relation
analogous to the expression  for linear motion. We show in the appendix how this equation can be used for a more detailed investigation of the initial rolls.
2.4. Data for the full ride
Figure 8 shows the lateral component of the accelerometer data for the full ride, together with data from the first ride of one of the authors (AMP), collected with a wireless dynamic sensor system (WDSS) carried in a data vest [10]. The lateral component was chosen for the graphs in figure 8, since it is more sensitive to small changes in angle. Smartphone sensors (see e.g. [2–4]), which typically measure up to  along each axis, are also well suited for this ride, with its relatively small forces.

Figure 8. The lateral (y) component of the accelerometer data for two rides in the SkyRoller aeroSpin. The upper graph shows a ride that did not make full rolls, whereas the lower graph shows a ride with more than 40 full turns. The start of the the fast rolling ride is shown in more detail in figure 6.
Download figure:
Standard image High-resolution imageFigure 8 provides a comparison between a ride where the planes never makes it all the way round and one ride with more than 40 full rolls. Fast rolling requires practice in order to achieve the right timing and the fast reversal of the orientation of the wings.
A first observation is that the maximum lateral force is about 1.6 mg, both for the limited turns and for the full turns, where the angular velocity is much larger. Also the vertical components reach essentially the same value (positive, as well as negative). The centripetal acceleration connected with the rolling of the plane must thus be negligibly small. This reflects the position of the sensors close to the axis of rotation. The value for the lateral component thus depends only on the angle relative to the force from the ride.
3. Rolling on
The angular velocity around the x axis is of particular interest in the SkyRoller ride. This is also accessible through smartphone sensors [4]. Figure 9 shows the angular velocity data from the rolling ride together with the accelerometer data from the lower graph in figure 8, both obtained using the home-built system shown in figure 7.

Figure 9. The lateral component of the accelerometer data together with angular velocity for the rolling ride in figure 8. The slow change in the gyroscopic data reflects the changing direction of the plane relative to the wind, as the ride rotates with a period of about 5.5 s around a vertical axis.
Download figure:
Standard image High-resolution imageThe main rolling motion happens with a period around 1 s, corresponding to an angular velocity of magnitude around  , consistent with the results in the graph. In addition, we can note a small variation in the amplitude, with a period around 6 s. A headwind causes a larger torque, and a slightly faster rotation, so this period reflects the time for a full turn around the tower.
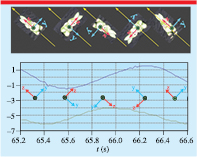
Figure 10 shows in more detail a sequence of the fast rolling. The angular velocity, ω, varies during a full turn, and the resulting variation in rotational energy  reflects the change in potential energy between the 'upright' and 'upside-down' positions. The difference between maximum and minimum angular velocity during the spinning also gives an indication of the critical angular velocity
  required at the bottom to make a full turn. Choosing e.g. the oscillations around the time 66 s in figure 10 we obtain an estimate

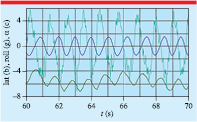
Figure 10. Details for a sequence of the full turns, from the data in figure 9. The lateral component of the force (blue) reflects the sine of the angle θ. The angular acceleration (cyan) was obtained as a numerical derivative of the rolling velocity ω (green).
Download figure:
Standard image High-resolution imageThis can be compared to the angular velocity just before the time 30 s in figure 9.
We note that the slope of the accelerometer data is slightly smaller when going from negative values (right side up) to positive values (left side up) than vice versa. The smaller slope corresponds to a slower rotation, i.e. with the plane 'upside down' and this rotation pattern is consistent with a negative angular velocity around the x axis, as seen also in figure 11, which shows the rotation of coordinate axes in more detail for one period. A positive sign corresponds to the motion of a right-handed screw. The motion illustrated in figure 11 is instead in the negative x direction, consistent with the negative sign of the angular velocity for rolling. We can also note that the angular velocity keeps getting more negative for a short while after the lateral force is zero as the plane passes the 'lowest' point. This is due to the torque of the wings that continues to add energy.
Figure 11. Illustration of the rotation of the coordinate axes for one full turn, together with detailed data from figure 9. The blue curve shows the lateral force, indicating the orientation of the sensor, whereas the green curve shows the angular velocity, which is negative for the rotation direction shown.
Download figure:
Standard image High-resolution image
3.1. Limits to the angular velocity
During the fast rotations, the wings are kept in the same position, and we might have expected a continued increase of angular velocity, if the torque had remained constant. However, for fast rotations, the speed of the outer parts of the wings becomes comparable to the speed of the plane relative to the air, leading to a reduction of the torque. (The wing tip is more than r = 1.3 m away from the x axis. The speed of the wing tip due to the rotation becomes,  m s−1 for the fastest rotation.) As the force from the air is proportional to the square of the speed relative to the surface, this can have a large effect on the rolling, leading in effect to a limitation of the angular velocity. The approximations used in the attempt to model the motion are thus valid only for small angular velocities.
3.2. Acceleration of the head during the rolling
The centripetal acceleration due to the rotation around the x axis does not have a significant influence on the forces measured with a sensor close to the rotation axis. However, the fast spinning causes a sufficiently large acceleration of the centre of mass to keep the body pushed into the seat also in the upside down position (or, rather, the seat pushes the body to provide the additional force required for the centre-of-mass acceleration). In fact, the rotation around an axis close to the heartline can be seen as a body centrifuge. The acceleration of the head, can be estimated using the measured angular velocities:

towards the center of rotation at a distance H. For most of the turns, the angular velocity at the 'bottom', when the plane and rider are 'upright' is around  s−1, which corresponds to an acceleration
  g for a distance
  m. The force on the head required for this acceleration needs to be added—as a vector—to the force required for the accelerated motion of the heartline, which is about 1.6 mg pointing up and towards the centre as shown in figure 3. The body then needs to pull the head (with mass mH) towards the body with a force
  . This corresponds to a 'negative g force', −0.2g. For the faster rotations, the angular velocity reaches
  s−1 in the 'upright' position, and
  s−1 in the upside-down position. The top of the head then experiences a negative g force around −3.4g.
Safety standards for amusement rides typically limit negative vertical g forces to −2g. However, in a rotation around the heartline the lower part of the body accelerates in the opposite direction. We are not aware of standards that apply for rotations around the heartline. However, we may consider the rotation-induced pressure in a liquid with density ρ at a distance r from the axis, rotating with an angular velocity ω can be written as  . This be compared with the pressure
  of a stationary liquid at a level h below the surface. Even for the largest angular velocities shown in figure 9, the rotation-induced pressure at 0.5 m from the axis is equivalent to the pressure at 0.8 m below the surface. This is thus significantly less than if the whole body is upside down or exposed to −1g in other ways. Still, some riders report that they experience a light headache after having achieved a large number of spins. The effect from the rotation around the heartline is added to the forces on a point on the rotation axis.
4. Discussion
A ride, such as the sky roller invites discussion of many aspects of physics. The forces during motion without rolling are analogous to forces in a chain flyer ride [8]. The rotations of the plane bring in angular velocities, torque and rotational energies as interesting concepts. The possibility to use the wings to control the motion adds many additional challenges, e.g. identifying the direction of the force from the air on the wings, and how the force, as well as the resulting torque, depends on the tilting angle of the wing.
Modern technology offers many opportunities to collect data during the ride. A combination of accelerometer and gyroscopic data provides possibilities to check consistency of the data. However, for an understanding of data collected, a thorough discussion of the directions and coordinate axes is essential. In the sky roller ride, the motion of the body to change the orientation of the wings may also change the orientation of the axes of a sensor carried on the upper part of the body, bringing in additional complications. The analysis can be performed at many different levels of difficulty, with different types of mathematics and physics in focus, and many different types of educational assignments and student problems.
Acknowledgments
We would like to thank Kenneth Berndtsson at Liseberg for providing additional information about the ride. We would also like to thank Liseberg for invitations to pre-opening events for the Aerospin ride, when we collected most of the data, and for permission to use screen shots from the instruction movie [12]. Discussions with Werner Stengel and David Eager about amusement ride safety standards, and with Michael Axelsson about blood pressure in amusement rides, are gratefully acknowledged.
Appendix.: Initiating the rolling
The equation of motion (1) for the angle can be used to investigate the initial partial rolls in more detail. The initial angular velocity is  at the bottom, with
  . The rotation caused by the torque from the wings continues until the plane comes to a stop at a larger angle θ, where again
  . We can write
This gives a relation between the angle for the first swing in terms of the torque from the wind and 

Assuming this angle to be small (which is consistent with the data), we can use the series expansion  , giving
  . We can also note that the equilibrium angle would occur when the torque from the wind cancels exactly the torque due to gravity, which happens for the angle
  .
.
As the plane changes direction of rotation, the direction of the torque should be reversed. Assuming that this happens instantly, we get for the motion back to the bottom

As the plane passes the lowest point, it thus has an angular velocity given by

(The contribution from the torque due to the force of gravity cancels exactly its contribution on the way up.)
Continuing to the other side, the plane already has an angular velocity  and continues to a new angle
  (of opposite sign to
  ), given by the relation

This can be rearranged to a relation (which may be solved numerically):

After turning at  the plane comes down again, passing the lowest point with

In this way, the work done by the torque on the way up is increased by the same amount coming down again, and the resulting rotation energy at the bottom is carried over to the next partial roll.
Biographies

Marcus Löfstrand is roller coaster enthusiast. A production technician at Ericsson, working will all aspects of electronic design, from cirquits to microprocessor programming, he enjoys designing all kinds of electronics solutions to different problems, including amusement ride measurements.

Ann-Marie Pendrill is director of the Swedish National Resource Centre for Physics Education and professor in science communication and physics education at Lund University. Her research background is in computational atomic physics, but her more recent work has focused on various aspects of physics and science education. She has used examples from playgrounds and amusement parks in her teaching in physics, teaching and engineering programmes. (Photo credit: Maja Kristin Nylander.)