

Abstract
A new and powerful molecular descriptor termed the LDM (localization–delocalization matrix) has recently been proposed as a molecular fingerprinting tool and has been shown to yield robust quantitative-structure-to-activity/property-relationships (QSAR/QSPR). An LDM lists the average number of electrons localized within an atom in a molecule along its diagonal while the off-diagonal elements are the pair-wise average number of electrons shared between every pair of atoms in the molecule, bonded or not. Hence, the LDM is a representation of a fuzzy molecular graph that accounts for the whereabouts of all electron(s) in the molecule and can be expected to encode for several facets of its chemistry at once. We show that the LDM captures the aromatic character of a ring-in-a-molecule by comparing the aromaticity ranking based on the LDMs and their eigenvalues of 6-membered carbon rings within (polycyclic) benzenoid hydrocarbons with the ranking based on four well-established local aromaticity measures (harmonic oscillator model of aromaticity, acromatic fluctuation index, para delocalization index, and nucleus independent chemical shift(0)).
Export citation and abstract BibTeX RIS
1. Introduction
There has been a resurgence of intense interest in quantifying or even defining the concept of aromaticity especially with the advent of measures of electron delocalization in the 1990s [1–10]. Chemists recognize intuitively what constitutes aromaticity, but when asked for a definition one may get as many answers as there are respondents. Aromaticity is loosely defined as the tendency of an aromatic ring to react by substitution as opposed to addition. The various definitions tend to fall into groups that are primarily structural [11–13], reactive [14–17], energetic and thermochemical [17–20], magnetic [1, 3, 7, 21–25], electronic [5–7, 9, 10, 17, 26–52], those based on the topological properties of the electron density or/and of the electrostatic potential [6, 25, 29, 52–55], and chemical graph theoretical (CGT) [30, 56–61].
Schleyer et al define aromaticity as 'a manifestation of electron delocalization in closed circuits, either in two or three-dimensions' [4]. Several authors have already developed measures of aromaticity that are based on the characteristics of electron delocalization as quantified, for example, by the delocalization indices (DIs) [45, 62, 63] of the Quantum Theory of Atoms in Molecules (QTAIM) [64–66]. DIs, whether two-centered [45, 62, 63] or multi-centered [9, 31, 32], are ideally suited for the study of aromaticity since they can quantify the delocalization of the electronic charge in closed two- or three-dimensional rings manifested in the observed structural, magnetic, and energetic characteristics of aromaticity [26].
We have recently shown that the complete set of DIs and localization indices (LIs) of a molecule, when cast in matrix format (localization–delocalization matrix, or LDM), constitutes a powerful molecular fingerprinting descriptor that correlates strongly with observed molecular properties [67–71]. LDMs and their closely related delocalization only matrices are used in this study to measure the similarity distance of a ring from benzene and investigate the correlation of this distance with well-established structural, electronic, and magnetic aromaticity measures. In other words, we report similarity distances of rings-in-molecules (RIMs) to benzene followed by a statistical comparison to some of the commonly used/popular aromaticity indices.
No known single criterion can completely encapsulate or measure aromaticity which is inherently multifaceted and multidimensional. Because of that, aromaticity measures not infrequently disagree in the ranking of aromaticities of RIMs [72].
2. The LDM
Bader's QTAIM [64–66] defines an atom in a molecule Ω as the union of the complete and infinite set of gradient paths that span a given basin and its associated attractor (usually a nucleus, but non-nuclear attractors are also known to exist). Once the molecular space has been partitioned at inter-atomic surfaces of local zero-flux in the gradient of the electron density, numerical integration of a given property density over an atomic basin yields the corresponding atom-in-molecule average to this property which represents its additive contribution to the corresponding molecular property. As an example, the integral of the electron density over an atom's basin gives its atomic population N(Ω) which when multiplied by the charge of an electron (−1 atomic units (a.u.)) and added to the nuclear charge ZΩ equals the charge of the atom in the molecule q(Ω):

The absolute value of the Fermi hole density integrated twice over the volume Ω counts the number of electrons Λ(Ω) localized within this volume, this number is known as the localization index (or LI). If one integral is carried over Ω and the second over Ω' then the count is called the DI which is the number δ(Ω, Ω') of electrons shared or delocalized between Ω and Ω'.
Within the single determinant self-consistent field (SCF) Hartree–Fock (HF) approximation, for a closed-shell molecule, these indices are defined [62]:

and

where the Fermi correlation is given by
and where Skl(Ωi) = Slk(Ωi) is the overlap integral of spin orbitals φk and φl within the volume Ωi, and where σ can refer to either α or β spin. The QTAIM integration software that we use, AIMAll [73], approximates the second-order density matrix from the first-order density matrix [74] for post-SCF wavefunctions expressed in terms of natural orbitals.
The LIs and DIs and the atomic population (and charge) of a given atom in a molecule are not independent as they are inter-related by:
where n is the number of atoms in the molecule.
The total number of electrons in the molecule N is correspondingly expressible as a sum of the total number of all atomically localized electrons (Nloc) and the total number of electrons (Ndeloc) delocalized between the n(n − 1)/2 unique pairs of atoms in the molecule [71], that is:
These quantities can be conveniently cast into a LDM, or ζ-matrix [71]:
where, as indicated, any row or corresponding column sum yields a given atomic population N(Ω) (equation (5)) which all sum to N by equation (6). The sum of the diagonal elements, the trace, gives Nloc, while Ndeloc is obtainable by difference (equation (6)).
The LDM has been shown as a promising molecular descriptor as it captures several features of the electron density and electron delocalization at once in one compact mathematical object amenable to the mathematical treatment developed within the context of CGT [75–77]. As with any matrix representative of a graph (here the fuzzy molecular graph), there exists an n! labeling ambiguity since the organization of the matrix elements depends on the atomic labeling/numbering scheme. Chemical graph theorists solved this problem by extracting matrix invariants, that is, those properties specified by a matrix which are invariant to the simultaneous permutaion of rows and their corresponding columns. Among invariants we cite the determinant, the trace, the characteristic polynomial, the eigenvalues (or correspondingly the diagonalized matrix), and the distance between a matrix representative of a given molecule from the matrix representative of another taken as a reference.
Distances between matrices are not uniquely defined, but an intuitively appealing definition is the distance defined by Frobenius since it is a Euclidean distance in the n × n matrix space, where n is the number of atoms defining the matrix size. The Frobenius distance between two molecules A and B, each represented by an n × n LDM, is defined as the norm of the difference matrix:
where aij and bij are two corresponding matrix elements in matrices A and B. The working assumption is that the magnitude of such distance between two LDMs is a measure of their dissimilarity.
In this work, the similarity of a 6-membered carbon ring in a molecule to the carbon ring in benzene, as quantified by LDMs distance (equation (8)), is correlated with independent known measures of aromaticity. Next we investigate the correlation of the eigenvalues, invariants that are independent of comparisons with a reference such as benzene, with aromaticity indices.
3. Rings-in-molecules (RIMs)
The rings considered in this study are all 6-membered carbon rings that occur in polycyclic benzenoid hydrocarbons. As the number of hydrogen atoms attached to a ring in a molecule depends on the immediate neighborhood, only the carbon skeleton of a given RIM is considered. Carbon atoms that belong to more than one ring simultaneously are included in each of the rings being considered. For example, phenanthrene (scheme

Scheme 1. Phenanthrene and its atom and ring labeling scheme.
Download figure:
Standard image High-resolution imageFollowing the labeling in scheme
In contrast with the full molecular LDM, the sum of the matrix elements of these partial LDMs will generally not yield an integer number of electrons since some electrons will always be shared with the hydrogen atoms, the substituents, or the other fused rings.
The Frobenius distance of the LDM representative of a RIM to the LDM representative of the carbon circuit of benzene is invariable to labelling as long as the ring atoms are labelled in the same order as benzene. For example, if we choose to construct the RIM–LDM matrix by listing one of the ortho-carbon atoms as the second atom (C2) immediately following any arbitrary choice for the ipso-carbon atom (C1), the meta-carbon attached to C2 as the third (C3), the para- as the fourth (C4), the second meta- as the fifth (C5), and the second ortho- as the sixth (C6), then the Frobenius distance from benzene is insensitive to the arbitrary choice of C1 as long as we follow the same numbering algorithm for both the RIM and for benzene.
4. The molecular set
The chemical structures of the molecular set used in this study are depicted in scheme

Scheme 2. Molecular set supplying the 'rings-in-molecules (RIMs)' for this study.
Download figure:
Standard image High-resolution imageThere are in total 8 molecules and 13 symmetry-distinct rings. We introduce the following symbols for the 13 different rings where (I) and (O) symbolizes the inner- or outer-ring respectively: benzene = Ben, naphthalene = N, anthracene = A, naphthacene = Nc, phenanthrene = P, chrysene = Ch, triphenylene = T, and cyclohexane = Cyc. Thus, the symbol P(O) signifies the outer ring in phenanthrene. The complete set of symbols for every ring is listed in table 1.
Table 1.
Aromatic rings in the molecules displayed in scheme
| Molecule | Ring | Codea | dFrob | HOMAb | PDIb | FLUb | NICS(0)b |
|---|---|---|---|---|---|---|---|
| Benzene | Ben | 0 | 1.001 | 0.105 | 0 | −11.5 | |
| Triphenylene | Outer | T(O) | 0.1634 | 0.930 | 0.086 | 0.003 | −10.6 |
| Phenanthrene | Outer | P(O) | 0.1991 | 0.902 | 0.082 | 0.005 | −11.4 |
| Chrysene | Outer | Ch(O) | 0.2301 | 0.859 | 0.079 | 0.008 | −11.1 |
| Anthracene | Inner | A(I) | 0.2420 | 0.884 | 0.070 | 0.007 | −14.2 |
| Naphthalene | N | 0.2816 | 0.779 | 0.073 | 0.012 | −10.9 | |
| Naphthacene | Inner | Nc(I) | 0.2945 | 0.774 | 0.063 | 0.011 | −13.8 |
| Chrysene | Inner | Ch(I) | 0.3574 | 0.553 | 0.052 | 0.019 | −8.2 |
| Anthracene | Outer | A(O) | 0.3859 | 0.517 | 0.059 | 0.024 | −8.7 |
| Phenanthrene | Inner | P(I) | 0.4026 | 0.402 | 0.053 | 0.025 | −6.8 |
| Triphenylene | Inner | T(I) | 0.4306 | 0.067 | 0.025 | 0.027 | −2.6 |
| Naphthacene | Outer | Nc(O) | 0.4417 | 0.325 | 0.051 | 0.031 | −6.7 |
| Cyclohexane | Chair | Cyc | 0.7408 | −4.340 | 0.007 | 0.091 | −2.1 |
| r2c | 0.978 | 0.917 | 0.858 | 0.608 | |||
| adjusted-r2c | 0.973 | 0.909 | 0.845 | 0.572 | |||
| Order of polyn. | 2 | 1 | 1 | 1 |
aUnique short-hand code notation to identify the 13 symmetry-unique rings subject of this work.
bData obtained from [42].
cThe statistical model is a polynomial of the form: aromaticity index = a0 + a1 × dFrob + a2 ×  The model yields the following fitting constants: HOMA: a0 = 0.6821, a1 = 5.3303, a2 = −16.0287; PDI: a0 = 0.107, a1 = −0.140; FLU: a0 = −0.0193, a1 = 0.1232; NICS(0) : a0 = −14.48, a1 = 16.70.
5. Computational details
Quantum chemical calculations were performed at the HF level using a 6-31G(d) basis set, the same level of theory used in the studies the results of which are being compared. Geometries were first optimized then the wavefunctions obtained at this level of theory which is denoted in standard notation as HF/6-31G(d)//HF/6-31G(d). All electronic structure calculations were performed using the Gaussian software [78]. The resulting wavefunctions were then subjected to QTAIM integrations using AIMAll/AIMStudio program [73] to calculate the LIs and DIs. The program AIMLDM [68] was then applied to the AIMAll sum files to extract the LDM for the entire molecular set followed by the extraction of matrix invariants and Frobenius distances. In total we have 13 symmetry-unique different RIMs being analyzed in this work.
6. Results and discussion
We first investigate the statistical correlations between the Frobenius distances of the RIMs in the molecular set in scheme
6.1. Definitions of the measures of aromaticity considered in this work
The structural index we consider in this study is the popular Krygowski HOMA index which is defined as [12, 13]:
where m is the number of bonds in the ring (m = 6 for all rings considered in this study), α is a parameter which equals 257.7 for carbon–carbon bonds that yields 0 (non-aromatic ring) ≤ HOMA ≤ 1 (benzene, where all bond lengths are equal in lengths Ri = Ropt = 1.388 Å, the optimized carbon–carbon bond length in benzene).
The NICS index, extensively studied by Schleyer and coworkers, is the chemical shift at the ring center and has a negative value for aromatic systems and a positive value for anti-aromatic systems. This quantity is called NICS(0) to indicate that it is evaluated in the ring plane [3], and is the sole NICS that is considered in this work, hence we will drop the (0) designation from now on. The more negative the value of NICS indicates a more aromatic system. There are however odd results as some rings (e.g. central ring of anthracene) can give values for NICS that are more negative than benzene itself [42]. Such artefacts prompted the workers in this domain to introduce modifications into the NICS, e.g. by measuring above the center of the ring by a given distance perpendicular to the ring plane [7]. However, NICS evaluated at the center of the ring appears to remain the most used and is the one considered in the comparisons described below.
Important electronic aromaticity indices, developed and extensively studied by Solá and coworkers, include the aromatic fluctuation index (FLU) [42, 46] and the PDI [40]. The first aromaticity index, the FLU, measures the fluctuation of the DI among neighboring atoms within a ring. Just as with the structural HOMA index, a lack of fluctuation indicates a higher aromaticity as long as the value of the DI is close to that of the prototype aromatic molecule, benzene. The FLU index is, thus, an excellent electronic counterpart to the HOMA as it captures the cyclic delocalization of electrons in a given RIM. The index has been defined as [42]:
where the summation runs over all atoms sharing a bond path (bonded/neighboring atoms) in the ring, m = the number of atoms forming the ring (m = 6 for all the 13 rings considered in the present work), δ(Ω, Ω')ref = 1.4 (the value obtained at the HF/6-31G(d) level for benzene), and V(Ω) is defined as:

and termed the 'global delocalization' (or valency) of Ω (which equals to twice of the sum of the row or column of the off-diagonal elements of the LDM labeled Ω), and α = ±1 to ensure [V(Ω')/V(Ω)]α ≥ 1.
The second electronic aromaticity index we consider here is known as the PDI [40]. This index is the average of the DI between para-atoms in a ring and hence is limited to 6-membered rings (6-MRs), which is not a limitation in the present paper since all the 13 rings we consider are 6-MRs. Thus, this index can be written compactly as:
6.2.Correlations of the Frobenius distances from benzene with established measures of aromaticity
Three of the four studied aromaticity indices (HOMA, PDI, and FLU) are strongly correlated statistically with the Frobenius distance of the other ring structures from benzene (r2 > 0.86, where r is the statistical correlation coefficient for (non)linear least-square fittings). NICS is not as strongly correlated and exhibits more scatter along the trend line in addition to some apparent outliers. The trends of these correlations are essentially linear in the cases of FLU and PDI and nonlinear in the case of HOMA and NICS, all of which are displayed in figure 1 and the values which the figure is based on appear in table 1. Despite falling on the general trend lines and its inclusion in the statistical analysis, the results of which appear at the bottom of table 1, cyclohexane has been excluded from figure 1.
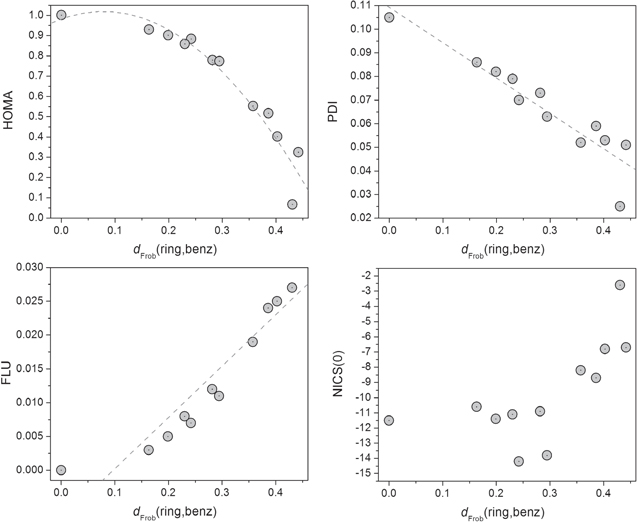
Figure 1. Correlations between the Frobenius distance (dFrob) from benzene to the rings-in-molecules listed in table 1 and depicted in scheme
Download figure:
Standard image High-resolution imageThe strongest correlation of the Fobenius distance is with HOMA (r2-adjusted = 0.97) and is clearly nonlinear. The PDI, that measures the average QTAIM para-DIs within a 6-MR, is the second most strongly (and linearly) correlated to the Frobenius distance with an r2-adjusted of 0.91. The next in strength of correlation is the FLU which measures the fluctuation in the DI within a ring (r2-adjusted = 0.85, linear).
The NICS at the ring center, NICS(0) (simply referred to as NICS in this paper), which has a generally more negative value for the more aromatic ring, is not maximally negative for benzene (that of the inner ring of anthracene being more negative, for example) has a generally increasing trend with distance from benzene but the correlation is not as strong as the other indices as can be seen from figure 1.
Table 1 has been sorted in order of increasing distance (increasing dissimilarity) from benzene. The lower members in this table are thus the least similar (most dissimilar) to benzene. Cyclohexane appears at the very bottom of table 1 as expected and is the least aromatic according to all criteria that are listed in the table. In summary, table 1 and figure 1 show that these different aromaticity measures are generally, but not always, well correlated among themselves and with the Frobenius distance from benzene.
The qualitative ranking of aromaticity by various methods can be gleaned from table 2. This table lists the RIMs starting by the most aromatic at the top then lists the various numbers of disagreements with the other studied methods. Unsurprisingly, HOMA, PDI, and FLU all list benzene—also the reference for the Frobenius distance calculation—as the most aromatic ring in the set. Surprisingly, however, and in disagreement with all other methods, NICS predicts that the inner ring of anthracene is more aromatic than benzene, and so is naphthacene's inner ring as well.
Table 2. Aromatic ranking agreement of various aromaticity indices with the Frobenius distance dissimilarity to benzene.
| dFrob | HOMA | PDI | FLU | NICS(0) |
|---|---|---|---|---|
| Benzene | Benzene | Benzene | Benzene | Anthracene (I) |
| Triphenylene (O) | Triphenylene (O) | Triphenylene (O) | Triphenylene (O) | Naphthacene (I) |
| Phenanthrene (O) | Phenanthrene (O) | Phenanthrene (O) | Phenanthrene (O) | Benzene |
| Chrysene (O) | Anthracene (I) | Chrysene (O) | Anthracene (I) | Phenanthrene (O) |
| Anthracene (I) | Chrysene (O) | Naphthalene | Chrysene (O) | Chrysene (O) |
| Naphthalene | Naphthalene | Anthracene (I) | Naphthacene (I) | Naphthalene |
| Naphthacene (I) | Naphthacene (I) | Naphthacene (I) | Naphthalene | Triphenylene (O) |
| Chrysene (I) | Chrysene (I) | Anthracene (O) | Chrysene (I) | Anthracene (O) |
| Anthracene (O) | Anthracene (O) | Phenanthrene (I) | Anthracene (O) | Chrysene (I) |
| Phenanthrene (I) | Phenanthrene (I) | Chrysene (I) | Phenanthrene (I) | Phenanthrene (I) |
| Triphenylene (I) | Naphthacene (O) | Naphthacene (O) | Triphenylene (I) | Naphthacene (O) |
| Naphthacene (O) | Triphenylene (I) | Triphenylene (I) | Naphthacene (O) | Triphenylene (I) |
| Cyclohexane | Cyclohexane | Cyclohexane | Cyclohexane | Cyclohexane |
 dFrob dFrob |
4 | 7 | 4 | 10 |
 HOMA HOMA |
6 | 3 | 7 | |
 PDI PDI |
9 | 9 | ||
 FLU FLU |
10 |
All four methods rank the inner ring of anthracene as more aromatic than the outer ring, the Frobenius distance criterion appears to place it at a reasonable relative ranking whereby the outer ring is four ranks below the inner ring (5 ranks below according to both HOMA and FLU, 7 ranks below according to NICS, and only 2 ranks below according to PDI). The reverse situation is observed for phenanthrene where all methods rank the outer ring as more aromatic and where the Frobenius rankings appear as a good compromise. The ranking ordering of the dFrob. is closest to the HOMA and furthest from NICS. Only FLU is closer to the ranking of HOMA than the Frobenius distance with three disagreements, but the disagreements between dFrob. are slight and consist of the interchange of two neighbouring-ranking pairs: anthracene (inner) and chrysene (outer), and naphthacene (outer) and triphenylene (inner). Figure 2 is a matrix plot representing the inter-correlations between the five aromaticity indices subject of this study.
6.3.Correlations of aromaticity with the eigenvalues of the RIM–LDM
One of the earliest introductions to empirical 'rules of thumb' that we are exposed to in our chemical education is 'like dissolves like'. This and several similar empirical rules of thumb have been made rigorous in the form of Hansen's Solubility Parameters [79]. The 'like dissolves like' rule is fundamentally based on the concept of chemical similarity. Chemical (or molecular) similarity has its basis in the observation that similar compounds have similar properties. Chemical/molecular similarity is one of the most important concepts in the field of cheminformatics where it plays an important role in predicting the properties of compounds, selecting sets of chemical compounds with predefined sets of properties and screening large structure databases to find 'hits', that is, possible new active drugs.
What we would like to examine here is whether similarities of one matrix invariant, e.g. the eigenvalues of the RIMs' LDMs, parallel established aromaticity measures. These eigenvalues are used in this work as practical molecular descriptors that are numbering-system invariant which are directly extracted from the LDMs. While an LDM and its elements have clear physical meanings as explained in section 2 above, the physical meaning of the LDM's eigenvalues is not immediately obvious and could be the subject of a separate future investigation.
For each of the 'RIMs' there are six carbon atoms represented by a 6 × 6 LDM. Therefore, there will be six eigenvalues for each RIM. The six eigenvalues extracted from the LDMs can be thought of as the rings vector location in six-dimensional space.
The first step taken here to explore the similarities of the RIM is to generate a pair-wise similarity matrix. The eigenvalues of the 6 × 6 LDMs of the rings (where the eigenvalues were sorted from the largest value to the smallest value) are used as inputs to generate the pair-wise similarity matrix. We can envision that the eigenvalues for the RIMs LDMs are points in six-dimensional space and compare their similarities using the vector angles. For example, the eigenvalues for benzene are 5.4788, 4.5691, 4.5691, 3.2707, 3.2707, 2.5791 and the eigenvalues a RIM in naphthalene are 5.3939, 4.5962, 4.4884, 3.2806, 3.2385, 2.6158, which are considered as Cartesian coordinates which define the vectors  and
and  in the six-dimensional space. The equation for computing the vector angle between these two eigenvectors is given as usual by:
The vector angle calculation is performed for each pair of RIMs in the dataset to produce a pair-wise similarity matrix that is based on the vector angles.
Table 3 lists the pair-wise vector angles for the 13 studied RIMs. One way to appreciate the similarity of these ring in molecules would be to map the molecules in n-dimensional abstract mathematical space and use the distance between the rings as a measure of aromaticity when compared to benzene. It is difficult to visualize relationships beyond three-dimensions and, consequently, dimensionality reduction is necessary if we are to visualize similarity distance between sets of rings. This dimensionality reduction is achieved through the so-called multidimensional scaling (MDS) methods [80–86].
Table 3. Pair-wise vector angles distance matrix (angles are in degrees (°)) for the 13 symmetry-unique 'rings-in-molecules (RIMs)' considered in this work to two decimalsa.
| RIM | Ben | A(O) | A(I) | P(O) | P(I) | N | Nc(O) | Nc(I) | Ch(O) | Ch(I) | T(O) | T(I) | Cyc |
|---|---|---|---|---|---|---|---|---|---|---|---|---|---|
| Ben | 0 | 0.94 | 0.94 | 0.44 | 1.14 | 0.64 | 1.12 | 1.07 | 0.51 | 0.95 | 0.33 | 1.76 | 3.93 |
| A(O) | 0.94 | 0 | 0.39 | 0.52 | 0.50 | 0.31 | 0.20 | 0.40 | 0.45 | 0.42 | 0.62 | 1.41 | 3.49 |
| A(I) | 0.94 | 0.39 | 0 | 0.52 | 0.29 | 0.39 | 0.50 | 0.15 | 0.47 | 0.21 | 0.61 | 1.11 | 3.20 |
| P(O) | 0.44 | 0.52 | 0.52 | 0 | 0.74 | 0.20 | 0.71 | 0.65 | 0.07 | 0.55 | 0.11 | 1.48 | 3.64 |
| P(I) | 1.14 | 0.50 | 0.29 | 0.74 | 0 | 0.60 | 0.54 | 0.21 | 0.68 | 0.20 | 0.83 | 0.92 | 3.01 |
| N | 0.64 | 0.31 | 0.39 | 0.20 | 0.60 | 0 | 0.51 | 0.49 | 0.14 | 0.43 | 0.32 | 1.42 | 3.56 |
| Nc(O) | 1.12 | 0.20 | 0.50 | 0.71 | 0.54 | 0.51 | 0 | 0.46 | 0.64 | 0.52 | 0.82 | 1.44 | 3.46 |
| Nc(I) | 1.07 | 0.40 | 0.15 | 0.65 | 0.21 | 0.49 | 0.46 | 0 | 0.59 | 0.23 | 0.75 | 1.07 | 3.12 |
| Ch(O) | 0.51 | 0.45 | 0.47 | 0.07 | 0.68 | 0.14 | 0.64 | 0.59 | 0 | 0.50 | 0.18 | 1.45 | 3.61 |
| Ch(I) | 0.95 | 0.42 | 0.21 | 0.55 | 0.20 | 0.43 | 0.52 | 0.23 | 0.50 | 0 | 0.64 | 1.02 | 3.16 |
| T(O) | 0.33 | 0.62 | 0.61 | 0.11 | 0.83 | 0.32 | 0.82 | 0.75 | 0.18 | 0.64 | 0 | 1.53 | 3.70 |
| T(I) | 1.76 | 1.41 | 1.11 | 1.48 | 0.92 | 1.42 | 1.44 | 1.07 | 1.45 | 1.02 | 1.53 | 0 | 2.23 |
| Cyc | 3.93 | 3.49 | 3.20 | 3.64 | 3.01 | 3.56 | 3.46 | 3.12 | 3.61 | 3.16 | 3.70 | 2.23 | 0 |
aThe symbols for the RIMs are: benzene = Ben, naphthalene = N, anthracene = A, naphthacene = Nc, phenanthrene = P, chrysene = Ch, triphenylene = T, and cyclohexane = Cyc; and (I) and (O) symbolizes the inner- or outer-ring respectively.
MDS algorithms all project the 'distance matrix' computed within the actual n-dimensional space to the two- or three-dimensions required for visualization constrained to minimize the distance matrix by minimizing the 'Kruskal stress (S)' function:
which is designed to range 0 ≤ S ≤ 1 and where f(xij) is the transformation of the raw data (xij) used to minimize S. When the function f(xij) = xij, this is termed 'metric scaling' whereby the raw data is gauged directly without any mathematical transformation to the distances in the map. Alternatively, f can be a weakly monotonic transformation (i.e., the image (transformed) points move in a constant direction if the raw data point moves in a constant direction) chosen to minimize the stress function. The latter is termed 'non-metric scaling'. A stress nearer to zero indicates a better two- or three-dimensional representation of the n-dimensional space.
A 'Shepard diagram' can also be taken as an indicator of the quality of the lower-dimensional representation [84, 85]. This plot represents the agreement between the calculated distances in the full n-dimensional space with the distances calculated from the lower-dimensional optimal projection. The smaller the scatter around the line of best fit the better the low-dimensional representation.

Figure 2. A matrix plot showing the correlation between the different aromaticity criteria considered in this study (HOMA, PDI, FLU, and NICS(0)) along with the Frobenius distance from benzene (dFrob). The group (HOMA, PDI, FLU, dFrob) shows clearly strong inter-correlations.
Download figure:
Standard image High-resolution imageFigure 3 displays a linear Shepard diagram with almost no visible scatter, a plot obtained using the data listed in table 3 after MDS projection achieved with the software XLSTAT™ [87]. From the figure it is also clear that the Kruskal stress is low. These observations validate the dimensional reduction of the projection from six-dimensions to two-dimensions that is achieved by means of the MDS.
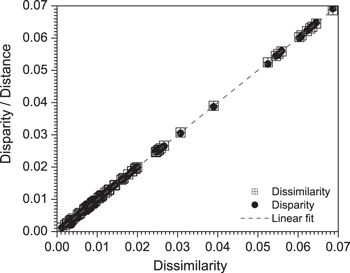
Figure 3. Shepard plot of the transformed six-dimensional data. (Kruskal stress (S) = 0.014). The closeness of the dissimilarity/disparity to the linear fit means that the distances in the two-dimensional space represent well the corresponding distances in the six-dimensional space.
Download figure:
Standard image High-resolution imageThe mapping of the vector angle dissimilarities of the RIMs to a two-dimensional space is displayed in figure 4. As a reminder there were no explicit aromaticity information used in producing figure 4. However, there are a number of interesting observations to be drawn from this plot regarding aromaticity.

Figure 4. Two-dimensional MDS projection of the dissimilarity matrix in table 3 (Kruskal stress (S) = 0.014). Closer distances between a pair of points means the rings they represent are closer in the six-dimensional space which is projected onto this two-dimensional plot. A closer distance means that the two rings are more similar to one another, and the working assumption is that the closer a ring is to benzene the more this ring is aromatic (benzene, the reference, is assigned the highest aromaticity). The symbols for the RIMs are: benzene = Ben, naphthalene = N, anthracene = A, naphthacene = Nc, phenanthrene = P, chrysene = Ch, triphenylene = T, and cyclohexane = Cyc; and (I) and (O) symbolizes the inner- or outer-ring respectively. (a) The dataset including the extreme value of cyclohexane at the far upper left, (b) excluding cyclohexane to zoom on the 12 aromatic RIMs better showing their spread.
Download figure:
Standard image High-resolution imageFirst, benzene (Ben) which has the highest (HOMA) aromaticity is located in the lower right corner of the graph and triphenylene inner ring T(I) which has the lowest (HOMA) aromaticity is in the upper left corner of the graph. The plot suggests that if we proceed up and to the left in the plot then we should see lower aromaticities. There is also a clear separation of benzene, naphthalene and the outer rings from the inner rings.
Using the positions of the RIMs shown in figure 4(b) (i.e., assuming that proceeding up and to the left in the plot is representative of lower aromaticities) we get the ranking Ben > T(O) > P(O) > Ch(O) > N > A(O) > Nc(O) which is the same order as given by the HOMA aromaticity. Furthermore considering only the positions of the inner rings in figure 4(b) and again assuming that proceeding up and to the left in the plot is representative of lower aromaticities we get the aromaticity ranking of A(I) > Nc(I) > Ch(I) > P(I) > T(I) which is the same ranking as is given by the HOMA aromaticity.
Interpreting the x- and y-positions of the compounds in the diagrams of figure 4 as representative of their aromaticities we find that the plot is in accordance with our chemical intuition: generally, the outer RIMs are more similar to benzene than the inner RIMs and cyclohexane is by far the most dissimilar to benzene, as expected on the basis of aromaticity. In terms of similarity/dissimilarity one may expect a correlation between the x- and y-coordinates of the RIMs in figure 4 with the various aromaticity measures. To that end we computed the Euclidean (x, y) distances of the RIMs from benzene in this figure and regressed them against the aromaticity measures.
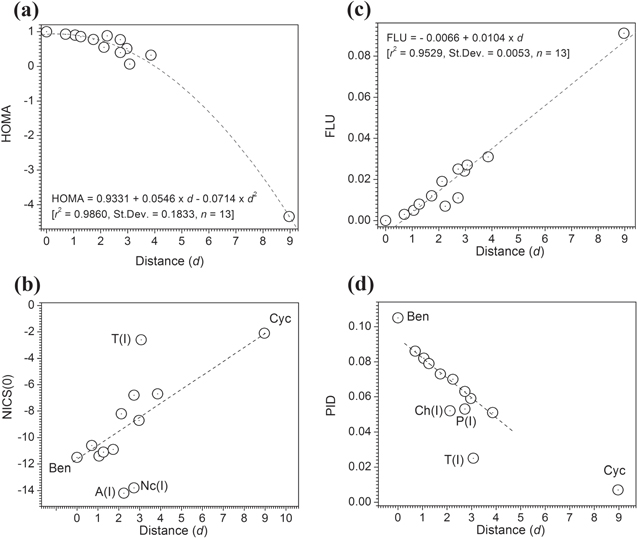
Figure 5 shows the relationship between the Euclidean distances from benzene regressed against the aromaticity measures with strong correlations to HOMA, FLU, and PDI (with two clear outliers in the correlation with PDI which are the outer rings of triphenylene and chrysene). From these results we also see that there is a reasonable correlation between the vector angles Euclidean distance from benzene with even NICS(0) but with three clear outliers which are the outer rings of triphenylene, anthracene, and naphthacene).
Figure 5. Distances obtained from the eigenvalues vectors versus the four aromaticity criteria. Regression results are given only for well-behaved full datasets (a), (c) while outliers are indicated otherwise (b), (d). The symbols for the RIMs are: benzene = Ben, naphthalene = N, anthracene = A, naphthacene = Nc, phenanthrene = P, chrysene = Ch, triphenylene = T, and cyclohexane = Cyc; and (I) and (O) symbolizes the inner- or outer-ring respectively.
Download figure:
Standard image High-resolution image
7. Conclusions
The aromaticity of a RIM is a property associated with cyclical electron delocalization around closed rings of atoms and which is generally recognized with ease by practising chemists yet, to this date, it remains a working concept lacking a unique or unambiguous definition. There is no shortage of aromaticity indices, each designed to capture one particular aspect of this phenomenon, be it energetic, electronic, magnetic, structural, or reactive. These different indices not infrequently disagree in ranking rings as more or less aromatic. The discrepancies in the ranking of local aromaticities of RIMs by various indices is not surprising since each of these indices captures essentially only one aspect of this multi-facetted phenomenon.
It is conceivable that an LDM representation of a RIM codes simultaneously for more than one facet of its aromaticity since the matrix contains information derived from the one-electron density and the pair density, both in integrated form. The sum of any column or row of an LDM yields the electron populations of a given atom in the molecule (and hence also determines its charge), the sum of all the elements of the LDM equals the total number of electrons in the molecule, the sum of the diagonal elements yield the molecular localized electron sub-populations and the delocalized sub-population is the sum of the off-diagonal elements, and finally the full LDM represents the full fuzzy molecular graph (or subgraph, say of a RIM). It is also important to remember that the QTAIM partitioning itself of the molecular space is based on the topography and topology of the electron density which determine Bader's condition of local zero-flux in the gradient vector field of the electron density. Thus, an LDM is expected to constitute a powerful molecular (or molecular fragment) fingerprinting descriptor at 'chemical resolution', that is, at the resolution of atoms in molecules. In this work, we expand this fingerprinting to a coarser resolution, that of the RIMs, and show that aromaticity can be meaningfully measured by labeling-independent matrix invariants extracted from the RIMs' LDMs.
The problem of quantifying aromatic character is approached here using the LDMs of the rings in the molecules. In one approach, the similarity of a 6-membered carbon ring in a condensed aromatic system to benzene is taken, itself, as a measure of aromaticity. In a second approach, the eigenvalues of the LDM of a RIM are taken as predictors of the local aromatic character of that ring. LDM-based modeling of aromaticity is shown to be physically meaningful and provide a ranking that represents a consensus between that predicted by well-established (but sometimes inconsistent) indices of aromaticity. By capturing several aspects of the electron density and of the pair density at an atomic resolution, LDMs contain enough information to faithfully reproduce trends in molecular properties as the local aromaticity of RIMs suggests (at least within the studied set of rings).
The eigenvalues of the LDM matrices provide further compaction of the original information contained within the LDMs and, as such, they can be used as descriptors for properties of the molecules or groups within molecules such as RIMs. In this work, we projected the six-dimensional eigenvalue descriptors to two-dimensions and used the vector angles as a measure of the (dis)similarities of the RIMs. The resulting plot (figure 4) showed that there exists a clear separation between the aromaticities of the inner and outer rings with naphthalene and benzene being grouped with the outer rings. The positions of the RIMs in the two-dimensional projection of the six-dimensional eigenvalues agree with the rankings of aromaticity by the HOMA method. Furthermore, regression of the (x, y) positions of the RIMs against several aromaticity indices showed high correlations (with few outliers that are all outer rings). Thus two-dimensional similarity mapping of the eigenvalues of the RIMs appears as a potentially effective tool for mining information about the aromaticity of multi-ring systems.
Acknowledgments
This paper is based on a chapter from the MSc thesis of IS (in progress) to be submitted to Saint Mary's University. The authors would like to acknowledge Dr Todd Keith (SemiChem, Inc.), Professor Lou Massa (City University of New York (CUNY)), and Dr Miroslav Kohout (Max Planck Institute for Chemical Physics of Solids) for helpful discussions and thank the two anonymous reviewers for their helpful suggestions. Financial support of this work was provided by the Natural Sciences and Engineering Research Council of Canada (NSERC), Canada Foundation for Innovation (CFI), Saint Mary's University, McMaster University, and Mount Saint Vincent University.
Footnotes
- *
This paper is dedicated to the memory of Professor Paul von Ragué Schleyer (1930–2014).