


Abstract
We report the latest results on fast measurements of the electron temperature and parallel heat flux in the COMPASS tokamak scrape-off layer (SOL) and divertor region during ELMy H-mode plasmas. The system of ball-pen and Langmuir probes installed on the divertor target, the horizontal reciprocating manipulator and the fast data-acquisition system with sampling frequency rate f = 5 MSa s−1 allow us to measure the electron temperature and parallel heat flux during inter-ELM and ELM periods with high temporal resolution. The filamentary structure of the electron temperature and parallel heat flux was observed during ELMs in the SOL as well as in the divertor region. The position of the filaments within ELMs is not regular and therefore the resulting conditionally averaged ELM neglects the peak values of the electron temperature and parallel heat flux. We have found a substantial difference between the value of the radial power decay length in the inter-ELM period λq,inter = 2.5 mm and the decay length of the peak ELM heat flux λq,ELM = 13.1 mm. The decay length of the ELM energy density was found to be λE,ELM = 5.4 mm.
Export citation and abstract BibTeX RIS
1. Introduction
Investigation of the electron temperature and consequent parallel heat flux to the divertor target or to the first wall during edge localized modes (ELMs) is of importance for the ITER tokamak in order to determine the physical sputtering and melting of the plasma-facing components [1, 2] and, consequently, their lifetime. The parallel heat flux q// can be determined by Langmuir probes using the formula  = γ · Te · Isat_i/S, where Te and Isat are measured values of the electron temperature and ion saturation current, respectively. The coefficient γ represents the value of the heat power transmission coefficient [3] and S is the effective probe surface. Measurements of the ion saturation current during ELMy H-modes can be provided with a high temporal resolution using a Langmuir probe with surface SLP, biased sufficiently negative with respect to its floating potential and expected electron temperature. On the other hand, fast measurements of the electron temperature during ELMy H-modes with microsecond temporal resolution are more difficult to achieve. The electron temperature in a divertor region of present-day devices is typically measured by swept Langmuir probes, which can also be used to investigate ELMs via fitted conditionally averaged (CA) I–V characteristics [4, 5] or a triple-probe (TP) technique. The TP technique applied on Langmuir probes installed in the JET divertor provides the electron temperature, density and heat flux with a time resolution of 100 µs [6]. The measurement of the electron temperature using the TP technique is limited only by the distance between each probe and the applied voltage Vbias, which should be much higher than the measured electron temperature Te [7].
An alternative option to determine the electron temperature with a high temporal resolution is to use direct measurements of the plasma (Φ) and floating (Vfl) potentials. The electron temperature Te is consequently determined from the difference of both potentials normalized by the proper coefficient for a specific gas and magnetic field [8–11]. The floating potential is routinely measured by a Langmuir probe (LP) and the plasma potential can be directly measured by a ball-pen probe (BPP). The BPP mounted on the midplane reciprocating manipulator has been used to measure the plasma potential in the edge plasma of different fusion devices such as COMPASS [9, 12], ASDEX Upgrade [8, 9, 13, 14], MAST [15] and ISTTOK [11]. Recently, a new array of BPPs and dome-shaped LPs was installed in a divertor target of the COMPASS tokamak in order to investigate the plasma potential, electron temperature and parallel heat flux in the divertor region.
This paper reports the latest measurements of the parallel heat flux on the divertor target and at the low-field side (LFS) midplane during ELMy H-modes on the COMPASS tokamak. First, we describe the diagnostic set-up in section 2 and discuss the validity of the plasma potential measurement at the divertor in section 3. Section 4 presents the first sub-microsecond measurement of the parallel heat flux during Type-I ELMs at the divertor and the same type of measurement is repeated in section 5 for the LFS midplane. Section 5 further compares the power decay length during ELMs with that observed in the inter-ELM periods.
2. BPP and LP construction and experimental set-up
The new array of BPPs (labelled A–L) has been implemented directly onto the graphite divertor tile on the COMPASS tokamak as shown in figure 1. Each BPP is made of a stainless-steel collector with 3 mm diameter and a boron-nitride shielding tube with 6 mm diameter. The collector is retracted at h ~ 0.7 mm below the graphite surface. Two additional dome-shaped LPs (Q, N) are also mounted on the same divertor target. The LPs are made of graphite with 4 mm diameter and protruding 1.3 mm into the plasma. Toroidal distance between neighbouring LPs is roughly 6 cm and is approximately the same between the BPP_H and LP_Q. In the current configuration, a set of probes BPP_H, LP_Q, LP_N is located at the same poloidal position. The LPs can operate in floating or ion saturation current modes (Vbias = −270 V). The total exposed area of LP is approximately SLP = 30 mm2. All signals are acquired with a sampling frequency rate f = 5 MSa s−1. It must be noted that in some cases, if the floating potential of a LP is very negative within the duration of an ELM, then the applied biased voltage Vbias is not low enough to measure pure ion current and the biased LP probe also collects electrons, which underestimates the value of the ion saturation current. However, it has rarely happened in our discharges. The BPPs are implemented to the divertor target as flush-mounted probes, which significantly reduce a direct impact of high heat flux on the probe material. The red lines show roughly a position of the strike points at HFS and LFS during the ELMy H-mode discharge #7891 at t = 1100 ms.

Figure 1. Picture of the ball-pen probe (BPP) array and dome-shaped Langmuir probes (LPs) mounted on the divertor target in COMPASS. The toroidal distance between BPP_H and LP_Q and neighbouring LPs is roughly 6 cm. The red lines show the approximate position of the strike points at HFS and LFS in shot #7891 at t = 1100 ms.
Download figure:
Standard image High-resolution imageAt the midplane, the fast reciprocating probe shaft is used to insert a probe head containing BPPs and LPs, as seen in figure 2. On the COMPASS tokamak, measurements of the plasma and floating potential were performed by means of the central BPP2 with a retraction depth of h = −0.5 mm and Langmuir probe LP1. The ion saturation current Isat_i is provided by LP2 (Vbias = −270 V). The diameter of the probe head is about 3 cm on the top. The BPPs have stainless steel collectors with a diameter of 2 mm and alumina shieldings with an inner diameter of 5 mm. The LPs are made of graphite pins with a diameter of 0.9 mm protruding 1.5 mm into the plasma (the same construction is used on ASDEX Upgrade). The poloidal distances between the LPs and BPPs are 4 mm. All signals are acquired with a sampling frequency rate f = 5 MSa s−1.
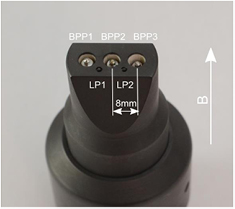
Figure 2. Picture of the BPP head used on the COMPASS midplane manipulator. It consists of three BPPs with stainless steel collectors and alumina shielding tubes and two graphite LPs.
Download figure:
Standard image High-resolution image3. Characteristics of divertor BPP
Current–voltage characteristics of BPPs mounted on probe manipulators have been systematically studied in the SOL on COMPASS [9] and ASDEX Upgrade [8]. The idea of using the BPP to directly measure the plasma potential is based on the simple LP theory for Maxwellian plasma. It predicts that, if the ratio  = Isat_e /Isat_i of the electron and ion saturation current is equal to one, the floating probe potential is equal to the plasma potential Φ. Thus, the floating BPP potential ΦBPP is close to the plasma potential Φ. The ratio
  is rendered approximately one due to the screening of a large portion of electrons from reaching the collector by its ceramic shielding [10]; and also the I–V characteristics of the BPP become nearly symmetric.
The BPPs at the divertor are surrounded by large graphite (conducting) tiles, which is a new probe arrangement in contrast to the BPP mounted on the probe manipulator [9] on COMPASS as seen in figure 2. Therefore, in order to verify the symmetricity of I–V characteristics of divertor BPPs, we have applied swept voltage (±200 V, f = 1 kHz) on four BPPs (BPP_D, BPP_E, BPP_F, BPP_J) with significantly different poloidal locations as seen in figure 1. For each probe, an example of an averaged I–V characteristic obtained during the L-mode discharge #4290 (BT = 1.15 T, plasma current IP = 160 kA, density ne = 9 · 1019 m−3) for time interval 1080 ms < t < 1230 ms is plotted in figure 3 from which it is clear that all probes provide nearly symmetric I–V characteristics. However, it also shows that the current in the electron and ion branches of the I–V does not saturate. Instead, it shows a linear trend with respect to applied swept voltage. The linear trend of non-saturated I–V characteristics of BPP is consistent with measurements at midplane on COMPASS [9] and ASDEX Upgrade [8]. The estimation of the ratio of the electron and ion saturation current  = Isat_e/Isat_i requires a linear extrapolation of both branches to Vfl. The linear fit in figure 3 is calculated for BPP voltage > +75 V in the electron branch and for BPP voltage < −75 V in the ion branch. If we assume the floating potential of BPP is close to the plasma potential Φ, then the logarithm of the ratio
  is found within the range of ln(
 ) ~ 0.3–0.4. The resulting value ln(
 ) is close to the value obtained with BPPs mounted on the midplane manipulator [9]. This means that the surrounding graphite material of the divertor target doesn't affect the characteristics of flush-mounted BPPs.

Figure 3. Average I–V characteristics of BPP_D (blue), BPP_E (red), BPP_F (magenta) and BPP_J (black) during the L-mode discharge #4290.
Download figure:
Standard image High-resolution imageDetermination of the ratio  during ELMs is difficult because of the very short time scale of ELM filaments compared with the sweeping period. However, raw estimation of the ratio between the electron and ion saturation current during an ELM is shown in figure 4. Two similar ELM events, ELM_1 and ELM_2, with the same D-alpha footprint, were detected on swept BPP_J and BPP_D during the ELMy H-mode phase of the discharge #4259 (ne = 9 · 1019 m−3) at moments with opposite values of applied voltage. This confirms that both values Isat_e and Isat_i are also roughly balanced within the ELM, with the ratio 1 <
  < 2 independent of the probe position. Note, the investigation of the ratio
  of the BPP during ELMy H-mode can also be found in systematic measurements on ASDEX Upgrade [8]. The investigation of the electron temperature Te with a microsecond temporal resolution is based on fast measurements of BPP and LP potentials, ΦBPP and Vfl, and on the formula Te = (ΦBPP − Vfl)/2.2 [9]. The coefficient 2.2 is obtained from the ln(
 ) = 2.8 of LPs in deuterium plasmas (assuming Ti = Te and no secondary electron emission) minus the ln(
 ) of BPP. The value of ln(
 ) of BPP on COMPASS (shown in figures 3 and 4) is in agreement with the value ln(
 ) achieved on ASDEX Upgrade [8]. Therefore, we shall use the same value of ln(
 ) = 0.6 for BPPs on both COMPASS and ASDEX Upgrade. Note, the same formula was already used for comparative measurements of the electron temperature using BPP/LP mounted on the reciprocating manipulator and Thomson scattering on COMPASS [9], ASDEX Upgrade [9] and MAST [15] in L-mode plasmas with a very good agreement between both techniques.

Figure 4. I–V characteristics of BPP_D and BPP_J during ELMy H-mode phase #4259 with two similar ELM events incoming to both probes.
Download figure:
Standard image High-resolution image4. Fast measurements of ELMs in the divertor region
The combination of BPP_H (ΦBPP) and LP_Q (Vfl) in a floating regime and LP_N (biased with Vbias = −270 V) allows us to provide simultaneous measurements of the electron temperature Te from ΦBPP and Vfl and ion saturation current Isat_i on the LFS roughly at the R − Rstrike point ~ 6 cm, as seen in figure 1. An example of the temporal evolution of the electron temperature and ion saturation current during a type-I ELM in discharge #7891 is plotted in figure 5.
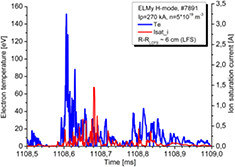
Figure 5. Temporal evolution of the electron temperature and ion saturation current during a single ELM event in H-mode #7891 (Ip = 270 kA, n = 5 · 1019 m−3) in the COMPASS divertor region.
Download figure:
Standard image High-resolution imageIt is seen that the value of the electron temperature is strongly varying within an ELM structure and the temperature peaks do not seem to be correlated with the peaks in ion saturation current. It must be noted that a small part of the resulting Te, roughly 9% of the total signal during the H-mode phase, has values below zero. This is probably caused by a toroidal displacement of BPP_H and LP_Q, which is roughly 6 cm. It was found that both LPs (LP_Q and LP_N, toroidal distance ~6 cm) are well magnetically connected, with the maximum of the cross-correlation function in floating regime ~0.9. This was verified for all plasma regimes. A similar value of cross-correlation is expected for neighbouring BPP_H and LP_Q having the same toroidal displacement. However, the maximum in the cross-correlation function is still less than 1. Therefore, in some cases, we can detect different events by both probes. Nevertheless, the most part of Te values can be used in order to estimate the value of the parallel heat flux q// = γ · Te · Isat_i/SLP, where we have used SLP = 30 mm2 as a total exposed surface of LP_N and γ = 7, which can be obtained using [3] for Te = Ti. A similar value of γ was also found experimentally on DIII-D tokamak [16] using divertor LPs and an IR camera during H-mode. The time evolution of q// during one ELM is plotted in figure 6. It is seen that the value of the parallel heat flux during ELMs reaches several MW m−2. These values are obtained roughly 6 cm outside the LFS strike point. The red line represents smoothed values of the parallel heat flux over 0.1 ms (10 kHz), which is comparable to the resolution of common IR cameras. In such cases, the resulting values of q// are below 1 MW m−2 and strongly underestimate the peak heat flux.
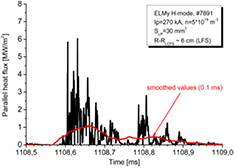
Figure 6. Temporal evolution of the parallel heat flux obtained from Te and Isat_i measurements and heat transmission coefficient γ = 7 during the same ELM event, as in figure 5 in shot #7891.
Download figure:
Standard image High-resolution imageFigure 6 shows that an ELM is composed of several high heat flux filaments separated by periods of a low heat flux. It has been found that the position of the filaments within one ELM is, however, not regular, as is also seen in the measurements at midplane plotted in figure 8. This can be demonstrated by computing a CA ELM waveform. For each ELM, the heat flux signal is extracted from the time window 0.1 < t–tfront (ms) < 0.4 and all such signals are averaged together. Here tfront is the time of the initial steep increase of the heat flux representing the time when the first filament of ELM hits the probe position. The value tfront is determined at the time when the heat flux exceeds a predefined threshold q//thr for the first time. There, q//thr is set larger than the maximum of the heat flux in the inter-ELM phase.
The resulting CA ELM waveform on the divertor is plotted by a red line in figure 7. The blue region represents ±1 σ of standard deviation. The filamentary structure of CA Te and CA q// ELM has disappeared after the conditional averaging due to an irregular filamentary structure of each ELM. It is also clearly seen that the maximum value of the q// in CA ELM in figure 7 is significantly lower than the peak heat flux of individual filaments. This demonstrates that techniques that use an ensemble averaging for a description of the heat flux within unsorted ELMs, such as the conditional averaging of an I–V characteristic [4, 5], will also tend to underestimation of the maximum heat flux.
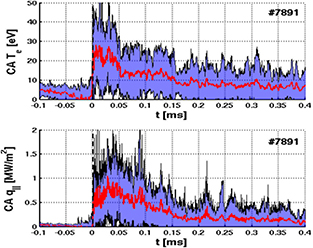
Figure 7. Conditionally averaged electron temperature (CA Te) and parallel heat flux (CA q//) in type-I ELM (red line) is calculated from 30 ELM events during the ohmic H-mode #7891(Ip = 270 kA, n = 5 · 1019 m−3) at LFS roughly at R − Rstrike point ~ 6 cm. The blue region represents ±1 σ of standard deviation.
Download figure:
Standard image High-resolution image5. ELM filamentary structure and decay length in the SOL at midplane
The fast reciprocating probe shaft on the COMPASS midplane manipulator [13, 17] is used to measure the electron temperature [3], ion saturation current and parallel heat flux in L-mode as well as in ELMy H-mode discharges. The data are measured with a microsecond temporal resolution, which allows us to resolve the filamentary structure of ELMs. The electron temperature is provided by a combination of BPP2 and LP1 values as seen in figure 2 using the same formula Te = (ΦBPP − Vfl)/2.2 as in the case of the divertor measurements. The ion saturation current is provided by LP2 with the total exposed area of approximately SLP = 5 mm2; the parallel heat flux is calculated with the same value of the heat power transmission coefficient γ = 7 as in the divertor measurements. Temporal evolution of the electron temperature, ion saturation current and parallel heat flux of two similar ELM events measured by probes at two different positions at midplane are plotted as an example in figure 8. Both measurements near the LCFS and in the main SOL clearly show several filaments, in which the electron temperature and ion saturation current are in phase. Consequently, these filaments will dominate the resulting parallel heat flux. Although the values of the peak heat flux decrease with distance from the LCFS, they will always significantly exceed the smoothed or CA value of Te or q// within the ELM. Systematic measurements of the electron temperature and parallel heat flux in the ELMy H-mode discharge #11285 at the first wall are shown in figure 9.
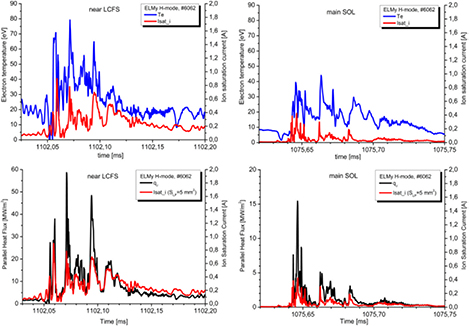
Figure 8. Temporal evolution of the electron temperature, ion saturation current and parallel heat flux during two different ELM events at midplane near the LCFS (R − RLCFS ~ 10 mm) (left) and in the main SOL (R − RLCFS ~ 30 mm) (right) in shot #6062 (Ip = 270 kA, n = 5 · 1019 m−3).
Download figure:
Standard image High-resolution image
Figure 9. Conditionally averaged electron temperature (CA Te) and parallel heat flux (CA q//) of type-I ELM (red line) is calculated from 51 similar ELM events during the flat-top in shot #11285 (Ip = 300 kA, n = 6 · 1019 m−3). The blue region represents ±1 σ of standard deviation. The probe head was fixed 10 mm in front of the LFS limiter (R − RLCFS ~ 25 mm).
Download figure:
Standard image High-resolution imageBecause it is not possible to accumulate enough statistics to calculate CA ELM with a movable probe, the position of the probe head on the midplane manipulator was fixed at 10 mm in front of the LFS limiter (R − RLCFS ~ 25 mm) during the whole discharge. During the ELMy H-mode phase we measured 51 ELMs events with a similar H-alpha footprint yielding the resulting CA ELM evolution. The same method of CA was used for the divertor measurements in the previous chapter. The final CA ELM is plotted in figure 9 as a red line. The blue region represents ±1 σ of the standard deviation. The filamentary structure of Te and q// inside the ELM has again disappeared after the conditional averaging due to the different structure of each ELM. It is also clearly seen that the maximum value of q// in the CA ELM in figure 9 is significantly lower than the peak heat flux of individual filaments.
BPPs and LPs mounted on the reciprocating manipulator allow us to perform fast measurements of q// at different radial positions during a single ELMy H-mode discharge. By separating subsets of data that belong to ELMs and inter-ELM periods, respectively, we can evaluate the power decay length λq of the inter-ELM plasma and compare it with the decay length of the peak ELM heat-flux.
The resulting profiles of q// obtained during the ohmic ELMy H-mode discharge #11297 with Ip = 230 kA and n = 7 · 1019 m−3 are plotted in figure 10 with respect to the position of LCFS. The LFS limiter is located roughly 40 mm away from LCFS. The blue dots represent measured values of the parallel heat flux during inter-ELM periods. Fitting of the values by an exponential function q//(R − RLCFS) = q//,0 exp(−(R − RLCFS)/λq) shown as a red line gives an averaged value of the inter-ELM power decay length of λq,inter = 2.5 mm. This fit also agrees well with the mean heat flux evaluated separately for each inter-ELM period (yellow circles). The fluctuating part of the inter-ELM heat flux is approximately bounded by the lower and upper value of the power decay length at 1.5 mm and 4.7 mm. The value of the averaged profile λq,inter is the best candidate to be compared with slower measurements by means of the IR camera, which were systematically carried out for several major tokamaks in [18]. The Eich scaling [18] predicts for our discharge #11297 the value of the inter-ELM power decay length λq,Eich(#9) = 1.8 mm or, including the spherical tokamaks, λq,Eich(#14) = 3.3 mm. The experimental value λq,inter = 2.5 mm found for COMPASS is within the range of these two predicted values. We can determine the power decay length of ELMs as well. The maxima of q// of each ELM with respect to the probe position are plotted in figure 10 by magenta circles. It again shows an exponential decay, however the value of the power decay length λq,ELM = 13.1 mm is roughly five times higher than that determined from the inter-ELM measurement. This indicates that the peak heat flux carried by ELMs on the midplane is significantly less reduced across field lines than the inter-ELM heat flux and may have a strong impact on the first wall. A discrepancy of the profile of parallel heat flux during ELMs and inter-ELM periods is also observed in the divertor region on JET using IR camera during type-I ELMs as seen in figure 15 in [19]. These results show that the integral width λq of time-integrated radial profiles of the ELM and inter-ELM heat loads differs by a factor of ~3.2.
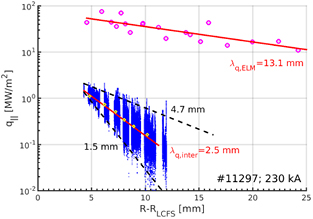
Figure 10. Radial profile of parallel heat flux during inter-ELM period (blue dots) and peak heat flux of type-I. ELMs (violet/pink circles) during the ohmic H-mode discharge #11297 (Ip = 230 kA, n = 7 · 1019 m−3). Yellow circles show an averaged heat flux in each individual inter-ELM period.
Download figure:
Standard image High-resolution imageIn general, the difference between profiles of q// of ELMs and inter-ELM periods might be caused by the different radial velocity of the ELM [20–22] and inter-ELM structures. It is discussed in [22] that high radial velocities (up to 6 km s−1) are observed during the type-I ELMs on midplane on JET. It implies that filaments have no time to transport significant energy along the magnetic field lines and therefore the reasonable fraction of the pedestal density and temperature reaches the wall. On the other side, we assume that the radial velocity of the inter-ELM filamentary structure is strongly suppressed by velocity shear in the transport barrier.
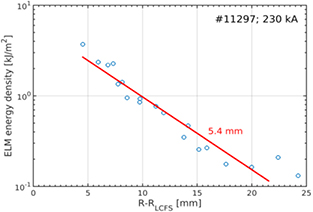
The peak heat flux can strongly influence the local heating of the top layer of the material of the first wall or divertor target. The heating of the material by ELMs is proportional to the incoming heat flux and the time of exposure. Therefore, in figure 11 we have also plotted the radial profile of the ELM energy density, computed as an integral of q// over the duration of each ELM. The decay length of the ELM energy density was found to be λE,ELM = 5.4 mm, which is less than the decay length of the peak heat flux λq,ELM = 13.1 mm plotted in figure 10.
Figure 11. The radial profile of energy density of each ELM in shot #11297 (Ip = 230 kA, n = 7 · 1019 m−3).
Download figure:
Standard image High-resolution image
The difference between the decay length of peak heat flux and ELM energy density could be explained by the acceleration of ELMs towards the wall as was observed on the MAST tokamak [23]. However, the ELM acceleration has not been observed on ASDEX Upgrade [24]. Therefore, a dedicated study concerning ELM propagation should be performed on COMPASS in order to determine if the difference between the two decay lengths is related to the ELM acceleration.
6. Summary
Fast measurements of the electron temperature and parallel heat flux were performed in the SOL and divertor region of the COMPASS tokamak using the ball-pen and Langmuir probe techniques with a sub-microsecond temporal resolution. The divertor target was recently equipped with an array of ball-pen and Langmuir probes in order to measure the parallel heat flux in the LFS. The measurements in SOL were performed using a standard probe head equipped with ball-pen and Langmuir probes operating on a midplane reciprocating manipulator. The systematic measurements in ELMy H-modes show a clear filamentary structure of electron temperature, density and resulting parallel heat flux during ELMs in SOL as well as in the divertor region. However, the number and positions of filaments within ELMs are not regular and therefore the resulting CA ELM neglects the peak heat flux, as was shown for the case of the divertor region and the vicinity of the first wall in SOL. Values of the peak heat flux in ELMs are always significantly higher than CA ELM values and can be obtained only with diagnostics with a microsecond temporal resolution. The power decay length was measured during both the inter-ELM and ELM periods in shot #11297. It was found that the power decay length of the inter-ELM averaged profile of the parallel heat flux is λq,inter = 2.5 mm. The value is just in the range predicted by the Eich scaling, λq,Eich(#9) = 1.8 mm or λq,Eich(#14) = 3.3 mm. However, the radial profile of the peak heat flux of ELMs provides the power decay length λq,ELM = 13.1 mm, which is roughly five times higher than its inter-ELM value. This means that the peak heat flux within ELMs is less reduced across the field lines than the inter-ELM heat flux. According to the observation on JET [19] we expect to find a broadened λq,ELM for the divertor target on COMPASS as well. The broadening effect on λq,ELM could be caused by the high radial velocities of ELM filaments. The latter has a positive consequence for large fusion devices in which ELM divertor heat flux density is significantly reduced.
The peak heat flux can strongly influence the local heating of the top layer of the material of the first wall or divertor target. However, the heating of the material by ELMs is proportional to the incoming heat flux and the time of exposure. Therefore, we have also calculated the ELM energy density. The decay length of the ELM energy density was found to be λE,ELM = 5.4 mm, which is less than the decay length of the peak heat flux λq,ELM = 13.1 mm.
This means that the ELM energy density, which will heat the material of the first wall, is less 'dangerous' than the local (in time) impact of the peak heat flux of ELMs.
Acknowledgments
This work was supported by the project of the Czech Science Foundation GA15-10723S and MSMT Project # LM2015045 and MEYS project number 8D15001. It has been carried out within the framework of the EUROfusion Consortium and has received funding from the Euratom research and training programme 2014–2018 under grant agreement no. 633053. The views and opinions expressed herein do not necessarily reflect those of the European Commission.