


Abstract
Because of lithium's possible use as a first wall material in a fusion reactor, a fundamental understanding of the interactions between liquid lithium (Li) and deuterium (D) is important. We predict structural and dynamical properties of liquid Li samples with high concentrations of D, as derived from first-principles molecular dynamics simulations. Liquid Li samples with four concentrations of inserted D atoms (LiD ,
,  , 0.50, 0.75, and 1.00) are studied at temperatures ranging from 470 to 1143 K. Densities, diffusivities, pair distribution functions, bond angle distribution functions, geometries, and charge transfer between Li and D atoms are calculated and analyzed. The analysis suggests liquid–solid phase transitions can occur at some concentrations and temperatures, forming rock-salt LiD within liquid Li. We also observe formation of some D2 molecules at high D concentrations.
Export citation and abstract BibTeX RIS
1. Introduction
Plasma-facing components (PFCs) in fusion reactors need to protect the underlying substrate from intense bombardment of high energy particles, including deuterium (D) or tritium (T) ions. Solid materials used as PFCs unavoidably suffer from mechanical failure [1] such as erosion. Alternative candidates are liquid metal films [2], such as liquid lithium (Li) or liquid Li–Sn (tin) [3], because they do not experience irreversible degradation. In particular, liquid Li has shown promising initial results [4, 5]. Unfortunately, the Li sputtering yield measured in low-flux experiments [6, 7] and the vapor pressure of liquid Li suggest that the operating temperature for liquid Li serving as PFCs would be too low [8] to be effective under expected reactor conditions. However, recent experiments [9] found that the observed Li sputtering yield is much smaller than predicted, leading to speculation that lithium deuteride (LiD) may have formed and suppressed the sputtering yield. In fact, formation of LiD precipitates in liquid Li was found in other experiments [10, 11] but little is known about the structural and dynamical properties of this composite material. A variety of questions arise: (i) How do the inserted hydrogen (H) isotopes affect the local structure of liquid Li? (ii) Under what conditions will molecules of H isotopes exist in liquid Li? (iii) How facile is diffusion of H isotopes and Li in such mixtures? and (iv) Most importantly, how do these properties change with temperature and composition? As far as we know, the answers to these questions are still unclear. For example, measurements of H diffusivity in liquid Li are still controversial [12, 13]. Hence, to help design fusion reactors with better performance, a fundamental understanding of the interactions between liquid Li and D (or T) is needed. Here we use first-principles molecular dynamics (MD) methods to determine the atomic-scale structure and phases of liquid Li as a function of temperature and D concentration.
Recent atomic-scale simulations have been helpful in understanding the basic properties of liquid Li at temperatures that are suitable for serving as PFCs [14, 15]. Specifically, properties of liquid Li were computed by both orbital-free density functional theory (OFDFT) [14] and classical-potential [15] MD simulations. Both simulation methods can treat many thousands of atoms and are well suited to study liquids. Properties of liquid Li such as the melting point [14–16], diffusion coefficients, and viscosities can be accurately obtained [16]. However, limitations in classical potentials and in the kinetic energy density functionals (KEDFs) required in OFDFT have thus far prevented the use of these techniques for studying D in liquid Li. The simultaneous presence of highly localized and delocalized electron densities presents challenges for OFDFT-MD simulations. Liquid Li has delocalized electron densities that can be treated accurately with OFDFT [14], while the D atoms introduce localized electron densities. A sufficiently accurate KEDF that can describe this extreme case of both highly localized and a nearly fully delocalized density at the same time does not yet exist [17]. On the other hand, a suitable classical potential to describe the interactions between liquid Li and H isotopes also is still lacking. Thus, our only simulation option at the atomic scale is to use the much more expensive Kohn–Sham density functional theory (KSDFT) [18, 19].
KSDFT is the most popular first-principles method based on quantum mechanics, with no empirical parameters needed in its energy and force expressions. In principle, KSDFT is an exact theory, given an exact electron exchange-correlation (XC) functional. However, the exact XC functional remains unknown. Instead, the XC functional is typically approximated by adhering to known physical rules. Among the many XC functionals available, the local density approximation [20, 21] and the generalized gradient approximation [22–24] XC functionals are the two most widely used. However, KSDFT scales as  , where N is the number of atoms, which limits simulation sample sizes to no more than a few hundred atoms. Moreover, due to its greater expense, KSDFT-MD can only generate relatively short trajectories (a few tens of ps) compared to OFDFT or classical-potential MD, which are orders of magnitude faster.
Here we use the KSDFT-MD method to simulate liquid Li with inserted D atoms. Although KSDFT-MD has limitations on sample sizes and lengths of MD trajectories, we are still able to obtain meaningful data, while at the same time identifying where artifacts may appear due to these limitations. In what follows, we first validate the accuracy of KSDFT for the solid and liquid phases of Li and LiD. The calculated properties included melting points, diffusion coefficients, pair distribution functions, static structure factors, and bond angle distribution functions; these properties are then compared to existing experimental data. We first study these systems at temperatures above the melting point of rock-salt (RS) LiD ( K [25]), because the phase diagram of Li–LiD [26] obtained from experiments [27–31] shows that the Li–LiD system is a simple mixture of liquid Li and liquid LiD at these temperatures. We then study these systems below the melting point of LiD to consider a more complicated outcome: at high concentrations of D atoms in liquid Li above the solubility limit, solid LiD may begin to nucleate and the liquid Li with inserted D atoms may become a mixture of liquid Li and solid LiD. For this second scenario, a variety of structural and dynamical properties are studied: densities, diffusion coefficients, partial pair distribution functions, partial bond angle distribution functions, geometries, and electron distributions. Based on our analysis of these properties, we are able to answer the questions posed above.
This paper is organized as follows. We introduce our simulation methods and the details of our MD simulations in section 2. All simulation results and related discussion are presented in section 3. Finally, we draw conclusions from our work in section 4.
2. Methods
2.1. Models
All simulations were performed within the Vienna Ab Initio Simulation Package (VASP) [32–34]. The nuclei (Li and D) and core electrons (1s electrons of Li) were replaced by the potentials generated by the projector augmented-wave method [35]. We believe that the ionic potentials of Li and D used here are suitable for studying a wide range of concentrations of D in liquid Li because, as we shall see, these potentials yield trends in ionic densities and melting points with varying D concentration that are consistent with measurements. The Perdew–Burke–Ernzerhof XC functional (one of the most widely used generalized gradient approximations) was employed [24]. Periodic boundary conditions were chosen and the k-point meshes in the Brillouin zone were generated with the Monkhorst-Pack scheme [36]. The kinetic energy cutoff for the plane wave basis was set to 250 eV (with  k-points) to converge the total energy of a two-atom unit cell of body-centered-cubic (bcc) Li to within 0.5 meV atom−1 and 400 eV (with
  k-points) to converge the total energy of an eight-atom unit cell of rock-salt (RS) LiD to within 1.2 meV atom−1. The bulk moduli were computed by expanding and compressing the equilibrium volume by up to 2% and then the resulting energy-volume curves were fit to Murnaghan's equation of state [37]. We chose to use 400 eV with one k-point (0,0,0) for all MD simulations; the lack of k-point sampling is appropriate for disordered systems such as a liquid. Born–Oppenheimer MD was used with the Nosé–Hoover thermostat [38] in the NVT ensemble (constant number of atoms N, volume V, and temperature T). Natural abundance masses of 6.941 and 2.014 amu were chosen for Li and D, respectively. The mass for the Nosé–Hoover thermostat was set to 2.0 a.u., which controlled the fluctuations in total energy to be no more than 1.08% of the average value. A time step of 0.2 fs, which is smaller than the 0.5 fs used for pure Li in our previous OFDFT-MD simulations [14], was used to ensure the accuracy of the Verlet integration of Newton's equations of motion in the MD simulations. All of our simulations were done at zero pressure, which approximates the pressure condition in the high-flux D experiment (10−7 torr) [39].
2.2. Simulation Cells
We chose a  bcc cell (128 atoms with two atoms in each cubic unit cell) as an initial geometry for liquid Li and a
  RS cell (216 atoms with eight atoms in each RS cell) for LiD as an initial geometry for MD simulations. We then inserted four different concentrations of D atoms into liquid Li at temperatures ranging from 470 to 1143 K. Specifically, the ratios of D to Li atoms, defined as β, were 0.25, 0.50, 0.75, and 1.00. All six systems were simulated separately at six temperatures, namely, 470, 570, 686, 793, 943, and 1143 K. Thus, there are in total 36 systems that were studied by KSDFT-MD.
We performed the following five steps to generate simulation cells with the desired densities of liquid Li with inserted D atoms at different concentrations and temperatures. Each density was chosen upon the condition that the external pressure of the simulation cell fluctuated around zero. First, we obtained the density of Li at different temperatures (from 400 to 1143 K) using KSDFT-NVT-MD by following these procedures: (1) We took the initial density of Li from our previous OFDFT-MD simulations, in which the NPT ensemble (constant number of particles N, pressure P, and temperature T) was used to obtain the density of liquid Li at temperatures ranging from 200 to 725 K. For liquid Li at temperatures higher than 725 K, the initial density of liquid Li was obtained by linearly extrapolating the densities of liquid Li below 725 K. (2) Once the initial density of Li was set, we increased the density by 1% in each Li system to get a second density. For both densities, we ran a 10 ps NVT-MD trajectory and obtained the equilibrium pressures by sampling the last 5 ps of the trajectory. (3) We used the two new pressures and densities to linearly extrapolate to a new density at which the pressure should be zero. (4) We always used the two newest pressures to do the next extrapolation until the equilibrium pressure obtained was smaller than 0.2 GPa. We found that two to three iterations were enough to obtain the final density. (5) Properties such as pair distribution functions, static structure factors, and diffusion coefficients (see below) of liquid Li at different temperatures were then calculated from a 20 ps production run and compared to existing experimental data to ensure that we had correctly simulated liquid Li at zero pressure. The density of LiD at different temperatures was obtained by heating up a RS cell from 0 K to a target temperature. The initial density of LiD was obtained from  , where
  and
and  are the densities of Li and LiD at temperature T. Once the initial density of LiD was obtained, we followed exactly the same procedures used for Li to obtain the final density of LiD.
To obtain homogeneous solutions of D in liquid Li, the four concentrations of D atoms (LiD with
with  , 0.50, 0.75, and 1.00) were inserted randomly by a random number generator into the final configuration of liquid Li from the 20 ps production run above, heated up to 1500 K, and then equilibrated for 2 ps. After this step, we found that all of the cells experienced negative pressures (the cell was too large), ranging from around −1 (
 ) to −3 GPa (
 ). The negative pressure is due to the strong bonding between Li and D atoms, which shortens the bond lengths in Li samples with D atoms compared to those in pure liquid Li. The system was then quenched to a target temperature with a trial density, which was chosen by
 ![${{\rho}_{\text{Li}}}(T)+\beta \times \left[{{\rho}_{\text{LiD}}}(T)-{{\rho}_{\text{Li}}}(T)\right]$](https://content.cld.iop.org/journals/0029-5515/56/1/016020/revision1/nf521855ieqn016.gif) at each temperature. A trajectory ranging between 5 and 50 ps was run on the cooled-down system to determine the exact density of this system at each temperature. The length of the trajectory was dependent upon the external pressure of the simulation cell; if a non-zero external pressure was observed at equilibrium, we used the linear extrapolation method described above to obtain a more accurate density, and then the systems with inserted D atoms were cooled down yet again from 1500 K to a new density. The density of each system was updated manually until an accurate density was found to ensure only small external pressures (smaller than 0.2 GPa) existed throughout the entire trajectory. Finally, the correct density at zero pressure at a given temperature of each liquid Li sample with inserted D atoms was obtained; this was then followed by a 20 ps production run to collect statistics.
at each temperature. A trajectory ranging between 5 and 50 ps was run on the cooled-down system to determine the exact density of this system at each temperature. The length of the trajectory was dependent upon the external pressure of the simulation cell; if a non-zero external pressure was observed at equilibrium, we used the linear extrapolation method described above to obtain a more accurate density, and then the systems with inserted D atoms were cooled down yet again from 1500 K to a new density. The density of each system was updated manually until an accurate density was found to ensure only small external pressures (smaller than 0.2 GPa) existed throughout the entire trajectory. Finally, the correct density at zero pressure at a given temperature of each liquid Li sample with inserted D atoms was obtained; this was then followed by a 20 ps production run to collect statistics.
2.3. Statistical Properties
The statistics collected from a 20 ps production run were used to calculate a list of properties, which provide detailed structural and dynamical information. First, we computed the pair distribution function, defined as

where N is the number of atoms and ρ is the atomic density.  and
and  are the atomic coordinates of atoms i and j, and
  is the distance between the two atoms. g(r) describes a probability of finding any two atoms at a given inter-atomic distance, and is ideal for studying systems that do not exhibit long-range order, such as liquids. The Fourier transform of g(r) produces the static structure factor, defined as
Both g(r) and S(q) can be determined from x-ray or neutron diffraction experiments, so calculations of both properties can be good benchmarks to test the accuracy of computational models, as was done in our previous work [14]. However, the pair distribution function is used for one element; to analyze systems with two elements, i.e. Li and D, we used the partial pair distribution function [40]:
where species  .
.
While the (partial) pair distribution function provides the relative placements of two atoms, the bond angle distribution function  describes the relative positions of three neighboring atoms (or more, depending the choice of radial cutoff). The
  employed in our study characterizes local structures by giving the distribution of statistically averaged bond angles between each atom and its two nearest neighbors [41]. We used an infinite radius to search for the two nearest neighbors of each atom, recognizing that the two neighbors we find do not necessarily form bonds with the atom. The
  used in this work is defined such that
  with
with  . We further divided
  into partial bond angle distribution functions, which were calculated by dividing each
  into different components, with each part representing one specific type of bond angle.
In addition to the aforementioned structural properties, we also evaluated dynamical properties, in particular, the diffusion coefficient, which is derived from the time evolution of the mean square displacement:
where t is time. The diffusion coefficient is obtained from:
3. Results and discussion
In this section, after briefly describing the fluctuations observed in our KSDFT-MD simulations, we discuss simulations of the solid and liquid phases of pure Li and LiD. For both materials, the calculated properties are compared to available experimental data. Thereafter, we report results for liquid Li with four different concentrations (LiD ,
,  , 0.50, 0.75, and 1.00) of inserted D atoms over a large temperature range. At temperatures above the melting point of RS LiD, no solid LiD is expected to form. We confirm the existence of liquid LiD and calculate its properties. At temperatures lower than the melting point of RS LiD, we observe a liquid–solid phase transition and find RS LiD forms in some samples (vide infra). We then report the diffusivities of Li and D atoms in each sample as a function of temperature. Our discussion then turns to our observations of some D2 molecules in samples with a high concentration of D and a new local structure observed in samples with less D than Li. We conclude this section by considering whether metastable states may form in our simulations.
3.1. Fluctuations in molecular dynamics
It is critical to keep fluctuations in an MD simulation within a normal range so as to maintain equilibrium when evaluating properties. Large fluctuations may lead to spurious phenomena, such as unwanted phase transitions. We therefore consider here the case expected to have the largest fluctuations, namely the heterogeneous liquid LiD simulated with KSDFT-NVT-MD at the highest temperature considered (1143 K). Figure 1 shows the fluctuations of the potential energy, the conserved Nosé–Hoover energy, and the external pressure of the liquid LiD cell in the 20 ps production trajectory. The potential energy is defined as the system's total energy calculated by KSDFT, while the conserved Nosé–Hoover energy is the sum of the potential energy, the kinetic energy of the atoms, and the thermostat's energy. The conserved energy shown in figure 1(a) keeps constant without drifting during the 20 ps equilibrium trajectory, while the potential-energy fluctuations are less than 1.08% of the average value. The measured phase transition pressures of Li and LiD at room temperature are 8 GPa [42] and higher than 94 GPa [43], respectively. Both pressure values are much larger than the observed fluctuating pressure values (around 1 GPa) shown in figure 1(b). We thus conclude that the fluctuations in our MD simulations are not large enough to induce phase transitions in Li and LiD.
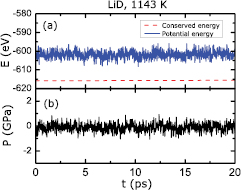
Figure 1. A 20 ps equilibrium trajectory of liquid LiD at 1143 K derived from KSDFT-NVT-MD. (a) The potential energy (solid blue) and the conserved Nosé–Hoover energy (dashed red). (b) The fluctuations in external pressure acting on the simulation cell. The external pressure fluctuates around zero pressure and the amplitude of the fluctuations is smaller than 1 GPa.
Download figure:
Standard image High-resolution image3.2. Li
Solid and liquid Li have been studied extensively with KSDFT [14, 42, 45–47]. For example, KSDFT yielded 455 K as the melting point of Li at zero pressure [42], in excellent agreement with the experimental value of 453 K [48]. Our model's ability to reproduce properties of Li crystals had already been validated [14]. Four different crystal structures of Li were considered: bcc, face-centered-cubic, simple cubic, and diamond. Among them, the bcc structure was found to be the most stable, with a lattice constant of 3.439 Å and a bulk modulus of 14 GPa [14], in good agreement with the respective experimental values of 3.48 Å [49] and 13 GPa [50]. In the present work, we test the same model for liquid Li. Figure 2 shows the calculated densities of liquid Li at a range of temperatures, together with experimental data [44]. We see the density of pure liquid Li (pink solid circles) monotonically decreases as the temperature increases, consistent with the experimental data and corresponding to a simple thermal expansion of a single phase. However, our calculated Li densities are too large by 3.8% when compared to the experimental data at 470 K, with increasing overestimation up to 9.6% at 1143 K. The reason is three-fold: First, the imposed periodic boundary conditions in our simulations produce more ordered structures in liquid Li and consequently higher liquid densities. Second, our single phase simulations do not account for liquid-vapor coexistence present in the experiments. Higher vapor pressures at higher temperatures in the experiments—leading to lower densities—are probably partly responsible for the increased deviation at higher temperatures. Third, impurities in the experimental Li samples that are not present in our pure Li simulations also may affect the measured densities, as noted in [44]. We consider these deviations from experiment to be acceptable because they are much smaller than the density differences between Li and LiD. Additionally, all pure Li samples simulated at temperatures higher than 470 K are in the liquid phase, consistent with the experimental melting point of 453 K [48]. We also simulated pure Li at 400 K (vide infra) in order to compare properties of solid and liquid phases of Li.
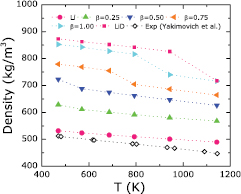
Figure 2. Calculated densities for pure liquid Li (solid circles), liquid Li samples with four different D concentrations (LiD , with
  ; solid triangles), and LiD (solid squares). The starting geometries for liquid Li and LiD were taken to be body-centered-cubic and rock-salt, respectively. The experimental data [44] are for liquid Li (open diamonds).
Download figure:
Standard image High-resolution imageFigure 3 displays our KSDFT-derived pair distribution functions g(r) and static structure factors S(q) of Li at different temperatures. We expect these data to be quite reliable, given that our previous OFDFT-MD simulations of liquid Li already matched experimental data very well [14]. Here we emphasize the most notable changes in g(r) and S(q), which occur between 400 and 470 K. Specifically, the g(r) of pure Li at 470 K is smooth and does not change considerably as the temperature increases to 1143 K, while the g(r) of pure Li at 400 K has a significantly different shape. The latter exhibits features of solid bcc Li, matching the g(r) of solid bcc Li in [47]. Moreover, we see that the S(q) of pure Li at 400 K in figure 3(c) (inset in figure 3(b)) differs starkly from those S(q) at temperatures higher than 470 K. Specifically, the S(q) of Li at 400 K consists of discretized points whereas the S(q) of Li at 470 K and higher are all relatively smooth curves. The S(q) with discretized points also has peak heights about 20 times larger than the peak heights of S(q) with the smooth curves. We conclude that the S(q) in figure 3(b) correspond to liquid features (no sharp peaks but smooth curves of lower amplitude) whereas the S(q) in figure 3(c) has solid features (isolated high peaks). The four peaks of S(q) in figure 3(c) are located at 2.54, 3.60, 4.43, and 5.08 Å−1, respectively. The location of each peak can be calculated according to the distances of neighbors of an atom in bcc Li. By studying the g(r) and S(q) of Li, we conclude that a solid bcc Li to liquid Li phase transition occurs between 400 and 470 K, which is consistent with both the experimental melting temperature of Li (453 K) and our earlier OFDFT-MD simulations [14].
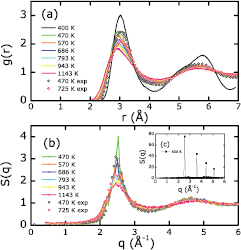
Figure 3. (a) Li pair distribution functions (solid lines) for pure Li at temperatures ranging from 400 to 1143 K. (b) Liquid Li static structure factors (solid lines) at temperatures ranging from 470 to 1143 K. (c) Static structure factor (squares, inset in (b)) of solid Li at 400 K. Experimental data at 470 (black open circles) and 725 K (red open circles) [51] are included for comparison in (a) and (b).
Download figure:
Standard image High-resolution imageThe bond angle distribution functions  of pure Li are shown in figure 4(a). All of the
  of liquid Li exhibit two distinct peaks, with one peak located around
  and the other peak around
  . Both peaks are not too different from the bond angles in a bcc structure at 0 K, which are
  and
and  , respectively. In general, liquids do not exhibit long-range periodicity but can have organized local structures; the
  can thus be used as fingerprints to identify pockets of pure liquid Li in a liquid mixture.
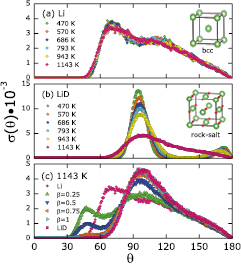
Figure 4. Bond angle distribution functions of (a) liquid Li at temperatures ranging from 470 to 1143 K (initial geometry is body-centered-cubic); (b) LiD at temperatures ranging from 470 to 1143 K (initial geometry is rock-salt); and (c) liquid Li with inserted D atoms at 1143 K. Four different concentrations of D atoms are shown (LiD , with
  ). For ease of comparison, the pink squares (LiD) and the pink circles (Li) in (c) are reproduced from the pink squares in (b) and the pink circles in (a).
Download figure:
Standard image High-resolution imageThe calculated diffusion coefficients of liquid Li together with experimental data are displayed in figure 5(b). Although slightly smaller than the measured values (solid line), these calculated diffusion coefficients (black circles) closely follow the experimental trend with increasing temperature [52], with the similar slopes suggesting that the measured activation energy for Li self-diffusion is captured well in our model. Specific predictions of diffusivity are also very accurate. For instance, the calculated diffusion coefficient of liquid Li at 470 K is 0.60  ps−1 while the measured value is 0.63
  ps−1 [53].
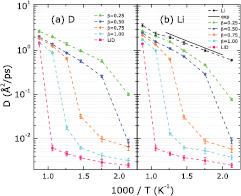
Figure 5. Diffusion coefficients of (a) D and (b) Li atoms in all six samples at temperatures ranging from 470 to 1143 K. The six points chosen from the horizontal axis (from left to right) refer to 1143, 943, 793, 686, 570, and 470 K, respectively. Experimental data for liquid Li from 500 to about 830 K are also included for comparison [52].
Download figure:
Standard image High-resolution image3.3. LiD
In a recent experiment [9], the sputtering yield of Li from thin Li films under high-flux D plasma bombardment was found to be about 5–10 times smaller than expected. To explain this discrepancy, the authors postulated that LiD precipitates might form in liquid Li with high concentrations of D atoms. Accurate KSDFT simulations of the solid and liquid phases of LiD can help to confirm or refute this hypothesis.
We therefore first simulated solid crystal structures of LiD. Three different phases of LiD were examined: the RS, cesium chloride, and zinc-blende crystal structures. LiD in the RS structure is observed at pressures up to 94 GPa at room temperature [43]. KSDFT properly predicts the RS structure to be the most stable (at 0 K and zero pressure), with a lattice constant of 3.998 Å and a bulk modulus of 35 GPa, in very good agreement with the measured values of 4.045 Å and 33.5 GPa [54].
We next simulated LiD at a range of temperatures—initialized in the RS structure—to obtain the theoretical melting point. The temperatures ranged from 470 to 1143 K; we chose 470 K as a lower bound to keep consistent with the liquid Li state we ultimately wish to study. The density of LiD obtained from KSDFT-MD simulations is shown in figure 2 (pink squares). We observe a discontinuity in the density versus temperature data, indicating that a solid–liquid phase transition occurs somewhere between 943 and 1143 K, consistent with the experimental melting point of  K [25]. This result suggests that our KSDFT-MD simulations to follow will properly capture the correct solidification of LiD at temperatures 943 K and below. We next discuss partial pair distribution functions, bond angle distribution functions, and diffusivities of LiD at various temperatures.
The three partial pair distribution functions of LiD, namely,  ,
,  , and
, and  are shown in figure 6. At temperatures lower than 1143 K, all three functions clearly exhibit the features of a solid RS structure. The evidence is twofold. First,
  and
and  are very similar because the Li and D atoms occupy equivalent coordinates (related by simple translations) in a RS structure. Second, each Li atom is surrounded by D atoms, and vice versa. This is evidenced by the location of the first peak in
  , which represents the shortest distance between any two atoms in a RS structure. When the temperature is increased to 1143 K, dramatic changes simultaneously occur in
  ,
,  , and
, and  , suggesting that a solid–liquid phase transition occurs. Specifically, the location of the first peak in
  shifts from 1.92 to 1.80 Å, while the second (3.52 Å) and third peaks (4.53 Å) disappear. The survival of the first peak means the bonding between Li and D atoms is still strong, while the disappearance of the second and third peaks suggests that the original long-range order in the solid RS structure is destroyed. Instead, a new peak at 4.18 Å indicates that a new local structure forms in the new phase of LiD at 1143 K. At the same time, in both
  and
and  , the magnitude of the first peak drops quickly, with a slight shift in its location from 2.84 to 2.77 Å. As with
  , the second (4.04 Å) and third (5.00 Å) peaks also disappear, and new peaks similarly emerge at 5.38 Å. Based on our observations that all the partial pair distribution functions at 1143 K are more smooth and lower amplitude (liquid-like) and are significantly different than those at 943 K and lower, we again conclude that a solid–liquid phase transition occurs above 943 K, with the melting point of RS LiD lying between 943 and 1143 K, consistent with the experimental value (
 K [25]).
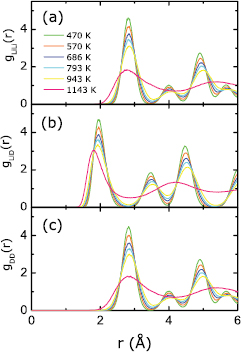
Figure 6. Partial pair distribution functions of LiD with temperatures ranging from 470 to 1143 K. The initial geometry of LiD is chosen to be rock-salt.
Download figure:
Standard image High-resolution imageThe LiD bond angle distribution functions  plotted in figure 4(b) provide further evidence for the melting of LiD at temperatures above 943 K. First, note that each atom in a perfect RS structure has six identical nearest neighbors (as can be seen in the inset of figure 4(b)). By choosing any two atoms from the six neighbors, 90° and 180° are the only two bond angles that can be found, in a ratio of
  Similarly, at temperatures lower than 1143 K, the bond angle distribution functions in solid LiD are mainly located at 98° and 172°, with both angles deviating about 8° from those at 0 K due to thermal vibrations and their attendant anharmonicity that increases with temperature. We also observe that the magnitude of the 98° peak is much larger than the 172° peak, qualitatively consistent with the aforementioned
  ratio. Second, at temperatures of 943 K and below, essentially no bond angles are observed between 120° and 150°. However, when the temperature is increased to 1143 K, we see a sharp decrease of the 98° peak together with disappearance of the 172° peak. At the same time, a broad distribution of bond angles emerges from 120° to 150° decreasing towards 180°, indicating that more disordered structures (liquid-like features) form at this elevated temperature. These observations again support the conclusion that a solid–liquid phase transition occurs above 943 K. Moreover, when comparing the bond angle distribution functions
  between LiD and pure liquid Li, significant differences are apparent: the
  of LiD starts around 60° and has peaks at 98° and 172°, while the
  of pure Li starts around 45° and has peaks at
  and
and  . We thus conclude that these features in
  can act as fingerprints of the pure liquid and solid phases of Li and LiD.
The diffusivities of Li and D atoms in both solid and liquid phases of LiD are shown in figure 5. For LiD samples heated up from the RS structure, the diffusion coefficients in the solid phase (at temperatures 943 K and lower) are very small, as expected. Taking Li atoms as an example, the diffusion coefficients are less than 0.01  ps−1 at both 470 and 943 K, significantly smaller than the diffusion coefficients of Li atoms in liquid Li, e.g. 0.60
  ps−1 at 470 K and 2.38
  ps−1 at 943 K, respectively. The difference is simply that the LiD structures have not melted and Li atoms cannot move freely. A sharp increase in the diffusion coefficient is observed in LiD when the temperature increases from 943 to 1143 K: from less than 0.01 to 1.41
  ps−1 for Li and from less than 0.01 to 1.44
  ps−1 for D. The two orders of magnitudes of increase in the diffusion coefficients provides yet another indicator that a solid-to-liquid phase transition has occurred. Importantly, we predict that the diffusion coefficients of Li and D atoms are strongly correlated, i.e. both types of atoms have almost identical diffusion coefficients at temperatures ranging from 470 to 1143 K. Combining this high correlation in the Li and D diffusivities in LiD with the fact that the first peak in the partial pair distribution function
  survives the solid–liquid phase transition, we conclude that very strong bonding exists between Li atoms and their first neighbor D atoms in both solid and liquid phases of LiD. Indeed, it is likely that LiD diatomics are diffusing upon LiD melting.
3.4. Above the melting point of LiD in D-impregnated liquid Li
The Li–LiD phase diagram [26] indicates that liquid Li and liquid LiD can coexist in an equilibrium state at 1143 K. However, much remains unknown about the liquid Li samples with inserted D atoms: does liquid LiD form? How do the D atoms affect the local structure of liquid Li? Do D2 molecules form?
In this section, we first prove the existence of liquid LiD in our simulations and then further analyze its properties. The analysis is mainly based on the bond angle distribution functions  . Figure 4(c) shows the calculated
  for pure liquid Li, pure liquid LiD, and liquid Li samples with four different concentrations of D atoms. Several findings are described in what follows.
The  liquid enters the equilibrium state by being impregnated with randomly distributed D atoms and then being cooled down from 1500 K to a target temperature. By contrast, the pure LiD sample is heated up from a solid RS structure at 0 K to a target temperature. The physical processes used to prepare the two samples serve different purposes: the former is used to study what will happen after inserting D atoms into liquid Li without any memory of solid LiD while the latter is used to gauge the melting point of solid RS LiD. Though the two systems were generated differently, we find that the
  of the
  liquid (cyan triangles in figure 4(c)) is almost identical to the
  of the LiD liquid (pink squares in figure 4(c)). In particular, the major peaks in both
  are located at
  . As previously discussed, we know the
  peak in
  is a general feature of liquid LiD at zero pressure. We thus suspect that the
  system is mostly if not all liquid LiD, based on the observation that the
  of the
  sample is nearly identical to the
  of the LiD sample. To further confirm this hypothesis, we calculated the partial bond angle distribution functions: the
  was decomposed into six partial functions, with each part representing one specific type of bond angle. We selected and summed up the two bond angle types existing in a RS LiD structure, i.e. bond angles formed by connecting a Li atom with two D atoms, and vice versa. The results are shown in figure 7(b), from which we see that the
  peak (a signature of liquid LiD) in
  increases with β, and reaches the highest magnitude in the
  sample. Based on these findings, we again conclude that the amount of liquid LiD formed at 1143 K increases with increasing concentrations of D atoms in liquid Li, and that primarily LiD liquid forms in the
  liquid. This finding suggests that full retention of D atoms in liquid Li is possible in mixtures of liquid Li and liquid LiD, at least up to a
  ratio of D to Li.

Figure 7. Four categories of partial bond angle distribution functions ( ) in pure Li, pure LiD, and liquid Li samples with four different D concentrations (LiD
 , with
  ) at 1143 K. For each partial pair distribution function, only the two nearest neighbors for each atom are taken into account, and the corresponding bond angle type is shown in each figure. Note that the range of the vertical axis in (d) is two orders of magnitude smaller than (a), (b), and (c), indicating the probability of finding this bond angle type shown in (d) is very small. Clusters of three D atoms were not found in any simulations.
Download figure:
Standard image High-resolution imageThe partial bond angle distribution functions in figure 7(a) shows the bond angle type formed by three Li atoms, obviously the only one possible in pure liquid Li. However, this type of bond angle is strongly suppressed with increasing β and hardly exists at all in the  and higher samples. The rapidly decreasing magnitude of this bond angle distribution also implies that the pure Li local structures change a great deal with increasing β.
Figure 7(d) shows a type of bond angle formed by one D atom connecting to one Li atom and another D atom. This bond angle could occur either via formation of D2 molecules solvated by Li atoms or via LiD molecules interacting with a solvated D atom. Note that the range of vertical axis in figure 7(d) is two orders of magnitude smaller than figures 7(a)–(c), suggesting the type of bond angle shown in figure 7(d) is much less probable than the bond angle types in figures 7(a)–(c). Thus we expect D2 formation to be a rare event, though not impossible. Not a single bond angle ever was formed by three D atoms in any trajectory at any temperature considered. Thus, D clusters of three or more D atoms will not exist at these concentrations. This observation also implies that D atoms are distributed quite uniformly among Li atoms regardless of the D concentration in liquid Li.
3.5. Below the melting point of LiD in D-impregnated liquid Li
Nuclei of solid LiD are expected to form in the liquid Li host (due to the liquid–solid phase transition) when liquid Li samples with inserted D atoms are cooled down below the melting point of RS LiD ( K). We will study these samples by analyzing their densities, pair distribution functions, bond angle distribution functions, diffusivities, geometries, and electron distributions. By analyzing all of these data, we are able to confirm that the liquid–solid transition occurs and RS LiD forms. We also observe some D2 molecules in the
  sample. Details are provided in the following subsections.
3.5.1. Liquid to solid phase transition.
In general, samples at lower temperatures and higher D concentrations have the following four noteworthy features that furnish evidence of liquid–solid phase transformations.
First, the discontinuities observed in the density versus temperature plots for LiD and liquid Li samples with high concentrations of inserted D atoms are similar (figure 2). Because the discontinuity found in LiD's density versus temperature behavior was found to correspond to a solid–liquid phase transition, we suspect the latter samples also undergo this transition. Phase transition temperatures can be very roughly estimated from the midpoint of the temperature range where the discontinuities occur in the density curves during cool-down. We thus estimate them to be around 500, 750, and 900 K in the  , 0.75, and 1.00 samples, respectively. The
  sample may not have undergone a phase transition because the discontinuity in its density versus temperature curve is not significant compared to the others.
Second, we select temperatures near the discontinuities in the density curves and plot the partial pair distribution functions ( ,
,  , and
, and  ) in figure 8. Two temperatures are selected for each sample with a different value of β, i.e. one above and one below the discontinuity. We find that the
  from
from  , 0.75, and 1.00 have solid-like features (more than two peaks) at selected lower temperatures and liquid-like features (smooth curves with only two peaks with lower amplitudes) at selected higher temperatures. This analysis provides more evidence of the liquid–solid phase transition. Note also that the
  from
from  and 0.75 in figure 8 closely resemble the
  in both pure liquid Li (see figure 3(a)) and in solid LiD (see figure 6(a)), suggesting that at these intermediate concentrations we have evidence of nucleation of LiD in liquid Li.
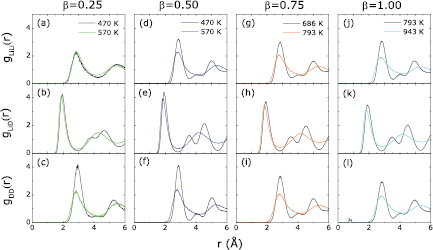
Figure 8. Partial pair distribution functions of liquid Li with four different D concentrations (LiD , with
  ). Two temperatures are chosen around the transition temperatures for each β.
Download figure:
Standard image High-resolution imageThird, the bond angle distribution functions  for all samples with different β are illustrated in figure 9 for temperatures ranging from 470 to 943 K. Large changes in the
  are observed in all samples upon cooling. Specifically, the changes are observed at three locations in the
  : (i) the height of the peak at 98° increases significantly; (ii) the peak at around 172° emerges; and (iii) contributions to
  between 120° and 150° disappear. In general, more localized and higher peaks in
  suggest more ordered local structures compared to those
  with relatively lower and broader peaks, suggesting that solid structures indeed formed in these samples as we cooled them.
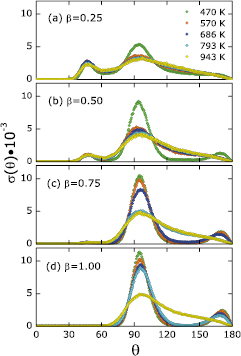
Figure 9. Temperature dependence of bond angle distribution functions of liquid Li samples with four different inserted and equilibrated D concentrations (LiD , with
  ). The temperatures range from 470 to 943 K.
Download figure:
Standard image High-resolution imageFinally, discontinuities in the diffusion coefficients of both Li and D atoms are observed (figure 5). The temperatures where these discontinuities occur are exactly the same as those temperatures found for the density curve discontinuities (figure 2). Notably, the diffusion coefficients have a much clearer boundary between solid and liquid phases than our earlier metrics, with 1–2 orders of magnitude smaller diffusion coefficients for the lower temperature phase compared to those of the higher temperature phase.
Overall, when liquid Li samples with D atoms are quenched down from 1500 K, liquid–solid phase transitions occurred at higher temperatures for higher concentrations of D. This trend is to be expected if more nuclei of LiD are forming, since LiD has a higher melting point than Li.
3.5.2. Formation of rock-salt LiD.
To reveal details of the LiD structures formed as a result of the liquid–solid phase transitions, geometries from the end of the 20 ps production runs are shown in figure 10. We plot two three-dimensional snapshots at temperatures above and below the liquid–solid phase transitions for samples at each D concentration. Figures 10(a)–(c) reveal that a subset of the atoms form nuclei of solid LiD because the number of Li atoms is larger than the number of D atoms in all three of these cases. Meanwhile, the disordered structure formed by the rest of the Li atoms is likely to be liquid Li, as evident in figure 10(a), though harder to infer from figures 10(b) and (c). Figure 10(d) shows the  structure at 793 K, which mostly exhibits a typical RS structure where most Li and D atoms are bonded to the other type of atom, and the bond angles comprise one Li and two D atoms or vice versa. By contrast, figures 10(e)–(h) show the hallmarks of liquids, namely fully disordered structures, as we now describe in more detail.
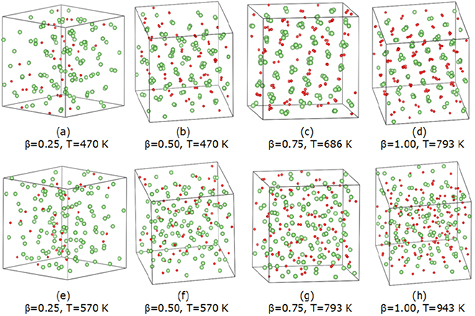
Figure 10. Three-dimensional snapshots of liquid Li samples with different concentrations of D atoms (LiD , with
  ) in their final configurations at the end of a 20 ps production run. Li atoms are depicted in green, D atoms in red. Two temperatures (
 ) are selected for each sample, near where discontinuous changes were observed in the bond angle distribution functions (shown in figure 9). Snapshots of (a)–(d) exhibit solid-like features, in which the Li atoms near D atoms have more ordered structures compared to other Li atoms far away from D atoms. Snapshots of (e)–(h) show liquid-like features, in which no ordered structures are seen.
Download figure:
Standard image High-resolution imageThe partial pair distribution functions  (in figure 8) in samples with different β keep the same shapes for all solid samples: three peaks in
  located around 1.91, 3.49, and 4.50 Å, respectively. Moreover, these peak locations are very close to those of RS LiD (1.92, 3.51, and 4.53 Å), as shown in figure 6. We conclude that both
  in RS LiD and the
  sample have the same local structures. Moreover, the bond angle distribution functions
  in figure 9 indicate that when the liquid–solid phase transition occurs, most atoms with bond angles between 120° and 150° are changing to
  or 172° (typical bond angles of RS LiD at nonzero temperatures) and the resulting
  is very close in shape to the
  of RS LiD (figure 4(b)). All these findings suggest that RS LiD nuclei can form after inserting high concentrations of D atoms into liquid Li samples, as long as the temperature of the liquid Li is below the melting point of LiD.
3.5.3. Diffusivities.
Large changes in Li and D diffusion coefficients are observed as the temperature rises in samples with different β (figure 5). Taking D atoms as an example, the diffusion coefficient in the  sample changes from 0.02 to 0.89
  ps−1 upon heating from 793 to 943 K while the diffusion coefficient for the
  sample jumps from 0.03 to 0.66
  ps−1 upon heating from 686 to 793 K. These changes occur between 470 and 570 K for the
  and
and  samples, with their diffusion coefficients increasing from 0.01 to 0.26
  ps−1, and 0.10 to 0.57
  ps−1, respectively.
Several more remarks can be made regarding trends in diffusivities. First, at any given temperature, a larger D concentration correlates with a smaller diffusion coefficient. We thus speculate that the number of chemical bonds between Li and D atoms increases with β, which will not only slow down diffusion but may induce a liquid–solid phase transition. Second, the Li and D diffusion coefficients are nearly equal to each other in all samples, indicating that the motion of both types of atoms is strongly correlated, presumably through Li-D chemical bonds. It could be that LiD diatomics are diffusing through these samples. Third, diffusion coefficients can signal structural differences between different samples. For instance, the diffusion coefficients of the  and the pure LiD samples have noticeable differences. Specifically, at 943 K, the
  sample is still a liquid with large diffusion coefficients while the LiD sample is a solid with smaller diffusion coefficients. This implies that the liquid–solid transition in the
  system has not yet occurred at 943 K. Moreover, at temperatures lower than 943 K, the diffusion coefficients in the
  sample are slightly higher than those in the LiD sample. This is likely due to an incomplete liquid–solid phase transition in the
  sample and some structural differences still remaining between the two samples. More detailed analysis regarding these differences will be discussed further in the next subsection.
3.5.4. Existence of D2 molecules.
Evidence for the formation of D2 molecules is discussed here. First, the partial pair distribution function  of the
  sample (figure 8(l)) has a small peak between 0.69 and 0.90 Å which is close to the bond length of a D2 molecule (0.74 Å). We suspect that this peak represents D2 molecules vibrating in the
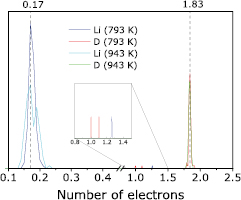
  sample at 793 K. Because the charge state of a D atom is very different in a D2 molecule and LiD, we evaluated charge states of all D atoms in all samples to verify the existence of D2 molecules. This analysis provides us a second piece of evidence for D2 formation. Specifically, we used Bader charge analysis [55] of the electron distributions, which decomposes the total electron density of a system into atomic contributions. Figure 11 displays the valence electron distributions of Li and D atoms in the
  sample at two temperatures. It is immediately evident that the majority of Li and D are present as ions in this sample, as roughly Li+ and D−, judging from large peaks at small (Li) and large (D) numbers of valence electrons. As a reference, the electron numbers for Li and D atoms in RS LiD at 0 K were calculated to be 0.17 for Li and 1.83 for D; those values appear at the center of the large peaks mentioned above. Thus the bonding in the
  sample is ionic, very similar to that of RS LiD. However, we do see that some very small peaks exist near 1.0 electron, corresponding to neutral D, which would be present only in D2. Note that we find D2 molecules only in the
  samples. Bader charge analyses of samples containing lower concentrations of D reveal peaks with broader distributions. For example, Li atoms with Bader charges between 0.15 and 1.00 can be found, suggesting both ionic and metallic Li are present in mixtures of LiD and Li metal. By contrast, the D atoms in these lower concentration samples all have Bader charges larger than 1.75, corresponding to D anions in the LiD regions, as in the majority of the
  material, but with no evidence of formation of D2 molecules.
Figure 11. Valence electron distributions in liquid Li samples with  . The dashed lines at 0.17 and 1.83 correspond to the calculated numbers of valence electrons around each Li and D nucleus in rock-salt LiD at 0 K. LiD forms a very ionic bond. The inset shows some D atoms in a neutral state with one electron per D, i.e. as D2 molecules.
Download figure:
Standard image High-resolution image
Interestingly, we find that these D2 molecules are not stable at 1143 K; they survive in the first few ps simulations but then dissociate when the system approaches equilibrium at this higher temperature. Similar conclusions were reached in previous work [56] examining liquid LiD at temperatures of 1015 K and higher.
As discussed earlier, the diffusion coefficients in the  sample are consistently larger than those found in the pure LiD sample, despite the concentrations of D atoms being the same. The existence of D2 molecules in the
  sample is responsible for the different diffusivities. The compositions in the two samples are different: the
  sample is a mixture of mostly LiD with a few D2 molecules while the pure LiD sample only has LiD. The D2 molecules contribute some extra diffusivity to the Li and D atoms, resulting in larger diffusion coefficients for both type of atoms. Lastly, the D2 molecules are responsible for the larger volume of the
  sample when compared to the volume of the LiD sample (as is clear from the density curves in figure 2).
3.5.5. A new local structure.
The bond angle distribution functions  of the
  , and 0.75 samples at 1143 K (figure 4(c)) have two peaks located at
  and
and  . The
. The  peak is a feature of liquid LiD as discussed before. Interestingly, the
  peak disappears in pure liquid Li, pure liquid LiD, and the
  samples, meaning that the
  peak only appears when the number of inserted D atoms is smaller than the number of Li atoms. In addition, the peak height is unchanged from 470 to 1143 K and only changes with the concentration of D (see figure 9); the peak height has the highest magnitude in the
  sample and decreases as β increases. To learn more, we decomposed
  into partial functions to see the exact local structure for the
  peak. The results (figure 7) reveal that the
  peak mostly arises from a specific type of bond, in particular, one Li atom connected to another Li atom and one D atom. As mentioned earlier, the strong Li-D bonding between a Li atom and its nearest D neighbors, and vice versa, exists over the entire temperature range we have studied. This temperature-independent feature of Li-D bonds is inconsistent with the characteristics of the
  peak. However, the Li-D bond also exists in the
  and the pure LiD samples while the
  peak does not. Note that neither of these samples have liquid Li to offer extra Li atoms to form a bond angle with the Li-D bond. We thus conclude that the
  local structure is an interfacial structure due to interactions between liquid Li coexisting with the Li-D chemical bonds present in both solid and liquid phases of LiD.
3.5.6. Metastable states.
When the liquid Li samples with inserted D atoms are quenched down from 1500 K to temperatures below the melting point of RS LiD, nuclei of solid LiD are expected to form due to the liquid–solid phase transition, and the rates of forming and growing nuclei determine how fast the liquid–solid phase transition can occur and finish. However, two factors in our simulations may prevent the liquid–solid phase transition from occurring or finishing: (i) supercooling due to the relatively short time trajectory compared to the time duration in classical-potential simulations or experiment and (ii) artificial periodicity perhaps incommensurate with the phase change, introduced by the small simulation cell. As discussed before, we ensured that the pressures of our samples during each 20 ps equilibrium trajectory fluctuated around zero, suggesting that all samples entered equilibrium states. However, the  sample at 943 K has large diffusion coefficients for Li (0.99
  ps−1) and D atoms (0.89
  ps−1), even at a temperature below the melting point of RS LiD (
 K), indicating that this sample is a supercooled liquid and the liquid–solid phase transition has not yet occurred. This suppression of the phase transition could be due to either the short time or the imposed artificial periodicity of the simulation.
Although nucleation can occur when samples are in metastable states and potentially affect the accuracy of the predicted diffusion coefficients, the diffusion coefficients in figure 5 are stable without overly large error bars. In principle, D2 molecules may be metastable but we predict them only to exist in high D-concentration solid rather than liquid samples. Lastly, the small number of metastable states (only one) observed among all 36 simulated systems suggests that our general findings, such as observations of liquid–solid phase transitions, formation of RS LiD, and the existence of a new local interfacial structure due to coexistence of liquid Li and RS LiD, are unaffected by this metastability.
4. Conclusions
In summary, we used KSDFT-NVT-MD to study structural and dynamical properties of liquid Li samples with four concentrations ( , 0.50, 0.75, and 1.00) of inserted D atoms at temperatures ranging from 470 to 1143 K. This quantum-mechanics-based first-principles method treats both Li and D atoms at the same level of accuracy, because our KSDFT model has no empirical parameters. Excellent agreement was obtained when we validated several key properties of Li and LiD in both solid and liquid phases against existing experimental data. For example, our calculated pair distribution functions and static structure factors of pure Li agree very well with existing experimental data. We also estimated the melting point of solid bcc Li to be within 400 and 470 K, which brackets the experimental value (453 K [48]). The melting point of RS LiD was estimated to be between 943 and 1143 K, also consistent with measurements (
 K [25]). We did not attempt to obtain accurate melting temperatures of Li [14] and LiD, as it was not the primary purpose of this work.
To explore the hypothesis of LiD formation proposed to rationalize the anomalously low sputtering yield of Li in high-flux D experiments [9], we next studied various properties of liquid Li with inserted D atoms. The calculated properties included densities, diffusion coefficients, partial pair distribution functions, partial bond angle distribution functions, geometries, and electron distributions. We observed fast liquid–solid phase transitions in liquid Li with inserted D atoms, upon quenching down from 1500 K and following the dynamics for 20 ps. These phase transitions formed nuclei of RS LiD crystals in liquid Li, which significantly lowers the diffusivity of both Li and D atoms. These first-principles Li and D diffusivities in liquid Li/LiD were used in higher-length-scale models to explain recent experiments in a companion publication [9, 39]. Overall, our study suggests strong binding of D atoms in liquid Li up to a  ratio, leading us to conclude that D will be retained in liquid Li.
The local structure of the pure liquid Li component changes significantly as the concentration of D atoms increases. D2 molecules are not stable under the conditions considered here, with the exception of a small number of D2 molecules found in the  D to Li composition, but those D2 molecules dissociated upon heating the sample further. D clusters comprised of three or more D atoms were not found under any circumstances.
Our KSDFT-MD simulations offer evidence in support of the hypothesis proposed as a result of experiments: when high-flux D ions bombard liquid Li surfaces and penetrate into the bulk, we predict that nuclei of RS LiD will form and persist in liquid Li. The dramatic decrease and strong correlation between Li and D diffusivities as the D concentration increases is indicative of strong binding between Li and D in both the solid and liquid phases. This strong binding between Li and D leading to formation of LiD explains why the observed Li sputtering yield is reduced so much in experiments. We also predict that a small fraction of D2 molecules may form within D-implanted liquid Li when the concentration of D is sufficiently high, which has not yet been observed experimentally. Overall, these simulations provide atomic-scale fingerprints of the dynamics and structure of liquid Li upon heating and upon exposure to D atoms.
Acknowledgments
The authors are grateful for discussions with Prof. A.Z. Panagiotopoulos, Prof. P.G. Debenedetti, and Dr. F.H. Stillinger. The authors thank Ms. N. Baughman and Mr. W.C. Witt for help with editing this manuscript. This work was supported by the Office of Fusion Energy Sciences, U.S. Department of Energy under Award DE-SC0008598. All computations were performed at the Terascale Infrastructure for Groundbreaking Research in Science and Engineering (TIGRESS) high performance computing center at Princeton University.