


Abstract
Samples of materials counted as perspective ones for use in the first-wall and construction elements in nuclear fusion reactors (FRs) with magnetic and inertial plasma confinement (W, Ti, Al, low-activated ferritic steel 'Eurofer' and some alloys) were irradiated in the dense plasma focus (DPF) device 'Bora' having a bank energy of ⩽5 kJ. The device generates hot dense (T ∼ 1 keV, n ∼ 1019 cm−3) deuterium plasma, powerful plasma streams (v ∼ 3 × 107 cm s−1) and fast (E ∼ 0.1 ... 1.0 MeV) deuterons of power flux densities q up to 1010 and 1012 W cm−2 correspondingly. 'Damage factor' F = q × τ0.5 ensures an opportunity to simulate radiation loads (predictable for both reactors types) by the plasma/ion streams, which have the same nature and namely those parameters as expected in the FR modules. Before and after irradiation we provided investigations of our samples by means of a number of analytical techniques. Among them we used optical and scanning electron microscopy to understand character and parameters of damageability of the surface layers of the samples. Atomic force microscopy was applied to measure roughness of the surface after irradiation. These characteristics are quite important for understanding mechanisms and values of dust production in FR that may relate to tritium retention and emergency situations in FR facilities. We also applied two new techniques. For the surface we elaborated the portable x-ray diffractometer that combines x-ray single photon detection with high spectroscopic and angular resolutions. For bulk damageability investigations we applied an x-ray microCT system where x-rays were produced by a Hamamatsu microfocus source (150 kV, 500 µA, 5 µm minimum focal spot size). The detector was a Hamamatsu CMOS flat panel coupled to a fibre optic plate under the GOS scintillator. The reconstruction of three-dimensional data was run with Cobra 7.4 and DIGIX CT software while VG Studio Max 2.1, and Amira 5.3 were used for segmentation and rendering. We have also provided numerical simulation of the fast ion beam action. The paper contains results on the investigations of modifications of the elemental contents, structure and properties of the materials.
Export citation and abstract BibTeX RIS
1. Introduction
Radiation material science plays an important role in contemporary nuclear fusion researches as the radiation resistance of materials is a key issue for the future fusion reactors (FRs). One of the areas of experiments in this direction is testing of the materials perspective for use in modern FR (see e.g. [1, 2]). The materials group two classes: first-wall (plasma facing) and construction elements. Both types must be tested under direct irradiation by hot plasma, fast ion and electron beams as well as by neutron and x-ray radiations because inside a FR the construction modules may in principle be subjected to the straight irradiation if a certain first-wall element will be lost during operation of a facility. Heat loading produced upon the FR chamber components by plasma and fast particles are counted as the most dangerous factor of risk. Maximal heat loads expected in FRs with magnetic plasma confinement (MPC) are about 104 W cm−2 whereas in reactors with inertial plasma confinement (IPC) these figures may reach up to 108 W cm−2. The dense plasma focus (DPF) device can not only ensure the fulfilment of the values of the loads much higher compared with the above-mentioned ones but it can produce it namely with the same load carriers (hot plasma and fast particles) having the same parameters expected on the plasma-facing components of the contemporary main-stream fusion devices (like ITER and NIF) [3].
2. Materials and technique
We use for testing the samples manufactured of the double-forged W (supplied by IAEA) and its alloy (W-1% La2O3), carbon-based materials (CFC and SiC), Ti and titanium alloy (Ti–18V–5Mo–3Fe (Sn, La)), Al, low-activated ferritic steel 'Eurofer' and some others that are counted as the perspective ones for FRs. As sources of streams we apply the DPF device 'Bora' operational at the Abdus Salam International Centre for Theoretical Physics, Trieste, Italy [4]. Its bank energy is ∼5 kJ. Diameters of the anode and cathode of the chamber are 30 and 50 mm. The device produces hot dense (T ∼ 1 keV, n ∼ 1019 cm−3) deuterium plasma and powerful streams of plasmas moving with a speed v ∼ 3 × 107 cm s−1 as well as beams of fast (Ed ∼ 0.1 ... 1.0 MeV) deuterons of power flux densities on the targets' surfaces q about 1010 and 1012 W cm−2 correspondingly [5–7]. Penetration depth of the 1 keV ions belonging to a hot plasma stream is a few nanometres whereas the value for the 100 keV fast deuterons is ∼1 µm [8].
A so-called 'integral damage factor' F = q × τ0.5 [9] ensures an opportunity to simulate radiation loads (predictable for FR with MPC) by the plasma/ion streams generated in DPF. It is so because the values of the power flux densities of hot plasma and fast ions q are much higher compared with those expected at the first wall of FRs of both types. It compensates the short pulse duration τ of these streams generated in a DPF compared with e.g. edge localized modes (ELMs) events periods [10]. But the characteristics of the pulses generated in DPF are quite similar to those expected in FR with IPC [11].
We placed our specimens in the cathode part of the DPF chamber on its axis at a distance from the anode equal to 3.5 cm. Construction of the holder of the samples helped us to preserve the specimens from a redeposition of its material upon the surfaces of targets. During the operation of the device we monitor current derivative in each of four capacitors by miniature magnetic probes (see typical oscilloscope traces in figure 1(a)), full discharge current by Rogowski coil, neutron and x-ray pulses by a photomultiplier tube with a scintillator (time resolution of these three techniques was ≈7 ns). Besides we measure the absolute hard x-ray and neutron yield using the Röntgen-gamma dosimeter RFT (Germany) and a silver activation counter correspondingly. Current was up to 300 kA with a rise-time 1.5 µs. Pulse durations of the deuterium plasma and fast deuterons streams were ≈100 and 10 ns correspondingly whereas FWHM of the neutron and hard x-ray pulses was 8... 10 ns (see figure 1(b)). Maximal neutron yield was ≈7 × 10⁷ neutrons/pulse whereas the overall hard x-ray flux may reach 1 J in the full solid angle. Each sample was subjected to several (2, 4, 8, 16) shots.

Figure 1. Four oscilloscope traces of dI/dt taken at each of the four capacitors of the DPF bank (a). Hard x-ray (left) and neutron (right) pulses are shown by arrows (b).
Download figure:
Standard image High-resolution imageBefore and after irradiation we provided investigations of our samples by means of a number of analytical techniques. Among them we used optical microscope (OM) and scanning electron microscope (SEM) to understand the character and parameters of damageability of the surface layers of the samples. Atomic force microscopy (AFM) was applied to measure roughness of the surface after irradiation. These characteristics are quite important for understanding mechanisms and values of dust production in FR that may relate to tritium retention and emergency situations in FR facilities. We have also applied two new techniques. For surface investigations we elaborated the portable x-ray diffractometer that combines x-ray single photon detection with high spectroscopic and angular resolutions (see figure 2).
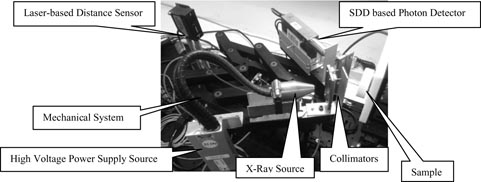
Figure 2. X-ray portable diffractometer mounted on an optical table for calibration and characterization.
Download figure:
Standard image High-resolution imageThe electromechanical system allows moving the x-ray source and the detector independently each other. The mechanic angular resolution of each stage is better than 7 × 10⁻⁵ radian, and the use of the high precision contact switches (∼1 µm) allows the determination of the home position of the stages with excellent accuracy and repeatability. A laser-based remote distance sensor allows positioning the material point of analysis with a precision of about 30 µm. All main components: x-ray source, SDD (silicon drift detector) photon detector, motors, and laser distance measurement system, are controlled from a PC.
For bulk damageability investigations we applied an x-ray microCT system [12] where x-rays were produced by a Hamamatsu microfocus source (150 kV, 500 µA, 5 µm focal spot size). The detector was a Hamamatsu CMOS flat panel coupled to a fibre optic plate under the GOS scintillator. The reconstruction of three-dimensional (3D) data was run with Cobra 7.4 (Exxim Computing Corp.) and DIGIX CT software while VG Studio Max 2.1 (Volume graphics) and Amira 5.3 (Visage Imaging) were used for segmentation and rendering.
3. Results and discussions
In figure 3 two OM images of a part of the tungsten sample DF60 are presented for the cases before (a) and after (b) irradiation provided in the following conditions of the 'Bora' device operation: initial deuterium pressure p0 = 2.75 Torr, charging voltage U0 = 12 kV, 7 irradiation shots. A very well developed cracks net (figure 3(b)) appears with the characteristic size of a 'cell' ∼100 µm. The same results have been obtained by using SEM (figure 3(c)—sample DF10, 4 shots; and figure 3(d)—sample DF11, 8 shots). This net has a subnet with the characteristic size of about a few tens of micrometres that is not so clearly pronounced. To see it better we have provided the AFM visualization of tungsten samples with the parallel measurements of its roughness appearing on the surface after irradiation. Two pictures of the specimen DF9 (4 shots) made with different magnifications are presented in figures 3(e) and (f) whereas figure 3(g) represents the AFM image of the DF11 specimen subjected to 8 shots of 'Bora'.
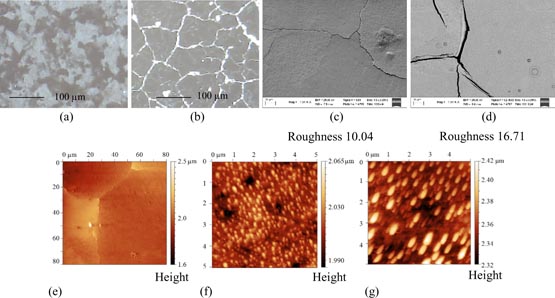
Figure 3. Optical microscopic images of the surface of the DF60 specimen of W before (a) and after (b) irradiation by 7 pulses of hot plasma and fast deuterons; SEM images of the DF10 sample after 4 shots (c) and DF11 after 8 shots (d); images of the DF9 sample after 4 shots obtained by means AFM ((e) and (f)—different magnifications) and DF11 after 8 shots (g).
Download figure:
Standard image High-resolution imageOne may see that besides crack cells of the size of a few tens of micrometres, much better seen here is the dense sub-subnet of a needled pile with individual peaks of the lateral size of about 100 nm as well as a few open pores of the size of a half of a micrometre. It is important to note that in the other experiment with the sample of tungsten DF11 that has been irradiated by 8 pulses the number of 'needles' decreased by 3 times whereas their size increased by the same ratio. Roughness of the surface also increased from the value 10.04 nm up to the figure 16.71 nm. It is quite clear that such a modification of the surface of tungsten grades is a very poor consequence for FRs: this needled pile will be easily subjected to brittle destruction with production of dust.
In figure 4 the microCT images processed by the above-mentioned techniques are presented. Streams of fast ions and hot plasma struck all the samples from the left-hand side. Figure 4(a) demonstrates the surface damages of the Al specimen: its surface became pretty shaggy from the irradiation side. Quite evidently it is a result of melting and evaporation processes taking place during the irradiation of the Al sample surface by these powerful streams of hot plasma and fast ions. In figure 4(b) an internal spot of the longitudinal size of 2 mm is seen in the below part of the Mo foil. Successive images of the sample taken at its movement inside the microCT device along the foil has shown that the lateral dimension of this spot is the same. Its size coincides with the diameter of our beam of fast deuterons generated by the DPF. So this defect (material with the lower density compared with the surrounding substance) is very likely produced in the internal part of the foil as a result of an action of a shock wave (SW) generated by the powerful beam of fast ions that is followed by an appearance of the unloading (rarefaction) wave.
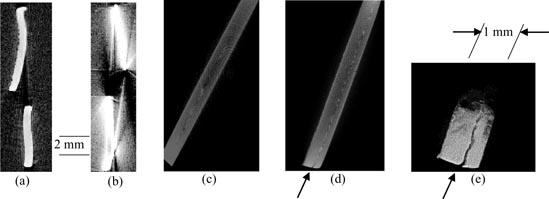
Figure 4. X-ray microCT images: (a) 2 cross-sections of the Al foil sample (10 × 10 × 0.5 mm3) before (below) and after (above) irradiation; (b) 2 cross-sections of a sample of a Mo foil (10 × 10 × 0.1 mm3) taken before (above) and after (below) irradiation; (c), (d), (e): cross-sections of the Ti alloy foil (13 × 13 × 1 mm3) before (c) and after ((d) and (e)—with higher magnification) irradiation (arrows show a crack produced at the butt end by a SW).
Download figure:
Standard image High-resolution imageWe provided numerical modelling of the process of generation of the SW by the beam of fast deuterons and its penetration through the foil. We used an upgraded quasi-two-dimensional hydrodynamic model, developed previously for calculation of the parameters of secondary plasma, generated due to interaction of intense ion and plasma streams with solid targets placed in DPF [13].
In this case the equations of a cold solid state have been added to the model according to the books [8, 13]. Pulse shape of the ion beam power flux density was taken as a sine curve: q(t) = q0 sin(πt/τ). The mean-free path of deuterons having energy Ed = 100 keV in molybdenum was d = 1 µm [8]. Results of numerical simulations are presented in table 1.
Table 1. Results of numerical simulation of shock and unloading (rarefaction) wave in the Mo sample.
| q0 (W cm−2) | τ (ns) | T (eV) | Z | L (µm) | PSW (GPa) | PA (GPa) | PUW (GPa) |
|---|---|---|---|---|---|---|---|
| 1011 | 10 | 20 | 6 | 2 | 30 | 30 | −20 |
In table 1 T, Z—plasma temperature and average charge of ions at the moment of the maximal intensity of the ion beam; L—thickness of the evaporated layer of molybdenum to the end of the ion beam action, PSW—amplitude of the SW at the end of the action of the ion beam, PUW—maximal negative pressure in the unloading (rarefaction) wave, PA—ablation pressure in plasma calculated by the formula:
where ρ0 is the density of molybdenum. In figure 5 one may see the pressure distribution inside the foil at different moments of time counted from the moment of the beginning of the ion beam action.

Figure 5. Pressure distribution within the target at different moments of time: 1–10 ns after the start of the ion beam action, 2 (15 ns)—SW compression, 3 (25 ns) and 4 (35 ns)—unloading (rarefaction) wave propagating inside the sample after a SW pressure relief.
Download figure:
Standard image High-resolution imageThe tensile stress is about 20 GPa. It is gradually increased with penetration of the unloading wave to the irradiated surface of the target. It is qualitatively agreed with the description of the unloading wave of the non-strong SW having a triangular shape [14]. Its maximal value is realized in the region 20–30 µm away from the irradiated surface. Our maximal value of the power flux density of the beam of fast deuterons can be an order of magnitude higher compared with the figure (1011 W cm−2) used in the modelling. Short-time strength of Mo σB depends on its initial structure and the samples' preprocessing. It can be within the limits 0.5–1.0 GPa [15]. Treatment of samples by penetration radiation may only decrease the above figure [16]. It explains the effect observed.
Comparing figures 4(c), (d) and (e) one may see the results of the irradiation action of the powerful fast ion stream (q ∼ 1012 W cm−2) upon the target made of the above-mentioned titanium alloy foil manufactured with the use of a rolling procedure. The formidable enhancement of the internal primary structure defects produced during the preparation (rolling) of the foil and an appearance of a crack at its butt are observed in the sample after its irradiation in the 'Bora' device. It results again from the SW action produced and penetrated the sample after the action of the stream of fast ions generating high volumetric energy density within it.
For elemental and structure analysis of the irradiated titanium alloy and tungsten grade we used x-ray diffractometer. Results are in figure 6, tables 2 and 3 and in figure 7, tables 4 and 5.
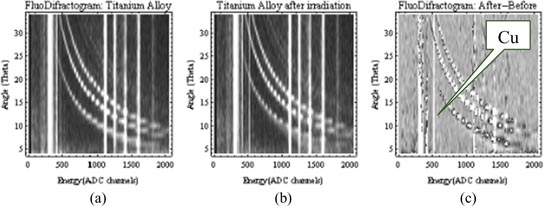
Figure 6. X-ray energy/diffraction angle analysis of the Ti alloy: (a) before irradiation; (b) after irradiation; and (c) subtraction of (a) from (b).
Download figure:
Standard image High-resolution image
Figure 7. X-ray energy/diffraction angle analysis of W sample: (a) before and (b) after irradiation.
Download figure:
Standard image High-resolution image
Table 2. X-ray fluorescent lines observed in the Ti alloy sample.
| Element candidate | Our XRF lines (keV) | Element candidate XRF lines (keV) | Difference (keV) | Relative intensities | Notes |
|---|---|---|---|---|---|
| Ar | 2.907 | 2.957 | −0.05 | W (weak) | |
| Ti | 4.572 | 4.510 | 0.062 | S (strong) | |
| V | 4.997 | 4.952 | 0.045 | S | |
| Cr | 5.468 | 5.415 | 0.053 | M (medium) | |
| Cr(Kβ1) | 6.081 | 5.946 | 0.135 | M | |
| Mn(Kα1,2) | 6.081 | 5.898 | 0.183 | W | |
| Fe | 6.458 | 6.403 | 0.055 | MW | |
| Fe(Kβ1) | 7.086 | 7.058 | 0.028 | W | |
| Ni | 7.511 | 7.478 | 0.033 | W | |
| Cu(Kα1) | 8.08 | 8.05 | 0.03 | VW | After irradiation only |
| Ni(Kβ1) | 8.328 | 8.264 | 0.064 | W | |
| Cu (Kβ1) | 8.96 | 8.90 | 0.06 | VW | After irradiation only |
| Mo | 17.473 | 17.479 | −0.006 | S | |
| Mo(Kβ1) | 19.641 | 19.608 | 0.033 | M | |
| Ag | 22.155 | 22.162 | −0.007 | M | Anode material |
| Sn | 25.219 | 25.271 | −0.052 | M |
Table 3. The inter-planar distances observed before and after irradiation of the Ti alloy.
| Inter-planar distances d (Å) before irradiation | Relative intensities | After irradiation (Å) | Differences (Å) |
|---|---|---|---|
| 1.27 | Strong | 1.25 | −0.02 |
| 1.55 | Strong | 1.52 | −0.03 |
| 2.16 | Strong | 2.15 | −0.01 |
| 0.84 | Very weak | 0.83 | −0.01 |
| 0.90 | Very weak | 0.90 | 0.00 |
| 0.98 | Very weak | 0.97 | −0.01 |
Table 4. X-ray fluorescent lines observed before and after irradiation in the W specimen.
| Element candidate | Our XRF lines (keV) | Element XRF lines (keV) | Relative candidate | Notes intensities |
|---|---|---|---|---|
| S (Kβ1) | 3.14 | 2.464 | S (strong) | |
| Fe | 6.45 | 6.404 | W (weak) | Only after irradiation |
| Ni | 7.45 (7.49) | 7.478 | S | Only after irradiation |
| W (Lα1) | 8.50 | 8.397 | VS | |
| W (Lβ1) | 9.85 | 9.672 | VS | |
| W (Lγ1) | 11.34 | 11.286 | VS | |
| Ag | 22.20 | 22.162 | W | Anode material |
| Ag | 25.00 | 24.94 | W | Anode material |
Table 5. The inter-planar distances observed before and after irradiation of W grades.
| Inter-planar distances d (Å) before irradiation | Relative intensities | After irradiation (Å) | Differences (Å) |
|---|---|---|---|
| 2.12 | W | 2.19 | +0.07 |
| 1.51 | S | 1.55 | +0.04 |
| 1.23 | S | 1.25 | +0.02 |
| 0.97 | W | 0.97 | 0 |
| 0.88 | W | 0.90 | +0.02 |
| 0.81 | W | 0.82 | +0.01 |
| 0.77 | W | 0.78 | +0.01 |
| 0.73 | W | 0.73 | 0 |
| 0.66 | W | 0.66 | 0 |
| 0.60 | W | 0.61 | +0.01 |
| VVW | 0.57 | ||
| 0.53 | VW | 0.53 | 0 |
| 0.50 | VW | 0.50 | 0 |
| 0.44 | VW | 0.44 | 0 |
| 0.38 | VVW | 0.38 | 0 |
In figures 6 and 7 the vertical lines correspond to fluorescent photons (XRF) while the curved lines correspond to photons that are subjected to Bragg reflections. Each curved line corresponds to the inter-planar distance of the reflective planes in the crystalline structure.
One may clearly see appearance of new lines belonging to Cu (evaporated from the DPF chamber walls by the irradiations and deposited on the surface of the specimen) and small negative changes in the values of the Bragg angles of x-ray diffraction from the sample's lattice.
Results on the irradiated tungsten grade differ. Namely, besides new lines belonging to iron and nickel (they enter into composition of our DPF chamber) the inter-planar distances after irradiation of the sample have mainly positive values, as it is seen from table 5. This contrasts with the results of the Ti alloy, which shows negative values as shown in table 3.
The observed dissimilar changes in the lattice parameters of the irradiated Ti alloy and W specimens demand a more detailed investigation. However, at this stage it is possible to suppose that an increase in these parameters in tungsten very likely results from implantation of deuterons inside the specimen. On the contrary, a certain decrease of them in titanium happens because this material being a very good getter absorbs various impurities that escape from the sample during our very powerful heat loads applied to it at the irradiation.
Acknowledgments
The authors are grateful to Dr L. Casalis (SISSA-Elettra NanoInnovation Laboratory, Synchrotron, Trieste) for her help in the AFM measurements and to Dr A.F. Waheed (AEA, NRC, Material Division, Metallurgical Department, Egypt) for his assistance with Al and Mo samples. This work was supported by the International Atomic Energy Agency CRP grants numbers RC-16932, RC-16954, RC-16955, RC-16956, RC-16960, and RC-17167.