


Abstract
The modelling of a controlled tungsten dust injection experiment in TEXTOR by the dust dynamics code MIGRAINe is reported. The code, in addition to the standard dust–plasma interaction processes, also encompasses major mechanical aspects of dust–surface collisions. The use of analytical expressions for the restitution coefficients as functions of the dust radius and impact velocity allows us to account for the sticking and rebound phenomena that define which parts of the dust size distribution can migrate efficiently. The experiment provided unambiguous evidence of long-distance dust migration; artificially introduced tungsten dust particles were collected 120° toroidally away from the injection point, but also a selectivity in the permissible size of transported grains was observed. The main experimental results are reproduced by modelling.
Export citation and abstract BibTeX RIS
1. Introduction
Over the last decade, the importance of dust formation and transport in tokamaks has been discussed intensively and progress on both experimental and modelling efforts has been reported in recent extensive reviews [1, 2]. While various novel methods have been suggested for in situ dust detection (see e.g. [2–4]), camera observations remain a principal tool for dust dynamics studies. Trajectories of intrinsic as well as artificially introduced calibrated dust have been successfully monitored, starting with the pioneering work in DIII-D and NSTX [1, 2, 5], and have constituted the main data used for the benchmarking of dust transport codes [1, 6]. Optical imaging has also provided evidence of long-distance carbon (C) dust transport, at least 90° toroidally, in DIII-D experiments, although a detailed comparison with modelling was not attempted due to the lack of 3D dust trajectory tracing capability [2, 7].
It has been recognized in both experiments and modelling that collisions of the dust grains with plasma-facing components (PFCs) are an unavoidable part of dust dynamics in tokamaks [1–4]. Since one of the primary concerns is the integrity of the wall and the PFCs, particular attention has been paid to destructive high-velocity impacts, from about 1 km s−1 and above, see [1, 4] and references therein. Meanwhile, though grains might acquire such speeds under some conditions, velocities from few to 100s m s−1 are more typical of dust dynamics in scrape-off layer (SOL) plasmas [1, 4, 8–11].
For micrometre grains, the main mechanical characteristics in such an impact velocity range are the possibility of sticking, energy losses due to plastic deformation, dissipation due to the irreversible work of adhesive forces and friction and the strong effect of roughness at multiple scale lengths. Contact mechanics models in this regime show that all these processes depend strongly on the projectile's velocity and size, as well as on the material properties of both the projectile and the surface [12, 13]. This implies that these phenomena play a central role in selecting which parts of the dust size distribution can migrate further upon one or multiple collisions.
In this work, we report on the modelling of a controlled tungsten (W) dust injection experiment accomplished in a recent campaign in the limiter tokamak TEXTOR. Micrometre-sized W particles were injected from the top of the vessel and collected by silicon (Si) surfaces located in the equatorial plane, 120° toroidally away from the injection point. The controlled nature of this experiment imposes strong restrictions on the terminal points of the trajectories and hence constitutes a favourable ground for testing the physics of dust–surface collisions and long-distance dust migration. A comparison is carried out by means of the newly developed dust dynamics code MIGRAINe (MIgration of GRAINs in fusion devices), which in addition to the standard dust–plasma interaction processes [8–11] also takes into account the mechanical properties of dust–wall collisions. The latter is implemented via restitution coefficients, which are functions of both impact velocity and size and follow the model for the bouncing of elastic–perfectly plastic adhesive spheres developed by Thornton and Ning [14]. The surface roughness on nano- and micrometre scales is introduced via randomization of the adhesive sticking velocity and the surface normal, respectively. Modelling demonstrates that for W dust to migrate a third of the torus, multiple collisions with the INCONEL wall are necessary and that these collisions determine which subpopulation of the injected dust eventually reaches the collector.
2. Experiment
The experiments were performed in the limiter tokamak TEXTOR of circular cross-section with plasma major and minor radii of 175 cm and 46 cm, respectively. Dust was injected in discharges with 2.25 T toroidal magnetic field directed counter-clockwise when looking from above, 350 kA plasma current directed clockwise and line-averaged plasma density of 3.5 × 10¹⁹ m−3 [15]. All discharges were NBI-heated with a total power of 1.0 MW and run in L-mode [16]. The discharges were nearly identical to those of previous dedicated dust campaigns in TEXTOR [5]. It was clearly demonstrated in [5] that in the case of W dust, even of a larger amount than reported here, injection had a rather limited and only transient effect on core plasma parameters.
W dust was injected through a port located at the top of the vessel and collected at the outer mid-plane 120° away toroidally, as shown in figure 2 of [5]. A dust dropper allowed injections of a controlled amount of dust with known speed; free-falling from the dropper, the particles reached a velocity of 1.3 m s−1 at the vessel wall position. The dropper was activated for 0.2–0.9 s during the discharge flat-top with a dropping rate of about 0.5 mg s−1. A similar W dust was used in previous TEXTOR and MAST experiments [5, 6]. Its size distribution ranged up to 5 µm with a maximum at about 1.5 µm. However, most of the injected dust agglomerated into clusters of larger dimensions, see figure 1(a), with the maximum defined by the mesh size—40 µm.
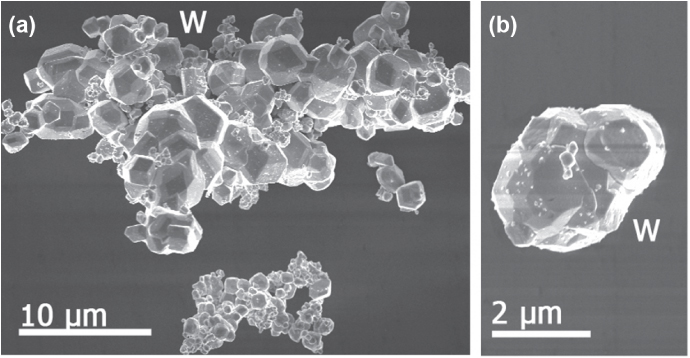
Figure 1. (a) Agglomerated W dust as passed through the injector. (b) Example of a collected dust particle.
Download figure:
Standard image High-resolution imageThe collector probe system used is the same as described in [17, 18]. A cylindrical probe head carried collectors, cut from polished Si wafers, in six rectangular slots, figure 2(a). A molybdenum shield with two opposite slit apertures covered the probe head, as shown in figure 2(b), in order to provide protection of the collectors from the plasma, to enable exposure of only two of them in either toroidal or poloidal direction and to define plasma-exposed areas. The slits restricted the sample area exposed to the plasma to 2.1 cm2 on each collector. The shield could be rotated by 90° to have the slits open either in toroidal (horizontal) or poloidal (vertical) direction; the latter case is shown in figure 2(b).
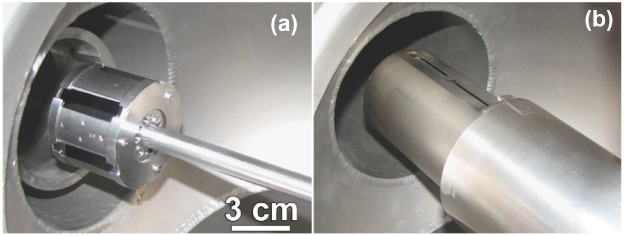
Figure 2. The collector probe head with installed Si samples at the entrance of the TEXTOR port; (a) without the protecting shield, (b) with the protecting shield. The shield has two opposite slits, whose orientation can be either vertical (as shown here) or horizontal. The probe head can revolve inside the shield to allow exposure of one sample pair at a time only.
Download figure:
Standard image High-resolution imageIn total, twelve collectors were installed in two cylinders, as shown in figure 2(a). One cylinder was exposed with slits open only in the poloidal direction (#118328–32, total amount of injected dust 1.6 ± 0.8 mg), the other was exposed only toroidally (#118332–43, total amount of injected dust 0.7 ± 0.3 mg). The about 1 mm gap between the shield and the collector surfaces made it possible for the grazing particle flux to penetrate under the shield and be spread over the adjacent collectors.
The analysis of the Si collectors was carried out by energy-dispersive x-ray spectroscopy assisted scanning electron microscopy. W particles were counted on each collector in several randomly selected positions to yield the number of particles collected in either direction. On the collectors exposed in the poloidal direction (1.5 ± 0.2) × 103 particles of typical 1–1.5 µm radius were counted (with no significant difference between upper and lower collectors), corresponding to 0.01% of the injected dust mass, see figure 1(b). No W dust was observed on the toroidally exposed collectors, which corresponds statistically to less than 200 collected particles. A few severely molten particles were observed (less drastic deviations from the original morphology of the injected dust could not be assessed).
The results of the surface analysis, which we aim to reproduce by numerical modelling here, can be summarized as follows: (i) no dust detected on the collectors opened in the toroidal direction, (ii) a fraction of the injected dust detected on the collectors opened in the poloidal direction, (iii) size 'selectivity'—out of the wide size distribution of the injected dust, the majority of the collected particles had radii of 1–1.5 µm; no dust with radius <0.5 µm was detected though some grains had radii larger than 1.5 µm.
In addition, the atomic deposition of W in the SOL at 4 cm outside the last closed flux surface (LCFS) was measured by Rutherford backscattering spectrometry on the toroidally exposed Si collector surfaces. The deposition rates in discharges with W dust injection and immediately after were found to be 2.8 × 10¹² W cm−2 s−1 and 1.3 × 10¹² W cm−2 s−1, respectively. As the ambient W atomic deposition flux prior to W dust injection was not measured and the size distribution of the injected dust was not characterized precisely enough, no quantitative comparison could be made between the atomic deposition flux and the simulated vaporization rates following dust injection. However, it is a significant result that the atomic deposition rate in the discharges immediately after the discharges with dust injection was still of the same order of magnitude as in the discharges with dust injection.
3. The MIGRAINe code and the modelling of dust–surface collisions
The MIGRAINe code solves the coupled dust dynamics equations and is based on four modelling 'blocks'; dust charging, dust heating and mass ablation, equation of motion and dust–surface collisions. The version of the code employed in this work has its first three blocks in a form essentially identical to the DUSTT code [8, 9] to which we refer for exact expressions. Hence, below we shall focus on the details of the dust–PFC collisions.
Dust dynamics codes [8–11] have mostly focused on dust–plasma interaction and less attention has been paid to the details of the dust–surface collisions. In [8, 9], some aspects of dust–surface collisions were accounted for by introducing constant restitution coefficients for the mass, bulk temperature and velocity of the dust grain, but also constant probabilities for sticking and diffuse reflection. However, such a phenomenological description ignores established dependences of the impact energy loss and sticking processes on the size and velocity of the grain. In [19], the finite element multi-physics code LS-DYNA was employed for the study of dust–surface collisions. A limited number of simulations were carried out in the high impact energy regime (projectile velocity >100 m s−1) characterized by fracture and partial destruction of the projectile and the target.
The MIGRAINe code focuses on the analytical description of the typical low impact energy regime, where it can be assumed that the spherical grain retains its morphological characteristics after the impact. In order to account for the dominant physical aspects of the impacts, the dust–surface collision 'block' incorporates two deterministic models for the normal and tangential components of the oblique impact and two probabilistic models for the effects of micrometre-scale and nano-scale roughness. Apart from the specific assumptions of each model, a number of generic assumptions are necessary for the formulation of the problem: (I) External forces are neglected during the loading and unloading stages of the collision, since their work on the elastic displacement plus plastic deformation time scale is negligible compared with the impact energy of the dust grain. (II) The stresses generated in the impact are well below the fracture strength of the material. (III) Since rotational dust dynamics are not treated in the present version of the code, dust grains are not spinning prior to, during or after the impact. (IV) Heat exchange between the dust grain and the wall is not taken into account and therefore the dust temperature is unaltered during collision events. (V) Even though plastic work is considered and plastic deformations will tend to flatten out the grain, dust is assumed spherical with its radius unaltered upon rebounding.
Owing to the dissipative processes involved in the impact, the rebound velocity is always less than the impact velocity. The energy losses are quantified with the aid of a normal restitution coefficient
 and a tangential restitution coefficient
 . Note that the impact angle is measured from the surface normal (see figure 3 for a sketch of the impact geometry and the notation).
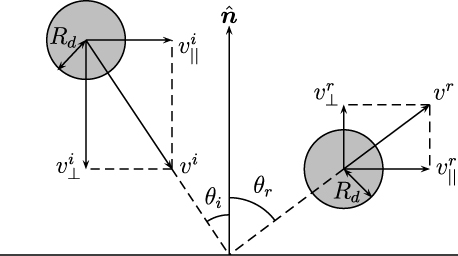
Figure 3. Sketch of the impact geometry. Here, i corresponds to impact quantities and r to rebound quantities.
Download figure:
Standard image High-resolution image3.1. Normal restitution coefficient
When plastic deformation is involved, continuum mechanics approaches do not yield closed form solutions for the stress fields. As a result, a plethora of theoretical models is available in the literature, each employing different approximations for the description and the onset of the plastic phase [20–26]. The MIGRAINe code implements the Thornton and Ning (T&N) model [14] for the normal impact of elastic–perfectly plastic adhesive spheres owing to its physical transparency, the incorporation of adhesion that is important for micrometre-sized grains and the simple analytical expression for the normal restitution coefficient.
The main assumptions of the T&N model are that adhesion-induced plastic deformation is negligible, while dissipation by plastic deformation and dissipation by interface adhesion are additive quantities. Consequently, the normal impact of an elastic–perfectly plastic adhesive sphere can be decomposed into the impact of an adhesive elastic sphere characterized by a restitution coefficient e⊥,adh and the impact of an elastic–perfectly plastic non-adhesive sphere characterized by a restitution coefficient e⊥,pl with the total restitution coefficient given by
 .
.
Elastic adhesion is modelled according to the Johnson–Kendall–Roberts (JKR) theory [27]. Adhesion forces are only considered inside the area of contact, the introduction of surface energy increases the equilibrium contact radius and the contact pressure follows a reduced modified Hertzian profile owing to negative adhesive loads. In the analysis of the energetics of the process the adhesive sticking velocity naturally arises, defined by

This critical velocity expresses the fact that for
 the dust impact energy is so low that adhesion forces are strong enough to make the grain stick to the wall, whereas for
 the collision is inelastic even when ignoring plastic deformation owing to the irreversible work
 of the adhesion forces. In the above
 with νi the Poisson ratios and Ei Young's moduli of the colliding bodies, ρd the mass density of the dust grain, and Γ the total surface energy per unit area given by
 with γi the surface energy per unit area of each colliding body.
Elastic–perfectly plastic impacts are treated by assuming that the loading stage consists of an elastic phase during which the contact pressure distribution has a Hertzian profile followed by a plastic phase during which the contact pressure distribution has a Hertzian profile truncated at the limiting contact pressure py. The unloading stage is assumed to be elastic but with a curvature 1/Rp, where Rp > Rd, due to the permanent deformation of the contact surface. Notice that py is strongly related to the yield strength σy of the material, i.e. the stress at which the onset of plastic deformation occurs. Typically, py = 1.6σy or py = 2.8σy is assumed in the literature [28–30], but even higher values have been reported [31]. This ambiguity stems from the existence of an elasto-plastic phase for central contact pressures in the range {1.6σy , 2.8σy} [12, 13]. This phase lies in the transition region from fully elastic to fully plastic flow and is not accounted for in the T&N model. In the analysis of the energetics of the process the yield velocity vy naturally arises, defined by
This critical velocity expresses the fact that for
 the dust impact energy is high enough to cause plastic deformation and irreversible plastic work, whereas for
 the collision is totally elastic when neglecting adhesion.
By superposition one ends up with an expression for the general case of elastic–perfectly plastic adhesive spheres. The final formula will strongly depend on the ratio between the adhesive sticking velocity and the yield velocity. Let us first define the sticking velocity
 as the velocity below which the total normal restitution coefficient is zero, e⊥ = 0. When
 , plastic work affects sticking and consequently the sticking velocity is generally larger than the adhesive sticking velocity
 . In contrast, when
 , plastic work does not affect sticking and
 .
.
It is more practical to distinguish between these two regimes by defining the dust threshold radius Rthres, i.e. the radius for which the adhesive sticking velocity and the yield velocity are equal. Combining (1) and (2) we end up with

For metallic dust impinging on a metal surface typical values are Rthres ∼ 1–50 µm. Therefore, both regimes are of interest for tokamak applications.
(I) The Rd ⩾ Rthres regime is characterized by
. It has been treated by Thornton and Ning [14]:
(II) The Rd < Rthres regime is characterized by
. Extending the T&N model we have
with the sticking velocity
given by
 , where w0 is the unique real solution of the equation
 in the interval 0 < w0 ⩽ 1. The ratio of the sticking velocity to the adhesive sticking velocity for various values of the ratio
 is plotted in figure 4.
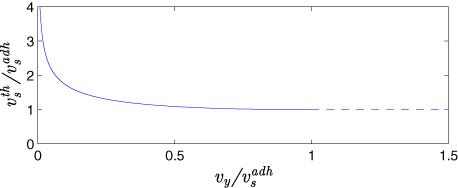
Figure 4. Ratio of the sticking velocity to the adhesive sticking velocity for various values of the ratio
.
Download figure:
Standard image High-resolution image3.2. Tangential restitution coefficient
Tangential interactions are more complicated. The contact area changes during the impact leading to a continuous redistribution of stresses; the tangential displacements and deformations of the impacting bodies may vary throughout the instantaneous contact area leading to scenarios where one part is sliding while simultaneously another part is sticking, but the tangential compliance also has a strong dependence on the loading history [32–34].
A useful approximation would be to neglect elastic displacements and plastic deformations by employing rigid body theory in the treatment of the tangential component of the impact. Within such an analysis, there are two possible regimes, rolling or sliding. Typically, the rolling regime is realized for near normal angles and the sliding regime for more oblique angles [35]. In what follows, we shall assume that we are always in the sliding regime, where a simple analytical expression for e|| can be found.
The tangential restitution coefficient can be expressed as a function of the normal restitution coefficient with the aid of the impulse ratio
 , where τimp is the impact duration and F|| , F⊥ are the tangential and normal components of the total contact forces, respectively [35–38]. Combined with Newton's second law this yields e|| = 1 − f(1 + e⊥) cot θi. Generally, the impulse ratio is different from the Coulomb friction coefficient μ. However, in the sliding regime f = μ and overall
 .
.
This simplified analysis is indicative of the coupling between the normal and tangential directions during the impact. As aforementioned, the T&N model treats purely normal impacts, thus one would anticipate that for oblique impacts
 . However, finite element simulations of oblique elastic and elastic–plastic impacts [37] have revealed that (i) within the rolling regime
 remains constant and equal to
 , (ii) within the sliding regime
remains constant with a value slightly lower than
. Hence, in this work we shall assume that
, (ii) within the sliding regime
remains constant with a value slightly lower than
. Hence, in this work we shall assume that
 for all impact angles.
It is important to note that during oblique impacts, since the tangential impulse is non-zero, the grain will inevitably acquire a rebound angular velocity even if it impinges without an initial spin [37, 38]. Since rotational dust dynamics are not treated in the present version of the MIGRAINe code, it is more self-consistent to assume a frictionless contact, μ = 0. In this case the rebounding grain will not spin and

3.3. Micrometre-scale roughness
Engineered surfaces are not smooth on the micrometre scale, unless designed for dedicated applications. Micrometre-scale roughness of the wall refers to length scales larger than the contact radius of the impacts and will therefore not affect the micro-physics of dust–wall collisions as defined by the sticking velocity, the yield velocity and the friction coefficient. However, it will have a major effect on the impact geometry by determining the impact angle.
Micrometre-scale roughness is modelled here by assuming that the wall is dispersed with random triangular corrugations. The geometry of the problem is illustrated in figure 5(a). At the impact point, let
 be the unit vector normal to the smooth surface and
 be the unit vector tangential to the smooth surface in the impact plane. We define
 to be the unit vector normal to the rough surface,
 , where both the polar angle φ and the azimuthal angle χ are random variables. It is further assumed that there is no preferred direction in the smooth surface plane and hence χ follows a uniform probability distribution in the interval [0, 2π].

Figure 5. (a) Geometry defining the random variables φ and χ. (b) Impact plane as defined after the random choice of χ; the dashed line corresponds to the smooth surface.
Download figure:
Standard image High-resolution imageIn the normal plane to the smooth surface, defined by the random choice of azimuthal angle χ, as illustrated in figure 5(b), we assume the presence of a right triangle of base with constant length d and height with random length h following a zero-mean Gaussian probability distribution of standard deviation σsurf. In this case, the rough surface lies on the hypotenuse and tan φ will follow a zero-mean Gaussian distribution of standard deviation σsurf/d. Since only the absolute value of φ is of interest, it is more formal to say that tan φ follows a half-normal distribution of standard deviation
 . Overall,

Clearly, this treatment of micrometre-scale roughness is equivalent to randomizing the wall normal vector.
3.4. Sub-micrometre-scale roughness
Real surfaces are never smooth on the nano-scale. Nano-scale roughness cannot modify the impact geometry but can play an important role in adhesion, since, depending on the stiffness of the material, it can lead to a significant reduction of the contact area between the colliding bodies and consequently a strong reduction in the adhesive sticking velocity [39]. It has long been realized that roughness hardly affects the adhesion of materials with very low elastic moduli (e.g. for rubber E ∼ 0.01 GPa), while it can reduce the adhesion of stiff materials by orders of magnitude (e.g. for tungsten E ∼ 400 GPa and for INCONEL E ∼ 200 GPa) [39].
Mathematical descriptions of nano-roughness typically model the rough surface as an average smooth surface plane dispersed with a random number of hemispherical asperities of the same radius rasp (≪Rd) [40–43]. The centre of these asperities is offset from the smooth plane in a probabilistic manner, such that the asperity heights follow a Gaussian zero-mean distribution with a standard deviation σasp [41]. Within this framework, the application of the JKR theory of elastic adhesion [41] has demonstrated that the effect of roughness on adhesion can be expressed by the dimensionless parameter
 . This adhesion parameter represents the statistically averaged competition between the compressive forces exerted by the higher asperities that tend to detach the colliding bodies and the adhesive forces exerted by the lower asperities that tend to stick the colliding bodies. For Θ ≫ 1 (large σasp) adhesion is significantly inhibited and the adhesive sticking velocity
 is significantly reduced even by orders of magnitude, whereas for Θ≪1 (small σasp)
approaches its theoretical value for smooth surfaces, given by (1).
is significantly reduced even by orders of magnitude, whereas for Θ≪1 (small σasp)
approaches its theoretical value for smooth surfaces, given by (1).
In the relevant scenario of tungsten dust grains impinging on an INCONEL wall, the E* modulus is large enough to guarantee that Θ ≫ 1 even for relatively low roughness. In this light, nano-scale roughness is accounted for in the MIGRAINe code by assuming that the actual adhesive sticking velocity is a random variable following a uniform probability distribution in the interval between zero and its theoretical value for smooth surfaces, i.e.

3.5. Implementation of the model for impacts of W dust on an INCONEL wall
Table 1 presents the numerical values of the material properties that are necessary for the calculation of the normal restitution coefficient for W dust impinging on an INCONEL wall. As already mentioned, there is no consensus in the literature for the value of the limiting contact pressure py. In what follows, we shall assume py = 2.8σy as our reference value, but we shall also explore the sensitivity of our results to py.
Table 1. Mechanical properties relevant for impacts of W projectiles on an INCONEL target.
| Material | E (GPa) | ν | ρd (g cm−3) | σy (MPa) | γ (J m−2) |
|---|---|---|---|---|---|
| W | 390 | 0.29 | 19.3 | 800 | 4.5 |
| INCONEL | 205 | 0.31 | ∼1 |
In figure 6(a) the dependence of the normal restitution coefficient on the normal impact velocity for different dust sizes is shown. For py = 2.8σy, Rd < Rthres ∼ 10 µm and therefore we are in regime II,
. By definition, the origin of the curves is located at the sticking velocity. The sticking velocity is nearly inversely proportional to the dust radius, whereas the yield velocity is independent of the dust size. For normal velocities much larger than the yield velocity, the curves collapse on each other, since the main mechanism of energy loss is plastic work, whose effect on the restitution coefficient is independent of size. On the other hand, for normal velocities smaller than or of the order of the yield velocity, the curves strongly diverge, since energy dissipation is mainly due to adhesive work, which strongly depends on size.

Figure 6. (a) Dependence of the normal restitution coefficient on the normal impact velocity for various projectile sizes (py = 2.8σy). (b) Dependence of the normal restitution coefficient on the normal impact velocity for various limiting contact pressures (Rd = 1 µm).
Download figure:
Standard image High-resolution imageIn figure 6(b) the dependence of the normal restitution coefficient on the normal impact velocity for a 1 µm radius particle and for different values of the limiting contact pressure is shown. According to (2) the yield velocity scales as py5/2, recalling that vy is the threshold velocity at which plastic work occurs, the higher the value of py the less energy is lost in the impact. For py = 1.6σy, 2.8σy and 4σy the threshold radii are Rthres = 50 µm, 10 µm and 3 µm, respectively. Therefore, we are still in regime II, where
, this is demonstrated by the inverse dependence of the sticking velocity on the limiting pressure.
Finally, figure 7 shows the normal restitution coefficient for various values of the adhesive sticking velocity lower than the theoretical limit, as required by nano-roughness. As anticipated, e⊥ tends to unity as
approaches zero, since due to the absence of adhesive work the collision will be nearly elastic in the low velocity limit. Notice also that the probabilistic reduction of
according to (8) is responsible for a transition from the
 to the
 regime.

Figure 7. Dependence of the normal restitution coefficient on the normal impact velocity for various adhesive sticking velocities below the theoretical value (Rd = 1 µm and py = 2.8σy).
Download figure:
Standard image High-resolution imageDue to the lack of relevant data on dust–surface collisions, there are no means of calibrating the theoretical restitution coefficient curves against experimental evidence. To our knowledge, the only empirical study of dust impacts for tokamak-relevant materials was reported in [44], where micrometric particles were accelerated by means of a modified pellet injection system and their sticking velocity
was determined. In that work, abnormally high values for the sticking velocity in excess of 40 m s−1 were presented in the case of W grains of size Rd < 8 µm impacting stainless steel (SS) targets (note that the mechanical properties of SS and INCONEL are very close). Such values are in clear contradiction with all theoretical predictions as well as with experimental data on micrometre particle impacts. Additional experiments have revealed that this overestimation likely occurs due to the agglomeration of smaller and larger grains in the dust mixture inside the sabot, nullifying the correlation between the sabot speed and the actual impact velocity of the smaller grains.
4. Results
Before proceeding to the results, we briefly describe the plasma profiles which are an input to the code. As will be shown below, dust does not survive inside the LCFS and the major parts of the grains' trajectories are confined to the region near the wall. The main diagnostics available are probing the core and edge plasma and basically no data are available for minor radii larger than 48–49 cm. We hence construct our profiles combining the available data and models for TEXTOR SOL plasmas as follows.
- (i)
- (ii)In the SOL, the plasma flow velocity is divided into its parallel and perpendicular to the magnetic field components. The perpendicular component is approximated by the poloidal E × B drift velocity, while the parallel flow is directed towards the closest ALT limiter surface and its velocity varies poloidally from zero at the so-called stagnation point, diametrically opposite to the limiter position in the poloidal cross-section, to values comparable to the sound speed near the limiter, as detailed by figure 6(c) of [45]. In our runs, following figure 8, it would imply that the flow varies from zero at the point 'S' to 100 km s−1 at the LCFS near the point 'L' (see figure caption for definitions). Since the radial variations of the parallel flow velocity are not well known, we leave its decay length as a free parameter, leading to a value at the injection point varying around 10 km s−1.
- (iii)
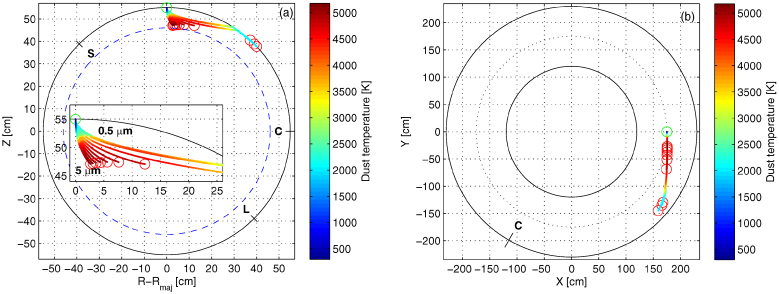
Figure 8. Trajectories for initial dust radii from 0.5 to 5 µm, colour-coded by temperature (Tmelt = 3695 K). The red circles indicate the end of the trajectories. (a) Poloidal projection, with the limiter ('L'), stagnation point ('S'), injection (green circle) and collector ('C') positions indicated. (b) Toroidal projection (the position of the collector is marked). Here, ne = 8 × 10¹⁸ m−3, Te = 50 eV and Ti = 70 eV at the LCFS (dashed line) and the e-folding lengths are 5 cm for ne and Te, and 3 cm for Ti. In the vicinity of the injection point, the ion flow velocity is 10 km s−1 near the wall and 15 km s−1 at the LCFS. The limiting contact pressure is py = 2.8σy.
Download figure:
Standard image High-resolution imageThe exact values of ne, Te and Ti at the LCFS and their decay lengths, as well as the values of the toroidal ion flow velocity at the LCFS and the wall, are provided in the figure captions. The sensitivity of the results to variations of the assumed plasma parameters is explored and discussed in the following subsection.
4.1. Dust migration
Due to the wide spread in size of the injected dust, trajectories of grains with various radii, all starting from the injection point with a downward velocity of 1.3 m s−1, are studied. To gain an insight on the overall dynamics we first consider the case of an ideal smooth wall, i.e. without introducing the effect of roughness.
The trajectories for different initial Rd are shown in figure 8. The motion is mainly determined by the toroidal ion drag and the centrifugal effect due to the curvature of the ion flow—as discussed in the previous studies [9, 10]. The overall 1/Rd scaling of the acceleration due to the ion drag force induces an initial selection process on the dust size; particles with initial radii above some critical value Rc reach the hot plasma and vaporize, while smaller particles acquire enough speed to collide with the wall. This is detailed in the inset of figure 8, where Rc = 1.7 µm. The value of Rc depends on the ion flow and the details of the heat balance. For example, flow velocity values at the injection point of 10 ± 5 km s−1 yield Rc = 1.7 ± 0.5 µm. Grains with initial sizes Rd < Rc are able to migrate and are further separated by the functional dependence of the restitution coefficient: since the sticking velocity is a decreasing function of size, larger grains can bounce off several times and continue to hover in the SOL, while smaller ones are more likely to stick.
The consistency with the experimentally observed size selection of the collected grains indicates that the main processes are accounted for. On the other hand, clearly the main experimental evidence—dust reaching the collector—is not reproduced. The particles do not travel further than 45° toroidally, neither do they reach the equatorial plane, where the collectors are located (figure 8). This is due to the following trend of deterministic collisions; the normal component of the velocity is always reduced, resulting in more grazing impact angles, which drive the trajectories towards the sticking condition. Although some modifications to the profiles, such as, e.g., a steeper Ti decay near the wall, can improve the transport and widen the size selection, sticking will still occur well before the collector position. The same is valid for variations of the yield velocity (limiting contact pressure py); although increasing from py = 1.6σy to py = 4σy does imply more elastic rebounds (see figure 6(b)), the advance in poloidal transport between these two cases is within ∼10°.
We, thus, proceed to a more realistic scenario—collisions with a rough wall. As discussed in sections 3.3 and 3.4, micrometre and nano-scale irregularities can be modelled by randomizing the wall normal and the adhesive sticking velocity, respectively. Below we show results for the case of initial Rd = 1 µm, not only because dust grains of this size are representative of the initial Rd < Rc population which is able to migrate, but also because within this population, they have the highest radius upon their first collision (nearly the same as their initial radius) and hence are the most likely to be transported far.
When only the randomization of the adhesive sticking velocity is applied, the results are quite similar to those of figure 8 since the particles keep on bouncing at increasingly grazing angles, which eventually leads them to stick rather close to their first impact point.
The results with randomization of the surface normal differ drastically, as seen from figure 9 (for σsurf/d = 0.5). Such a randomization permits for the tangential part of the rebound velocity, essentially conserved in the impact, to have a component directed away from the wall, which allows the particles to spend a sufficient time in regions of stronger ion flow, and hence enhances dust transport. In fact, as observed from the figure, in this case a fraction of the injected dust is able to reach the collector position. Values of σsurf/d larger than 0.5 do not significantly improve the distance of migration as they tend to correspond to a uniform distribution of the surface normal, allowing more particles to bounce backwards or directly towards the core.
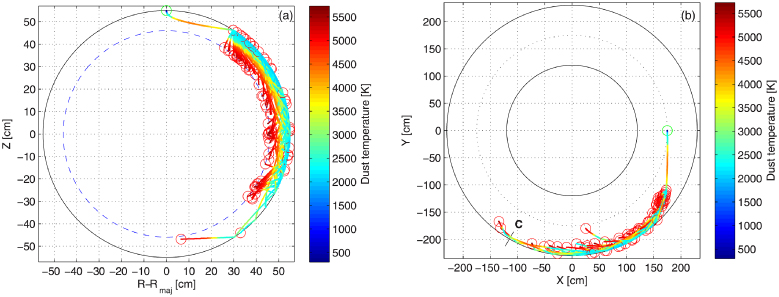
Figure 9. Randomization of the trajectory of a dust particle with initial Rd = 1 µm via randomization of the surface normal with σsurf/d = 0.5. (a) Poloidal projection; (b) toroidal projection (the position of the collector is marked). All parameters are as in figure 8.
Download figure:
Standard image High-resolution imageFinally, figure 10 presents the results with both randomizations taken into account. The number of particles reaching the collector does not differ significantly from that in figure 9 (drastically enhanced statistics would be necessary to draw a firm qualitative statement). The poloidal projection in figure 10, however, shows that more particles were vaporized by the hot plasma, nearly 80% as compared with ∼50% in figure 9. In fact, as the reduction of the adhesive sticking velocity further increases the restitution coefficient (see figure 7), particles that rebound towards the hot plasma will tend to penetrate deeper and will be more likely to vaporize. Therefore, the effect of the second randomization on the distance of migration is twofold; a higher restitution coefficient inhibits sticking, but, when coupled with the randomization of the surface normal, it can also enhance the probability of vaporization.

Figure 10. Same as figure 9, with the randomization of the adhesive sticking velocity included.
Download figure:
Standard image High-resolution image
4.2. Comparison with experiment
Below we follow the enumeration of the experimental results as given in section 2.
The collection of dust by poloidally exposed samples and not by toroidal ones—experimental results (i) and (ii)—can be explained as follows: dust reaches the Si collectors with typical velocities of several m s−1 poloidally and ∼100 m s−1 toroidally. It impacts poloidally exposed samples at grazing angles and is efficiently trapped as a result of the collector geometry described in section 2. On the other hand, it impacts nearly normally on toroidally exposed samples, and bounces off owing to the low critical velocity values for W dust impinging on a Si surface (whose order of magnitude is similar to those in figure 6). Such an interpretation is supported by results of the previous campaign where C dust was injected and collected by toroidally exposed aerogel samples [18]. Aerogel is a highly porous material and micrometre dust with a velocity of 100 m s−1 is efficiently captured, in contrast to similar impacts on any solid collector [4].
The selectivity of the size of migrating dust—experimental result (iii)—is caused by the loss of dust particles due to vaporization (upper threshold) and sticking to the wall (lower threshold). The particles with an initial radius below Rc lose a fraction of their mass on their way to the wall, causing them to experience their first collision with a radius not above 1 µm. Therefore, our simulations predict that no particles of larger radius can be collected. As mentioned above, the exact values of Rc and of the maximum size of the particles reaching the wall depend on the details of the plasma profiles, hence the agreement with the experimental values is rather reasonable. The lower limit in the experimentally observed sizes can be explained by the fact that small particles stick very efficiently and are unlikely to undergo more than a few collisions with the wall, and thus reach the collector.
5. Conclusions
A model for dust–surface collisions taking into account dissipation due to adhesion and plastic deformation has been implemented in the MIGRAINe dust dynamics code. The functional behaviour of the normal restitution coefficient implies that dust–surface collisions generally favour the transport of larger grains, not only due to their smaller sticking velocities but also due to their higher restitution coefficients. However, this is opposed by the fact that larger grains will tend to penetrate deeper in the hot plasma near the injection point, which makes them prone to vaporization. The competition between these effects leads to a selectivity in the permissible size of transported particles.
Micrometre-scale roughness, modelled here as a randomization of the surface normal, appears to play a dominant role in the long-distance migration of dust as it allows for the tangential part of the rebound velocity, essentially conserved in the impact, to have a component directed away from the wall and, thus, enables grains to return to regions of stronger ion flow for a significant amount of time. Nano-scale roughness, modelled here as a randomization of the adhesive sticking velocity, only introduces a negligible difference with the smooth wall case when considered alone. Its effect is also not significant when combined with the randomization of the wall normal.
Finally, we note that the modelling of re-mobilization is not carried out here, as it would inevitably introduce large uncertainties, not only due to the dependence of the lift-up velocity on the dust–wall contact radius, which itself is a function of the impact history of the particle, but also due to the necessity to introduce the effects of the discharge start-up and ramp-down. Nevertheless, the issue has to be addressed in future work, since experimental evidence indicates that re-mobilization does take place; (a) injected C dust has been collected months after its introduction, see [18] for details, (b) as mentioned in section 2, atomic W deposition rates in discharges with W dust injection and immediately after are within the same order of magnitude, though the latter is reduced, implying re-mobilization and subsequent vaporization.
Acknowledgments
SR and PT acknowledge the support of the Swedish Research Council. This work is partly supported by the tasks WP12-IPH-A03-2-18/BS/VR and WP13-IPH-A03-P2-01/PS/VR of the European Fusion Development Agreement (EFDA).