
Abstract
White hybrid inorganic/organic light-emitting diodes (LEDs) were fabricated by combining a novel organic colour converter with a blue inorganic LED. An organic small molecule was specifically synthesised to act as down-converter. The characteristics of the white colour were controlled by changing the concentration of the organic molecule based on the BODIPY unit, which was embedded in a transparent matrix, and volume of the molecule and encapsulant mixture. The concentration has a critical effect on the conversion efficiency, i.e. how much of the absorbed blue light is converted into yellow light. With increasing concentration the conversion efficiency decreases. This quenching effect is due to aggregation of the organic molecule at higher concentrations. Increasing the deposited amount of the converter does not increase the yellow emission despite more blue light being absorbed. Degradation of the organic converter was also observed during a period of 15 months from LED fabrication. Angular-dependent measurements revealed slight deviation from a Lambertian profile for the blue and yellow emission peaks leading to a small change in 'whiteness' with emission angle. Warm white and cool white light with correlated colour temperatures of 2770 K and 7680 K, respectively, were achieved using different concentrations of the converter molecule. Although further work is needed to improve the lifetime and poor colour rendering, these hybrid LEDs show promising results as an alternative approach for generating white LEDs compared with phosphor-based white LEDs.
Export citation and abstract BibTeX RIS

Original content from this work may be used under the terms of the Creative Commons Attribution 3.0 licence. Any further distribution of this work must maintain attribution to the author(s) and the title of the work, journal citation and DOI.
1. Introduction
White light-emitting diodes (LEDs) are well on their way towards completely replacing conventional light sources, i.e. incandescent light bulbs and fluorescent tubes [1]. Energy-efficient lighting using nitride-based white LEDs and their application to solid-state lighting (SSL) was recognised by awarding the 2014 Nobel Prize in Physics to three Japanese scientists whose work made this technology possible [2]. Advantages of SSL over conventional light sources include increased energy efficiency, long lifetime, improved light quality and low maintenance, as well as integration in intelligent lighting systems [3].
White light using LEDs can be produced in different ways; with a combination of multiple inorganic LEDs, an inorganic LED together with a suitable colour converter or an entirely organic LED using organic electroluminescent materials.
White inorganic LEDs can be made using three methods. The first method, the RGB system, uses three LEDs emitting in the red, green and blue spectral range. While this system has no need of a colour converter and achieves good colour rendering, it is hampered by the lack of efficient green LEDs [4]. Also, each LED, due to its different electrical characteristics needs separate electronic drivers, which makes the colour tuning more difficult considering each LED ages at a different rate. The second, and most commonly used approach, is based on an inorganic blue-emitting LED combined with an inorganic phosphor acting as the colour converter, which absorbs some of the blue light and emits in the yellow spectral region. The third method is similar, except an ultra-violet (UV) LED is used in combination with a red, green and blue-emitting phosphor. Problems associated with inorganic white LEDs are their high cost, non-uniformity of the emission, challenging colour tuning and poor emission in the green and red spectral range, and self-absorption which leads to poor colour rendering [5]. Furthermore, many phosphor-based converters contain rare earth elements, the supply of which is becoming increasingly precarious [6].
White organic LEDs (WOLEDs) are entirely based on organic or organometallic molecules [7]. These organic materials are deposited as thin films either as a single layer or multilayer structure placed between thin electrodes. Light emission occurs through fluorescence radiative decay or phosphorescence. WOLEDs have the advantage of a large area and different shapes, being flexible due to the substrates used (e.g. plastic), being produced with easy processing techniques and having their colour customised by adjusting the molecular structure [8].
Due to their properties, inorganic white LEDs and WOLEDs have different applications. Inorganic LEDs can be found, for example, in street lighting, general illumination and automotive head lamps. Organic LEDs on the other hand can be predominantly found in displays (i.e. televisions and computer monitors) and mobile devices, but, due to their potential fabrication over large areas and flexibility, they have also entered the SSL market.
Our approach is to take the 'best of both worlds', namely by combining a highly efficient inorganic blue LED with a low cost and flexible organic colour converter to generate a white hybrid LED, which recently attracted increased interest [9, 10]. The blue light is generated in the active region of an LED, which consists of a quantum well structure made of thin layers of GaN and InGaN [11]. The organic material is designed to absorb light at the emission wavelength of the blue LED, convert it to lower energy yellow light and re-emit it. Similar to the blue LED and phosphor approach, the result is white light. Previously, we reported on initial results using a colour converter, (BODFluTh)2FB, based on the BODIPY unit and white light emission was achieved in combination with a blue LED [12]. We designed and synthesised (BODFluTh)2FB specifically to act as a colour down-converter. The organic material was embedded in a transparent non-emissive polymeric matrix to prevent aggregation and quenching of the emission and protect it from the environment.
The generation of white light, however, is very sensitive to the thickness of the organic compound on top of the LED chip and the concentration of the organic material incorporated into the transparent matrix. A careful balance of both is required. In this paper, we systematically study the effect of concentration and volume, which defines the thickness, in order to optimise the colour conversion process to generate white light. Furthermore, the emission of the white LED was investigated as a function of angle in order to understand the emission pattern of the LEDs after applying the organic converter material. Finally, the conversion efficiency of the organic wavelength converter was also investigated by carefully comparing the excitation spectrum of the blue LED with the spectrum of the blue LED coated with the colour converter.
2. Experimental methods
For the manufacture of the hybrid white LEDs a blue-emitting inorganic LED was coated with our specifically synthesised organic colour converter, (BODFluTh)2FB. The blue LEDs are based on the 'GaN-on-Silicon' technology and emit at a wavelength of 444 nm. The organic converter molecule consists of an absorber component at its centre, and an emissive component at both ends. The emissive component, commonly known as BODIPY (4,4-difluoro-4-borata-3a-azonia-4a-aza-s-indacene), has desirable properties, such as good solubility, high absorptivity and high photoluminescence efficiency. It also has tunable emission, and therefore is a suitable molecule for use in colour converter applications [13]. (BODFluTh)2FB absorbs light around 400 nm and 525 nm, and down-converts the light into the yellow region, with emission peaking around 550 nm. For deposition on the inorganic LEDs, the organic converter (BODFluTh)2FB was incorporated with different concentrations into a transparent matrix (1,4-cyclohexanedimethanol divinyl ether with the photoacid generator 4-octyloxy diphenyliodonium hexafluoroantimonate), which serves as an encapsulant [12, 14]. This solution was deposited on the LEDs using the drop-casting method and cured under exposure to UV light (254 nm). Absorption and emission spectra of (BODFluTh)2FB in solution and incorporated into the transparent matrix can be seen in figures 1(a) and (b), respectively. Further information on the synthesis, chemical structure and absorption and emission properties can be found in [12].
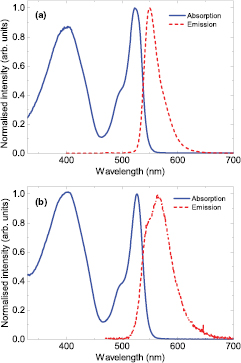
Figure 1. (a) UV-vis absorption and emission spectra of (BODFluTh)2FB in (a) dichloromethane solution (10−5 M) and (b) encapsulated within the transparent matrix. The solution was excited at 440 nm, whereas the encapsulated material was excited at 403 nm.
Download figure:
Standard image High-resolution imageA calibrated integrating sphere system (Labsphere illumina®plus 600/610) was used to collect emission spectra, which were corrected for the system response. This makes it possible to determine the chromaticity coordinates (x, y) in the Commission internationale de l'éclairage (CIE) 1931 colour space chromaticity diagram, the correlated colour temperature (CCT), colour rendering index (CRI) and luminous efficacy [15]. The luminous efficacy is the ratio of the luminous flux and the electrical input power of the LED measured in lm W−1. It describes the efficiency of converting electrical power into light taking the human eye response into account. The angular emission of the LEDs was investigated using a simple goniometer. The light was collected through a lens system with a numerical aperture of 0.13 connected to a spectrometer (Ocean Optics USB2000+) with a 1 nm spectral resolution using an optical fibre. The LEDs were driven under either a continuous or pulsed forward current. In order to minimise degradation of the LED and colour converter due to heating of the device junction a bespoke pulsed current source was used. The period of the pulse generator was 500 μs with a pulse length of 10 μs giving a duty cycle of 2%. For operation under a continuous current a Keithley 236 source measure unit was used.
To rule out differences in the LEDs themselves, each LED was measured without the organic material and for each series identical LEDs with the same luminous efficacy were chosen for the deposition of the organic converter.
3. Results and discussion
3.1. Optimisation of the deposition
For the deposition of the organic colour converter on the LED chip there are several factors to consider which will influence the colour mixing. First of all, the converter molecule exists as a powder after synthesis. In previous work, using an UV-absorbing compound coupled to BODIPY thin films were deposited on the LED chip from a solution of the compound in an organic solvent (which evaporated after deposition) [13]. However, the solution tended to agglomerate around the wire bond with cracks formed after the solvent evaporated. Therefore, in this work, the organic material was incorporated into a transparent and non-emissive matrix in order to fully encapsulate the LED chip with the colour converter (as described above in Experimental methods and [12]). Secondly, the concentration of the organic molecule mixed with the encapsulant will influence the blue to yellow ratio and hence the white light emission. Thirdly, the amount of material deposited on top of the LED chip will have a similar influence on the white light emission. In this case the amount is controlled by the volume of material deposited inside the cup of the package where the LED chip sits.
In order to investigate the dependence on concentration a series of solutions of (BODFluTh)2FB in the transparent matrix were prepared with concentrations of 0.25%, 0.5%, 1%, 2% and 4% weight per volume (w/v) and then drop-cast onto the LED package. The cup in the LED package, where the LED die sits, is roughly filled to the top with the organic material and subsequently cured using UV light to harden the encapsulant. Optical microscope images of these LEDs with different concentration are displayed in figure 2(a). With increasing concentration the layer of organic material turned from pale yellow to orange. Figure 2(b) shows secondary electron micrographs of one of the LEDs at different tilt angles using a variable pressure scanning electron microscope (conditions: 5 kV, 0.5 mbar). The dome which formed at this volume is clearly visible. Electroluminescence (EL) spectra of the LEDs operated at a continuous current of 25 mA with different concentrations of the colour converter are shown in figure 3(a). With increasing concentration more blue light is absorbed as is evident by the decreasing intensity of the blue emission peak as seen in figure 3(b). At the same time the intensity of the yellow emission peak from the organic material is decreasing with increasing concentration. This is probably caused by aggregation of the organic molecules at higher concentrations leading to a quenching effect of the emission since blue light is getting absorbed but then not converted to yellow. This will be further discussed later. From the system response-corrected spectra the chromaticity coordinates (x, y) in the CIE 1931 colour space were calculated, which are shown in figure 3(c) together with the Planckian locus and the coordinates for a bare blue LED. From the emission spectra in figure 1 (UV-vis measurement) the chromaticity coordinates for emission from the organic material itself in solution and encapsulated state were calculated. It should be noted that these spectra are not corrected for the system response and the chromaticity coordinates are only approximations. As expected the chromaticity coordinates lie on an almost straight line going from the blue corner, corresponding to the bare blue LED emission, through the Planckian locus towards the yellow region with the LED using a 4% (w/v) concentration. The coordinates of the 4% LED slightly deviates from the straight line which is due to the yellow emission peak being redshifted to some extent compared with the LEDs using the other concentrations as seen in figure 3(a). A larger concentration leads to aggregation of the molecules which generally causes a redshift in emission [16]. The emission from the organic material is most likely a convolution of emission peaks from molecules in different state of aggregation. With increasing concentration, i.e. larger aggregation, this results in a redshift in the emission peak. The emission spectrum of the organic material itself (without the LED) on the other hand contains more green spectral components compared with the spectra for material deposited on the LED chip.

Figure 2. (a) Optical microscope images of LEDs coated with the colour converter at concentrations 0.25–4% (w/v). (b) Secondary electron images of one of the LEDs at a viewing angle of 0°, 35° and 90° using a variable pressure scanning electron microscope.
Download figure:
Standard image High-resolution image
Figure 3. (a) EL spectra of the hybrid LEDs with concentrations 0.25–4% (w/v) of the organic material. The LEDs were operated at a continuous forward current of 25 mA. (b) Integrated intensities of the blue and yellow emission peak as a function of current. (c) CIE 1931 chromaticity diagram showing the location of the LEDs with colour converter of varying concentration. The Planckian locus is displayed as a dashed line. The coordinates of a bare blue LED and the organic material itself (in solution and encapsulated state) are also shown.
Download figure:
Standard image High-resolution imageHaving obtained good white light emission with a 1% (w/v) concentration, different volumes of this concentration ranging between 0.5 μl and 2.0 μl were deposited on the LED package. At a volume of 2.0 μl the encapsulant overfilled the cup of the package and after curing formed a dome. In order to prevent heat from the LED chip degrading the encapsulant with the organic material the EL spectra were recorded using a pulsed current of 25 mA as shown in figure 4(a). The intensities of the blue and yellow emission peak as a function of volume are displayed in figure 4(b). The emission intensity of the blue peak decreases with increasing volume, i.e. more blue photons are getting absorbed. However, the intensity of the emission from the organic material remains roughly constant. This suggests that the extra absorbed blue photons are not getting converted and/or re-emitted as yellow photons despite more organic material being present. One reason for the yellow emission not to increase with volume could be due to an increase in re-absorption of the emitted yellow light with increasing thickness (i.e. volume) of the encapsulant. Another cause could be due the photo-induced absorption (PIA) of the blue light by the accumulated triplet states which give non-radiative emission. This would account for the continued absorption of blue light with no further emission of yellow light. The chromaticity coordinates of the volume series fall onto a straight line as seen in figure 4(c).
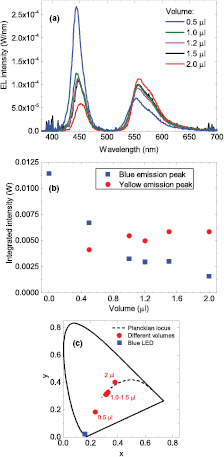
Figure 4. (a) EL spectra of the LEDs coated with the colour converter at volumes 0.5–2.0 μl and a concentration of 1% (w/v). The LEDs were operated at a pulsed forward current of 25 mA. (b) Integrated intensities of the blue and yellow emission peak as a function of volume. (c) CIE 1931 chromaticity diagram showing the location of the LEDs with colour converter of varying volume.
Download figure:
Standard image High-resolution imageConsidering that the concentration series was measured using a continuous current of 25 mA and the volume series at a pulsed current of 25 mA, one LED (1% (w/v), 1 μl) was selected and measured under both current conditions. Also, the pulsed measurement was repeated after approximately 15 months in order to observe any changes over time. The resulting EL spectra are shown in figure 5. The spectra recorded using a pulsed current have been adjusted according to the duty cycle of 2% in order to be compared with the spectrum recorded using a continuous current. Three observations can be made. First, the intensity of the blue emission peak is the same regardless of the current condition and when the measurement was taken. This indicates that the blue LED shows no sign of degradation and that the correction for the pulsing is accurate, which is important for the explanation of the other two observations. Second, the intensity of the yellow emission peak is higher for the pulsed measurement compared with the measurement using a continuous current. The intensity of the blue emission peak shows the same intensity in continuous and pulsed current operation. Radiative recombination processes in GaN-based blue LEDs are relatively fast and observed decay times are generally in the nanosecond regime [17]. Commercial phosphors on the other hand possess decay times of microseconds to milliseconds [18]. A difference in decay times might influence the emission intensity in pulsed and continuous current operation. In order to investigate this, time-resolved EL (TREL) measurements of the hybrid LEDs were performed to measure the decay times of both the emission from the blue LED and the organic converter molecule. The decay time, where the intensity drops to 1/10th of the initial values, is very similar for both emission peaks and is in the order of a few 10 s of nanoseconds. This is very close to the time resolution limit of the TREL set-up (approximately 2 ns) and the switch-off time of the current supply (<10 ns). However, considering that the decay time of the emission from the the organic material is the same as from the blue LED (within the detection limit) it might be concluded that the difference in intensity in the pulsed and continuous current spectra in figure 5 is not caused by different decay times. A fast decay or radiative recombination time is needed for applications which require fast switching compared with the much slower decay times of commercial phosphors [19]. A more likely explanation for the decrease in yellow emission between pulsed and continuous current is that in the latter there is an increase in the population of triplet states to the detriment of singlet states [20]. Intersystem crossing is responsible for this internal transition and the density of triplet states increases with time because the triplet states are much longer-lived than the singlet states. Because the triplet states are non-radiative, we see a decrease in emission. Pulsed current will give re-population of the ground state from the triplet states if the pulse time is longer than the lifetime of the triplet, so we observe the normal yield of fluorescence under these conditions. In case of BODIPY, which is the emissive component in our molecule, the triplet lifetime can be up to 100 μs which is shorter than the pulse period of 500 μs [21]. Third, the intensity of the yellow emission peak decreased over time which is evident when comparing the spectra taken 15 months apart using a pulsed current. This is very likely a sign of degradation due to exposure to oxygen and/or moisture in the environment. Previously, degradation of the encapsulated organic material was observed and related to the transfer of heat from the LED chip to the organic material that was in immediate contact with the LED [12].

Figure 5. EL spectra of a white LED (1% (w/v), 1 μl) using either a pulsed or continuous current of 25 mA. The same LED was remeasured after 15 months for comparison with the initial pulsed measurement. The data of the pulsed measurements were corrected according to the duty cycle of 2%.
Download figure:
Standard image High-resolution imageThe LEDs in the volume series were remeasured using a continuous current and the spectra are shown in figure 6(a). From the spectra, the intensities of the blue and yellow emission peaks are calculated and shown in figure 6(b) as a function of volume. The intensity of the blue emission peak decreases with increasing volume showing a larger absorption of the blue light at higher volumes. A comparison of the values of the blue emission peak in figure 6(b) (continuous current) with figure 4(b) (pulsed current) shows that they are approximately the same. However, compared with figure 4(b) the absolute intensity of the yellow emission is lower. The reason for this is that the measurement was performed using a continuous current, which eliminates the issue of the organic material having a longer decay time because the converter is constantly pumped by the continuous current. Also, the continuous current measurement was taken about 15 months after the pulsed measurement leading to a slight aging of the organic material which is exhibited in a reduced emission intensity of the yellow peak. With increasing volume more blue light is getting absorbed, as seen by a decrease of the intensity of the blue peak, but not re-emitted as yellow light as displayed in figure 6(b). As described before, this could be either due to re-absorption of the yellow light or photo-induced absorption of the blue light. The chromaticity coordinates are shown in figure 6(c) together with the coordinates from the LEDs under pulsed conditions. The suspected degradation and consecutive decrease in yellow intensity shifts the chromaticity coordinates further towards the blue corner. Since only the mixing ratios of blue to yellow is affected by this the coordinates remain on the same straight line.
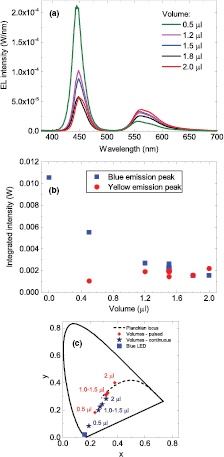
Figure 6. (a) EL spectra of the aged LEDs coated with the colour converter at volumes 0.5–2.0 μl and concentration of 1% (w/v). The LEDs were operated at a continuous forward current of 25 mA. (b) Integrated intensities of the blue and yellow emission peak as a function of volume. (c) CIE 1931 chromaticity diagram showing the location of the LEDs with colour converter of varying volume (dark blue stars). Also shown are the chromaticity coordinates (red dots) when the LEDs were driven by a pulsed current, which is the same data as shown in figure 4(c).
Download figure:
Standard image High-resolution image3.2. Conversion efficiency of the colour converter
Wavelength converters are generally described by their photoluminescence quantum yield (PLQY), which is defined as the ratio of photons emitted and photons absorbed by the material on its own through external excitation. By comparing the spectrum of the bare blue LED with the spectrum of the same LED with the organic material deposited it is possible to estimate the quantum conversion efficiency of the converter. A fraction of the blue light will be absorbed by the absorbing part of the molecule, internally converted, transferred and emitted at a longer wavelength by the emissive component. The conversion efficiency  of the organic converter is given by equation (1), which is simply the ratio of the number of converted photons emitted in the yellow spectral range to the number of absorbed photons in the blue region.
The integrating sphere measures the absolute intensity of light source under investigation in W/nm. In order to calculate the number of photons the spectrum was converted into photons/nm by simply dividing each wavelength channel by the corresponding photon energy. Integrating the area under the emission peaks provides the number of photons for the different peaks. The number of absorbed blue photons  is the difference between the number of photons contributing to the blue emission peak emitted from the bare blue LED,
  , and the LED with the converter applied,
  . The number of converted photons
  corresponds to the number of yellow emitted photons
  .
.
A similar approach is described in [22], where a double integrating sphere system was used. The sample, excited by a a blue laser, is placed between the two spheres and the reflection and transmission of the blue and yellow light is detected. This makes it possible to measure the PLQY of wavelength converters on their own since the excitation is a laser source and reflected and transmitted light can be differentiated. In our approach, only an estimation is possible since the converter is directly applied to the LED and the single sphere measures the entire emitted light, i.e. transmitted and reflected. Also, reflected blue and yellow light is either trapped in the LED package or escapes through multiple reflections.
Figure 7 shows the conversion efficiency calculated according to equation (1) as a function of concentration of the organic material. The conversion efficiency is decreasing with increasing concentration, i.e. fewer blue photons are converted into yellow photons with increasing concentration. This quenching process at higher concentrations can also been seen in the relative intensities of the blue and yellow emission peak displayed in figures 3(b), 4(b) and 6(b). Whilst more blue light is getting absorbed, seen as a decrease in peak intensity of the transmitted blue photons, the emission intensity of the yellow peak is simultaneously dropping. The reason for the decrease in conversion efficiency is that increasing the concentration leads to increased aggregation of the emissive molecules within the encapsulated layer due to their close proximity leading to additional non-radiative pathways [23].
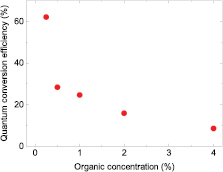
Figure 7. Quantum conversion efficiency of LEDs with different concentrations of (BODFluTh)2FB.
Download figure:
Standard image High-resolution imagePreviously, the PLQY in solution and encapsulated state was measured to be 60% and 63%, respectively, when excited at the wavelength of the absorption maximum at 404 nm [12]. This is comparable with the LED using a 0.25% (w/v) concentration, which gives a conversion efficiency of about 62%, where the excitation wavelength is the one of the LED (444 nm). The conversion efficiency  defined by equation (1), however, is only an estimate since the colour converter is already deposited on an LED. To determine an efficiency using this method is possible in our case, because the blue emission from the LED and the yellow emission from the colour converter do not overlap and can be differentiated. It should be noted that the efficiency applies only to that particular LED since transmitted and reflected light is not separated and the chip packaging will have an influence on the total emitted light.
An alternative standard for the efficiency is the ratio of luminous flux of the LED with the colour converter and the radiant flux of the blue LED, defined as blue-to-white efficacy. This value essentially indicates how much of the optical power of the blue LED is converted into 'white lumens' of the LED using the colour converter. Considering that this ratio can be calculated for any LED, the LED needs to possess the following two criteria in order to be considered as white. The CCT needs to be in the range of 2700–10 000 K and the chromaticity coordinates need to fall within a narrow band around to the Planckian locus according to  . This gives a value range of approximately 100–120 lm W−1 depending on concentration and volume. Good phosphor-based converters have a value above 200 lm W−1. The reason for the lower value of the organic converter is probably due to the lack of green light which contributes strongly to the luminous flux.
3.3. Angular dependence of the emission
The desired emission profiles of commercial LEDs strongly depend on the application. While LEDs for car head lamps should be strongly directional, light for room light should be more isotropic. In both cases, however, it is important that the colour of the LED is the same in all directions even when the light intensity might vary strongly with angle. To investigate the angular dependence of the emission EL spectra were recorded in 5° steps in two perpendicular directions across an LED. Figure 8 shows the integrated intensity of the blue and yellow emission peak of the white LED with 1% (w/v) and 1.5 μl. It also shows the ideal Lambertian emission pattern, which is characteristic of the emission from a planar surface and proportional to  (with θ measured from the normal on the surface).

Figure 8. Integrated intensity of the blue and yellow emission peak as a function of angle θ for a white LED with 1%, 1.5 μl of (BODFluTh)2FB. In addition the ideal Lambertian emission profile expected from a planar surface is shown as a dashed line and the profile from a hemispherical surface as a dotted line. The inset shows the direction of the measurements.
Download figure:
Standard image High-resolution imageBoth the remaining emission from the blue LED and the emission from the organic colour converter are very similar to the Lambertian emission pattern. The pattern of the blue emission is slightly more elongated in the forward direction indicating a marginally more directional emission pattern than that is expected from a planar surface. This might be due to the fact that the colour converter forms a dome on top of the planar LED chip acting as a lens. On the other hand, the emission intensity from the colour converter is marginally higher towards larger angles compared with the Lambertian profile. It can be expected that once blue photons are absorbed and converted that the newly generated yellow photons are isotropically emitted. An isotropic emitter below a flat surface leads to a Lambertian profile, whereas a hemispherically shaped surface causes the intensity to be the same at all angles which would present itself as a half circle in a polar plot such as figure 8. The encapsulant forms a dome on top of the LED chip which causes the emission intensity of the organic emitter in figure 8 to deviate from that of a planar surface and to approach that of a hemispherical surface. These angular differences between the intensities of the blue and yellow emission also lead to a change in colour with angle. Since the blue to yellow ratio changes with angle the 'whiteness' of the LED will also change with angle. At larger angles the LED will be more yellow or warm white and more cool white in the forward direction with a higher blue contribution.
Using the drop-casting method can, in some cases, result in air bubbles forming within the colour converter that can alter the emission profile. This could be the reason for the slight kinks in the emission profiles in figure 8. In order to avoid this a more controlled deposition of the colour converter needs to be applied.
3.4. Quality of the white light emission
A white light source is described by its CCT, CRI and chromaticity coordinates. The CCT is a measure for the 'whiteness' and can be expressed as cool white light with a higher blue component and warm white with less blue but more green and red light. The CRI describes how truly the colour of an object is represented by that light source and by definition a black body source (e.g. a incandescent light bulb is approximately a black body radiator) has a CRI of 100.
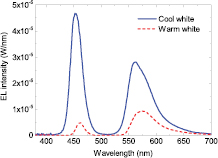
From the concentration and volume series two LEDs can be identified as being warm and cool white according to their CCT. The LED with the warmest white light posses a CCT of 2770 K, CRI of 20 and chromaticity coordinates (0.45, 0.41), which was achieved using a concentration of 4% (w/v) and volume of 1.5 μl. The cool white LED on the other hand was produced by a concentration of 1% (w/v) and volume of 1.5 μl giving a CCT of 7680 K, CRI of 46 and chromaticity coordinates (0.31, 0.27). EL spectra of both LEDs can be seen in figure 9. In both cases the CRI is quite low showing that the colour rendering properties of the organic converter are rather poor. The reason for this is that light from parts of the green spectral region is missing in the emission spectrum of the white LEDs as evidenced in figure 9, which is the region where the human eye is most sensitive. This gap in the green between the blue LED peak and the yellow emission from the organic material is further exaggerated by self-absorption due to an overlap of the BODIPY absorption (527 nm) and emission peak (565 nm) as seen in figure 1(b).
Figure 9. EL spectra of a warm and cool white LED using (BODFluTh)2FB.
Download figure:
Standard image High-resolution image
4. Summary
A specifically synthesised organic molecule acting as as a colour converter, (BODFluTh)2FB, was combined with an inorganic blue LED in order to investigate the capabilities of the organic converter molecule to produce white light. Varying the concentration and volume of the organic material showed that the colour of the hybrid LED could be tuned from the blue through the white into the orange-yellow region. Cool and warm white light was generated with CCTs of 7680 K and 2770 K, respectively. The colour rendering capability, however, was poor due to missing green light partially caused by self-absorption of the molecule. Considering that the whole molecule is specially designed, exchanging the current emissive component with another component without overlapping absorption and emission in the yellow is possible and is currently being explored. Angle-dependent measurements showed that the intensity distribution from the blue and yellow emission peak was close to a Lambertian profile. The lifetime of the compound needs to be further improved. One possibility might be to add another layer of transparent encapsulation (not containing the organic converter) above the currently deposited converter/matrix mixture. This may help to protect the organic converter from the environment. Lastly, the conversion efficiency of the whole LED was measured to exceed 60% depending on the concentration. As a whole, this approach using an inorganic blue LED combined with an organic colour converter to create a hybrid white LED shows promising results and further fine tuning of the organic emitter has the potential for a new generation of hybrid light emitters.
Acknowledgments
The authors would like to thank UK EPSRC (Grant Nos. EP/I012591/1 'Lighting the Future' and EP/L016982/1 'Next generation white LEDs using hybrid inorganic/organic semiconductor nanostructures for general illumination and wireless communication') for financial support. DJW received funding through EPSRC's Manufacturing Fellowship in Gallium Nitride (EP/N01202X/1). Additionally, PJS thanks the Royal Society for a Wolfson Research Merit Award. The data associated with this research are available at http://dx.doi.org/10.15129/3bd82700-5914-48fa-8015-ac90d5ff3071 or from the corresponding author.