
Abstract
Computed tomography with x-rays is a powerful tool to analyze the complex reaction and transport processes that occur inside electrochemical storage devices. To this day, a better insight into the occurring processes is needed and will yield improvements in energy density and cycling stability of next-generation batteries. Herein we present general considerations for the use of x-ray tomography of batteries to gain a detailed insight during operation. Furthermore, we present examples for the tomography of zinc–oxygen batteries, sodium–oxygen batteries and metal–sulfur batteries, elucidating performance limiting degradation processes such as dendrite formation and loss of liquid electrolyte. With the method applied, we aim to establish an effective link between the battery and x-ray community by offering a guideline on how to apply x-ray tomography to propel research on battery materials and entire batteries.
Export citation and abstract BibTeX RIS
1. Introduction
Currently, so-called next-generation batteries, such as metal–oxygen [1–3] or metal–sulfur batteries [4, 5], are discussed intensively as potential successor of conventional lithium-ion batteries based on intercalation electrodes [6]. Thereby, the understanding of complex processes occurring within those batteries should be of major interest in order to increase cycle life and Coulomb efficiency—and to allow successful development of practical applications. It is commonly agreed upon that only a better insight into the occurring processes will yield improved energy densities and better cycling stability of next-generation batteries for future energy applications.
Motivated by the lacking insight, various analytical methods are applied for the analysis of materials, electrodes, and even full batteries [3, 7–12] to elucidate cell chemistry [13–15] and degradation processes [16–18]. The drawbacks that come with these methods might however be plentiful: Often, model systems with simplified geometry and micro-structure, and additives in electrode or electrolyte are needed [19–22]. Moreover, the analytical methods commonly chosen (e.g. scanning electron microscopy or Raman spectroscopy) can interfere with ongoing processes inside the battery, since they might bring in energy into the system, leading to structural or chemical changes in the region of interest, or even the entire battery.
Scanning electron microscopy (SEM) and optical microscopy are widely used to characterize the surface of battery electrodes in the range of nanometers. X-ray microscopy can be applied for analyzing batteries with high spatial resolutions of approximately a few nanometers [23]. Especially the combination with Fresnel zone plates yields promising results for thin samples [24]. However, the drawback of these techniques is that they do not allow for an in situ study of active material inside the entire volume of the battery. Once the sample has been cut, it can hardly be used for further investigations during ongoing discharge or charge stages [25, 26].
To overcome the aforementioned inconvenience of ex situ methods, x-ray tomography appears as very appealing method for battery research [27–29]:
- First, it is a non-destructive method. The power input—as a function of attenuation of the sample—for a 10 W x-ray source is usually below 1 mW, directed through the entire sample area. The ratio of power and sample area is thus much lower than for Raman spectroscopy (similar power but much smaller area of the laser spot) or SEM (less power but by far smaller area for the electron beam spot). Consequently, only small amounts of energy are converted into heat during x-ray tomography analysis.
- Second, the high spatial resolution in the scale of a few micrometer in combination with the high density contrast achieved with monochromatic x-rays, allows to monitor morphology changes and (electro)chemical reactions inside batteries [26], as reported for lithium-ion batteries [30–34].
We expect that an insight into real, practical operating battery systems is essential to overcome the currently reported issues of next-generation batteries, such as dendrite formation, morphology change of the metal anode or degradation processes in the entire battery [3, 6]. To support this claim, we present selected examples of transmission x-ray tomography analysis that was performed for various battery types. We will systematically discuss the steps needed to successfully apply in operando x-ray analysis for batteries, with the aim to monitor the reaction products, the underlying transport of species and possible degradation processes. In detail, we present investigations of zinc–oxygen batteries, sodium–oxygen batteries and lithium–sulfur batteries, and will indicate, which operating limitations persist for these systems. The methodology introduced might help to propel research in both the battery and the tomography community, and offers an outlook on how we can gain deeper understanding of further, even more complex, electrochemical energy storage or conversion devices in operando.
2. General considerations on computed tomography
Images are an intuitive and comprehensible way to display complex information. This also holds for monitoring the complex reactions, either homogeneous or heterogeneous, and transport processes—namely diffusion, migration and convection of species—that occur inside electrochemical devices. One advanced method of taking images of material redistribution or conversion is the x-ray tomography analysis. It is a combination of taking 2D radiographic projections of the sample under investigation and the subsequent application of mathematical methods for image processing, which yields a 3D image of the regions of interest. The typical length scale for imaging methods comprises nine orders of magnitude of resolution and sample size [35]. Imaging can be applied in the 1 nm-range in the case of atom probe measurements, in the range up to 1 µm for electron tomography and x-ray 3D microscopy, in the range from 1 µm up to 1 cm for x-ray μ-tomography, and on scales above 30 µm for neutron tomography [35–37]. In these ranges, a huge variety of electrochemical systems, such as the upcoming next-generation batteries, and processes occurring within them can be visualized, for which we will give various examples later on in section 4.
2.1. X-ray tomography
Figures 1(a) and (b) illustrate the working principle for tomographic analysis that is commonly used in material science. Herein, we only present x-rays transmission analysis of several battery types and therewith confine the explanations to this issue in the following. The tomographic method [35] relies on the rotation of the specimen, or, in some case, on the rotation of the source around the specimen. Latter is commonly used in medical applications, while the specimen is usually rotated for investigations in the field of material science. The specimen is rotated in small angle steps in the beam and in the field of view of the detector. One or more radiographies are taken at every angle step, so that a stack of images, that contains the transmission information of the sample, is obtained. The exposure of more than one radiography per angle step enhances the signal-noise-ratio (SNR) and therewith image quality. This type of exposure is commonly applied for x-ray sources with low beam intensities (such as conventional x-ray sources). The duration of a tomography is between some tenths of microseconds up to several hours and strongly depends on the x-ray source and on the imaging setup, as well on the specimen of interest. Typical spatial resolutions are on the micrometer-scale. Some techniques are available that allow for a tomography of samples that are larger than the detector [38, 39].
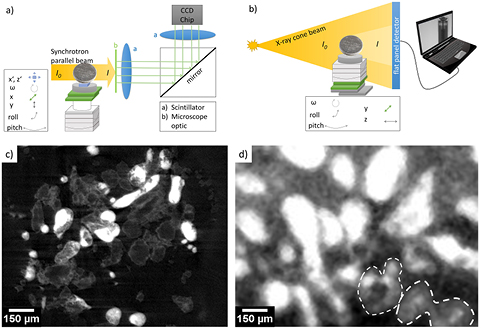
Figure 1. General tomography-setup for synchrotron radiation at the electron storage ring BESSY II (a), and conventional x-ray radiation as available at Helmholtz-Zentrum Berlin (b); results for synchrotron (c) and conventional x-ray source (d) tomography, showing slices through the anode of a Zn/O2 battery with the active material Zn in particle form (light to gray color), indicating the difference of resolution obtainable.
Download figure:
Standard image High-resolution imageAfter rotating the sample and taking radiographies, the data measured has to be normalized and reconstructed. These steps will eliminate artifacts from the transmission radiography and transfer 2D transmission information to 3D attenuation coefficients of the sample [40–42]. Information about tomography using different beam characteristics, reconstruction algorithms and basic data analysis can be found elsewhere [35, 43, 44].
To elucidate reaction and transport processes within an electrochemical cell, the following procedure can be applied: A tomographic image of the cell is taken at a chosen initial (electrochemical/chemical) state, then its state of charge is changed electrochemically, e.g. by applying a current for several hours, then another tomographic image of the cell is taken at this new state. It is very important to keep the electrochemical cell in open circuit mode during tomography, to avoid material redistribution due to electrochemical reactions. In our experience a waiting time—of course depending on the battery type and size—of several minutes after discharge or charge and prior tomography should be maintained to ensure enough time for relaxation. The entire procedure can be continued to stepwise monitor the state of the electrochemical cell with changed state of charge, thus allows to analyze the electrochemical cell more or less in operando, and in a non-destructive way. In the end, the reaction and transport processes within the cell can be interpreted with respect to the differences of the taken tomographic images, even allowing to present the results in a very comprehensible way with time lapse sequences, i.e. videos, of the ongoing processes.
2.2. Synchrotron versus μ-tomography
Three different types of sources are nowadays used for imaging: Conventional vacuum tubes that convert electrical power input into x-rays (CXT), liquid metal jet sources and large scale facilities, i.e. electron storage rings. Especially the liquid metal jet method is a relatively new method and is still much less common as the other methods [45]. The most significant difference between large scale facilities [46] and conventional x-ray sources relies on the beam geometry. Due to the high brilliance of large scale facilities, the propagation direction of single photons is almost parallel, whereas most conventional x-ray sources deliver a cone beam with two propagation angles (compare figures 1(a) and (b)). Furthermore, the flux (photons per time and area) is much higher for synchrotron-based x-ray sources. This allows for energy-sensitive measurements with sufficiently high SNR or even for faster measurements.
The here presented and discussed synchrotron-based measurements were taken at the BAMline [47, 48] located at the electron storage ring BESSY II at Helmholtz-Zentrum Berlin, Germany. A versatile imaging setup is provided at this beamline, allowing for transmission and phase contrast radiography and tomography with spatial resolutions between 0.2–5.0 µm, resulting in maximum sample dimensions between 0.8–20.0 mm. Different monochromators allow for energy selective measurements at photon fluxes that are suitable for material analysis without the risk of damaging samples [49]. A scintillator (mainly by Gadox or CWO), in combination with a microscope optic and a CCD camera, is used for signal detection. The Helmholtz-Zentrum Berlin also provides a conventional x-ray source that is well suited for tomography of samples with a dimension in the range of 0.5–10.0 cm. Here, a Hamamatsu solid state detector is used to measure the intensity of the cone beam. The source provides an accelerating voltage up to 150 kV. Typical tomography-setups ((a) and (b)) and reconstructed slices ((c) and (d)) obtained by these methods are shown in figure 1.
As shown in figures 1(c) and (d), there are significant differences in the quality of the images obtained. For synchrotron tomography, SNR and contrast between different materials are much better compared to a conventional x-ray source. In addition, the spatial resolution obtained is improved by a factor of approximately 5. Nevertheless, CXT devices are also suitable for several applications in the field of battery research, since most battery components consist of materials that show unequivocal interaction with x-rays. For example, there is a discrepancy of around 7% between the attenuation coefficient (see section 3.1 for detailed explanation) of Zn and ZnO, and 15% between Zn and  , respectively, which are the main reaction products during discharge of Zn/O2 batteries [3, 50, 51]. In this case, CXT measurements can be well applied to gain information on the spatial distribution of different discharge products, and synchrotron measurements complement these findings at better spatial resolution (see also section 4.1.2).
Performing conclusive CXT measurements is in general more challenging with lithium-type batteries since Li interacts very weakly with x-ray radiation, leading to weak contrast in the radiographic images and less sensitivity for material analysis. If the spatial distribution of lithium plays a major role for the interpretation of electrochemical measurements, then neutron tomography can be applied as complementary technique [33, 37].
3. In operando x-ray tomography: factors to consider for battery analysis
A multitude of factors have to be considered for designing a battery set-up that is suitable for in operando x-ray tomography. In the following, we elucidate the physical background for x-ray tomography, subsequently linking it to guidelines for the design of custom-made cell housings and sample holders, thereby focusing mainly on metal–oxygen and metal–sulfur batteries.
3.1. Material and energy impact on attenuation
Considering a beam of photons that enters a material part of one unit thickness, either photons can be absorbed due to interaction on atomic level, or might pass through the object, reaching the detector [52]. The fraction of photons interacting per one unit thickness of material is known as the linear attenuation coefficient, μ, with the unit m−1 [52]. Its value depends on photon energy, atomic number, and density of an object's material [52]. Occasionally the usage of the mass attenuation coefficient, μm, is more convenient since it is normalized by the material's volumetric mass density, ρ [35].
The relation of attenuation and intensity of the photon beam can be described by the Beer–Lambert law of attenuation [35]: A beam with the intensity I0, which is directed through a sample possessing the linear attenuation coefficient μ and the sample thickness d, will be directed to the detector behind the homogeneous sample with the intensity I. If the object is homogeneously composed of various elements, the total mass attenuation coefficient is the weighted sum of the mass attenuation coefficients of the j single elements [53]. The beam intensity after attenuation can be expressed as:

As a practical value for designing a battery set-up for tomography, the sample thickness, which is required to reduce the beam intensity by half (d(E)T= 0.5), can be calculated [53] as:

This equation can be seen as first 'rule-of-thumb' for choosing the thickness of e.g. a battery housing: If the housing thickness is larger than d(E)T= 0.5, it is unlikely that the active material inside the battery can be monitored with sufficiently high contrast because the beam intensity is weakened rather by the housing material than by the material of interest.
The relation in equation (2) is evaluated for common battery materials that can be expected for metal–air and metal–sulfur batteries (i.e. active or housing materials) and presented in figure 2(a). With the database provided by NIST [54] for attenuation values of different materials and density, it is possible to estimate a suitable material thicknesses required for a tomography set-up for the investigation of battery materials, which is depicted in figure 2(b). Both graphs shown in figure 2 can be used as theoretical guideline to choose an appropriate battery set-up for in operando x-ray tomography. A practical guideline, based on these theoretical values, for the design of custom-made cells for battery tomography will be provided in the following section.

Figure 2. (a) Sample thickness, which is required to reduce the beam intensity by half as a function of the beam energy applied (d(E)T= 0.5) according to equation (2); (b) attenuation coefficient μ as a function of the beam energy applied; both graphs show the respective values for active materials, discharge products and housing materials that are expected in Zn/O2 batteries, Na/O2 batteries and Li/S batteries.
Download figure:
Standard image High-resolution image3.2. Custom cells and sample holders
The following summary gives an overview on the aspects that need to be considered for the design of custom-made cells for x-ray tomography analysis [55]:
- Outer housings might be preferably made of polytetrafluoroethylene (PTFE), polyetheretherketone (PEEK) high-performance polyimide-based plastics (VESPEL), or polymethylmethacrylate (PMMA) for the battery set-up. Those materials combine chemical stability against the electrolyte, and a very low attenuation coefficient for x-rays. Since these materials are primarily composed of carbon and hydrogen, even housing walls with larger thicknesses of several millimeters can be used in the setup compared to a metal housing (consult also figure 3 for an example).
- Graphite might be chosen as current-collector material (for non-intercalation batteries). It possesses a very low attenuation coefficient, is chemically and electrochemically stable against acids and bases, and highly electrically conductive. Commonly, the gas diffusion layer (GDL) in some metal–oxygen batteries is also made of carbon, so that the same aforementioned consideration holds.
- Usually a catalyst layer for oxygen reduction and oxygen evolution is applied at the cathode of metal–oxygen batteries. It is comparably thin (approximately 20 µm), and contains precious or non-precious metal catalysts with elevated attenuation coefficients. However, the catalyst layer is thin enough so that other parts of the cathode might not be significantly affected for tomography analysis.
- Both anode and cathode are usually filled with aqueous or non-aqueous electrolyte solution. For instance, the liquid electrolyte (mixture of water and potassium hydroxide) in Zn/O2 batteries is distinguishable from the gaseous and solid species that are surrounding due to the beneficial difference in mass attenuation coefficient.
- The active material of interest at the battery anode of metal–oxygen cells with aqueous electrolyte, i.e. the metal electrode, possesses an attenuation coefficient at the x-ray energies applied that should be at least higher than for the other components applied in the battery set-up, i.e. housing. Additional components that weaken the beam intensity should be avoided or, as far as possible, reduced to a minimum. Latter can be achieved by specifically selected materials or those with adapted geometries in beam direction. This ensures good contrast to the other materials applied, e.g. to the housing and to the electrolyte.
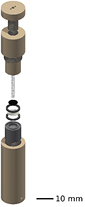
Figure 3. Special in-house set-up suitable for tomographic measurements of Zn/O2 batteries; housing made of PTFE (beige), graphite current collector (gray), O-ring sealing and cathode (black), current collector / stainless steel spring; outer diameter 15 mm, electrode area 1 cm², (compare also [50]).
Download figure:
Standard image High-resolution imageAn example for a battery set-up suitable for in operando x-ray tomography (housing made of PTFE, graphite current collector at anode (bottom) and GDL at the cathode (top), cylindrical and small in dimensions) is presented in figure 3.
4. Results and discussion for selected batteries
In the following we present selected examples of transmission x-ray tomography analysis, aiming to elucidate the distribution of solid material, and to visualize reactions and transport paths inside the battery electrodes.
4.1. Revealing the distribution of solids
The basic understanding of reaction and transport processes in batteries is quiet straightforward if one considers the (electro)chemical balance equations. However, to monitor the underlying reactions in practice (including reactants, products and their complex interactions) can be essential to gain further understanding of the battery itself. In addition, unwanted processes, such as dendrite formation, loss of solvent in the electrolyte applied, or blockage of transport paths can be limiting for practical battery operation. For this purpose, x-ray tomography is especially appealing, which is highlighted by the following results.
4.1.1. Sodium superoxide in the cathode of sodium–oxygen battery.
The sodium–oxygen (Na/O2) battery is one appealing candidate for future energy storage due to its high theoretical energy density [56–58]. The basic working principle of a non-aqueous Na/O2 battery is as follows: During discharge, a sodium metal anode gets oxidized to form sodium ions (Na+) while oxygen is reduced at a cathode (carbon structure with adequate surface area) to form reduced oxygen species. Sodium ions migrate through the electrolyte to the cathode and electrochemically react with the reduced oxygen species, forming a solid oxide, i.e. sodium superoxide (NaO2), by precipitation in the cathode structures [59]. While it is clear that cubic particles of the discharge product NaO2 form on top of the cathode in these batteries [60, 61], the redistribution of solid material inside the cathode is difficult to monitor.
However, a recent study by some of the authors has shown [62] that x-ray tomography is highly suitable to monitor the discharge product deep down in the layers of the cathode. Figure 4 depicts the set-up used for cell discharge and the tomography results obtained for an ex situ analysis. It can be seen that the carbon fibers (gray color) are covered with the major discharge product NaO2 (red color). The observed particles are rather large in size (25 µm, see detail information in figure 5) and distributed with a gradient in the cathode (larger particles on top, smaller particles at the the bottom of the cathode), which implies that these particles might cause pore clogging, and thus might cause either electrolyte or O2 shortage in Na/O2 batteries. From this insight gained by x-ray tomography, valuable information for the operation of such batteries can be derived: Either pumping of electrolyte (electrolyte flow battery) or active supply of oxygen might be necessary for efficient Na/O2 battery operation. Moreover, catalysts might be applied in the cathode structure to provide preferential sites for NaO2 deposition with the aim to achieve a more uniform distribution of the discharge product.
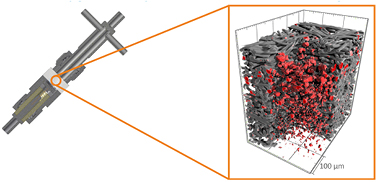
Figure 4. Experimental set-up used for battery discharge at 100 µA cm−2 (left) and results obtained (right) for the synchrotron x-ray analysis of Na/O2 batteries: distribution of sodium superoxide particles (red color) inside the carbon structure (gray color) of the battery cathode; preparation and experimental details as in [62].
Download figure:
Standard image High-resolution image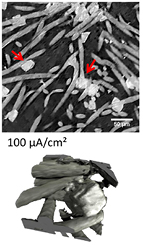
Figure 5. Detail of the cathode of a Na/O2 battery discharged at 100 µA cm−2 (carbon fibers in gray, NaO2 in white), showing a slice through the middle of the cathode (top). The discharge product NaO2 is indicated with red arrows; 3D reconstruction of a region of the cathode, whereas each carbon fiber is approximately 10 µm in diameter (bottom); preparation and experimental details as in [62].
Download figure:
Standard image High-resolution image4.1.2. Zinc particles in the porous anode of zinc–oxygen batteries.
The zinc–oxygen (Zn/O2) battery is another promising battery type for future energy storage applications due to its high theoretical energy density (compared to lithium-ion batteries), and the cheap/abundant and non-toxic materials applied [3, 63]. The general working principle is as follows: In Zn/O2 batteries, zinc is stored within the battery, and oxygen is taken from e.g. the surrounding air to facilitate the overall formation of zinc oxide (ZnO) in the battery. An oxygen reduction process (ORR) takes place at the cathode, forming water and hydroxide ions. Hydroxide ions then migrate via the separator and electrolyte (usually 6 molar aqueous potassium hydroxide solution (KOH)) to form ZnO species at the anode, thereby stripping the active material Zn. For electrical recharge, ZnO has to be redeposited at the current collector of the anode. This is however accompanied by severe structural changes, i.e. known as shape change of the anode, leading to very low cycle life of this battery type [3]. To overcome shape change, usually structured current collectors, e.g. Ni- or Cu-foams [64, 65], electrolyte additives [66], or low surface area Zn particles are applied in a porous electrode set-up [67].
However, to evaluate whether the shape change can be prevented successfully with these strategies, further understanding of the anode structures needs to be obtained. Thus, in figure 6 we provide tomography results (both with CXT and synchrotron x-rays) for the analysis of a porous anode (comprising of solid zinc particles, cellulose and liquid KOH as electrolyte) inside a Zn/O2 battery. Both results indicate that it is possible to distinguish between solid phase, i.e. the active material Zn, and void space, i.e. liquid electrolyte and additives, which is subtracted for better image analysis. However, the synchrotron analysis yields much higher spatial resolution of the Zn particles. Thus even structural details, such as small kinks, on the surface of some particles can be visualized, implying that this method can perfectly assess changes on the surface of Zn particles during operation. In the end, even the underlying mechanism of Zn shape change to ZnO, such as the proposed shrinking core model for the electrochemical conversion of Zn to ZnO (see also [68]), might be proven with additional synchrotron analysis for future work.
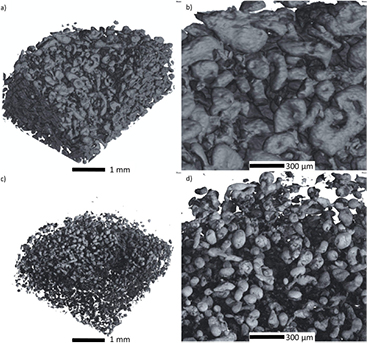
Figure 6. Zn particles monitored inside the anode of a pristine Zn/O2 battery: (a) and (b) obtained with conventional x-ray tube; (c) and (d) obtained with synchrotron x-ray tomography. The sample holder applied is depicted in figure 3; experimental details and x-ray set-up as in [50]. Liquid electrolyte and additives, are subtracted for the images shown, so that a void space between the Zn particles is obtained.
Download figure:
Standard image High-resolution image4.1.3. Macroscopic sulfur dendrite formation in lithium– sulfur batteries.
Lithium–sulfur (Li/S) batteries are another promising candidate for next-generation energy applications due to their high (compared to lithium-ion batteries) theoretical gravimetric energy density of 2500 Wh kg−1, their abundant raw materials and environmentally friendliness [69, 70]. However, their major drawback that prevents a successful commercialization so far, is the strong capacity fading with cycle number, caused by parasitic side reactions [70]. These reactions occur while the Li/S cell is cycled between the two solid phases S8 (charged) and Li2S (discharged). Monitoring the morphological changes of the solid phases during operation can thus give helpful information about the reasons of capacity fading. Recent x-ray diffraction (XRD) studies [71, 72] show the presence of both solid phases at the end of the respective charge or discharge step. The weakly pronounced Li2S XRD peaks in these studies indicate that nano-crystallites are formed. The size of Li2S nano-crystallites is below the resolution that can be achieved with μ-tomography (see section 2.2). However, the charge product S8 is a suitable candidate for the application of x-ray tomography: ex situ µ-tomography studies by Zielke et al correlate morphological changes of sulfur particles to electrochemical results [5]. Recently it was shown by in operando CXT radiography that macroscopic β-sulfur dendrites form at the end of the charge step (figures 7(A)–(C), consecutive constant current charge/discharge at 0.1 C) [73]. Ex situ µ-tomography of a Li/S cell with monolithic bulk electrode charged at 0.1 C from 0% to 100% state of charge (figures 7(D) and (E)) visualizes the spatial distribution of sulfur dendrites deep inside the carbon cathode. Our findings indicate that sulfur dendrites can form. As a consequence, the active material sulfur might not be fully incorporated into the carbon cathode again during charge of this battery type, which is unfavorable due to loss of active material during cycling. The results demonstrate that a combination of operando and ex situ imaging methods can provide valuable information that can lead to a better understanding of the formation processes of solid phases in Li/S cells, which in the end might help to propose strategies to avoid degradation processes such as dendrite formation.
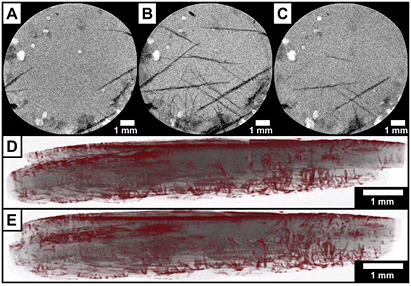
Figure 7. Insets (A)–(C) obtained with operando radiography show the same Li/S cell discharged to 94%, then charged to 100% and subsequently discharged to 92% state of charge at 0.1 C. The dendritic β-sulfur forms macroscopic structures (black color) on the carbon cathode (gray color). Insets (D) and (E) obtained with ex situ µ-tomography show side views through the cathode of another Li/S cell (charged at 0.1 C from 0% to 100% state of charge) from two slightly different view angles. The enhanced contrast of the tomography enabled the visualization of the spatial distribution of sulfur (red color) inside the bulk of the cathode (gray color).
Download figure:
Standard image High-resolution image4.2. Transport processes
Electron transport, ion transport, as well as mass transport are some of the major processes occurring in batteries. The understanding of mass transport, e.g. of reactants or products, to or from the battery electrode is essential to gain in-depth understanding of the battery itself and thus to predict battery performance and limiting factors for their operation. An example for the analysis of mass transport processes monitored by x-ray tomography will be given in the following.
4.2.1. Flooding of cathode in zinc–oxygen batteries.
Blocked pores in the cathode of Zn/O2 batteries can lead to battery failure if O2 cannot pass through the pathways in the carbon layers of the cathode to reach the catalyst where it is needed to complete the ORR [50]. As example, we show the x-ray analysis results of an anode, separator and cathode stack of a Zn/O2 battery in figure 8 (see [50] for experimental details). It can be observed that liquid electrolyte is transported into the pores of the GDL of the cathode; we can visualize for the first time with high spatial resolution that liquid droplets form during operation, as indicated by blue color. This is caused by the expanding solid volume in the anode that pushes out the liquid electrolyte to the cathode (see also [68, 74]).
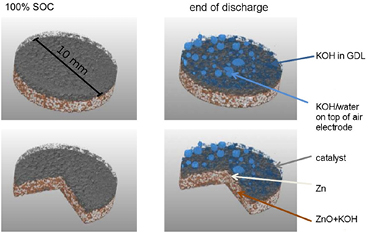
Figure 8. Visualization of cathode flooding with liquid electrolyte (i.e. 6 molar aqueous potassium hydroxide (KOH) solution) shown in blue color, gas diffusion layer shown in gray color; pristine state at 100% state-of-charge (left); battery at the end of discharge (right); experimental procedure and x-ray set-up as in [50]; corresponding discharge profile in figure A2 in the appendix.
Download figure:
Standard image High-resolution imageThis implies serious consequences for the cell potential obtained: Due to an increase in the degree of flooding in the pores of the cathode, the diffusion of O2 to the reaction zone at the catalyst is hindered. Since cell current, and as such the O2 consumption in the cathode, are set constant in the experiment, O2 concentration in the catalyst decreases with advancing operation time [75]. This presumably leads to O2 starvation in the catalyst layer, and finally to a sudden decay in cell potential for the entire battery, which complies well with model-based predictions [74–76].
5. Conclusions
The herein presented examples prove that intrinsic reaction and transport processes inside batteries, as well as occurring degradation processes, can be monitored very conveniently by means of x-ray tomography. In detail we can derive the following conclusions from the tomography results obtained for the electrochemical cells investigated:
- Our analysis yields comprehensive insight into the spatial distribution of discharge product in sodium–oxygen batteries. In addition to the standard, ex situ, investigations of surfaces performed in literature, it was possible to show the reaction product distribution inside the electrode. We could clearly show that the particle size decreases drastically from the oxygen-facing side to the separator-facing side of the cathode, which is a clear indicator for a diffusion controlled formation of NaO2, the major discharge product in this battery type. By implication, efficient operation strategies for practical operation of this battery type have to be explored.
- We indicated that synchrotron x-ray tomography might be necessary to reveal details in the anode of zinc–oxygen batteries: Structural features can be resolved with high spatial resolution on the zinc particle surface, which might help to shed light on the mechanism of electrochemical zinc dissolution/deposition during operation for future work.
- Operando CXT radiography visualizes the formation of macroscopic sulfur dendrites in the β-phase at the end of the charge step for lithium–sulfur batteries. An ex situ tomography shows the spatial distribution of these structures in the monolithic bulk electrode. This combination of operando radiography and ex situ µ-tomography yields a valuable insight into the formation processes in lithium–sulfur cells on the macroscopic scale. It also underlines the importance of imaging methods to correlate morphological changes to electrochemical performance.
- We reveal the strong impact of the electrolyte on the species distribution for zinc–oxygen batteries: Volume changes inside the anode due to Zn oxidation lead to transport of electrolyte into the GDL at the cathode, and can possibly limit the flux of O2 to the reaction zone at the catalyst layer. The results obtained can be used for validation of model-based results. Further investigations using x-ray synchrotron radiation will deliver more detailed insights into the material redistribution and species conversion.
We have shown for all examples that CXT measurements can be well applied to gain information at electrode level, and synchrotron measurements can complement these findings at better spatial resolution, but are not necessary to gain general insights into the battery of interest.
All in all, we show that it is possible to establish an effective link between the battery and x-ray community offering a unique analytic tool for next-generation batteries. In the end, the proposed methods and guidelines for battery tomography can help to gain a better understanding of next-generation battery types that are still in early stage of applied research. Advanced understanding is the essential step before materials or battery electrodes can be optimized or even commercialized.
Appendix
A.1. Experimental details: cells applied and tomography parameters
Cell preparation and electrochemical characterization of zinc–oxygen, sodium–oxygen and lithium–sulfur batteries are as described elsewhere, respectively [5, 50, 62].
Figure A1 shows the sample holder for the analysis of Na/O2 battery cathodes. For Li/S dendrite tomography, batteries were disassembled in an Ar-filled glovebox, Parafilm® M was put around the electrode, and subsequently tomography was performed. Table A1 lists the parameters applied for each tomography method and the respective electrochemical cell.
Table A1. Parameters applied for the measurements presented in this work.
| Properties | Conventional x-ray tube | Synchrotron x-ray source |
|---|---|---|
| Angle steps | 1200 | 2200 |
| Exposure time s−1 | 2.5 | 2.0 |
| Exposures per angle step | 3 | 1 |
| Spatial resolution µm−1 | 9 | 2 |
| Total duration h−1 | 3.0 | 1.5 |
| Monochromatic beam | No | Yes (ΔE/E = 10−2) |
| Battery type investigated | ||
| Zn/O2 |  |
 |
| Na/O2 |  |
|
| Li/S |  |
|
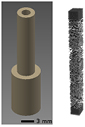
Figure A1. 3D CAD drawing of the PEEK-sample holder for Na/O2 battery analysis (left); 3D reconstruction of the cathode samples put into the PEEK-sample holder and then analyzed with synchrotron x-rays (right).
Download figure:
Standard image High-resolution image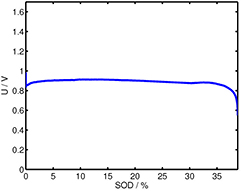
Figure A2. Discharge profile of the Zn/O2 battery investigated for the results in figure 8, showing early end-of-life at approximately 35% state of discharge (SOD); constant current discharge at 2 mA; experimental procedure and set-up as in [50].
Download figure:
Standard image High-resolution image