

Abstract
A new electron interferometry method has been developed and implemented in a transmission electron microscope to quantitatively analyse magnetic and electric properties emanating from objects using holograms free of artifacts and with a frequential sensitivity. This method, called dynamical holographic Moirés (DHM), is based on the double-exposure technique consisting in the superimposition of two different holograms. We improved this technique by acquiring the superimposed holograms for two well-defined excitation states of the sample and with a control of the superimposition frequency. The variations of magnetic and electrostatic fields between both excitation states can then be extracted directly from the amplitude part of the so-called interferogram. We demonstrate the efficiency of this method by studying quantitatively the magnetic field generated by a hard disk drive writing head excited by a DC and an AC current. Double exposure measurements have also been performed to study in situ electrostatic properties of a biased carbon nanocone tip. Our method opens the route to dynamical studies using the unique combination of nanoscale resolution and electromagnetic sensitivity of electron interferometry.
Export citation and abstract BibTeX RIS
1. Introduction
Off-axis electron holography (EH) [1] is a powerful interferometric method carried out in transmission electron microscopy (TEM) which enables to recover the phase shift that the fast electron beam experiences when interacting with any electrostatic and/or magnetic field. This interaction between the incident electron beam and the electromagnetic field is described by the Aharonov–Bohm effect (AB) [2] using the following expression:
where:
 and z are the 2D vector in the object/conjugated planes and the coordinates along the optical axis respectively
- CE is an electron wavelength related constant
- V is the electrostatic potential
- is the magnetic flux quantum equal to where e and h are respectively the elementary charge and the Planck constant.
- Wb.
- Az is the component of the magnetic potential vector parallel to the electron beam and is thus linked to magnetic induction gradients in the image plane.
- is the component of the magnetic induction perpendicular to both r and z.


Since the AB effect was experimentally been demonstrated using off-axis EH by Tonomura et al [1], electron interferometry was used as an efficient tool for the quantitative mapping of electrostatic and magnetic fields appearing within and around a sample with a nanometer spatial resolution [3–10]. EH has also been proved to be sensitive to the atomic displacement (and so the strain fields) by studying the phase shift between diffracted beams through the dark-field electron holography technique [11, 12] which is partially described as a Moirés method. A Moirés pattern consists on interference fringes resulting of the superimposition of two spatial periodic structures. As a result, a modulation of the image intensity appears within the pattern. A simple distinction between Moirés pattern and EH can be draw by the part of the wave under interest: Moirés fringes appear as changes in the amplitude of the exit electron wave while EH aims at retrieving the full exit wave, mostly focusing on its phase part.
Moirés method has intensively been used in TEM for decades for the study of lattices deformation: stacking faults [13], crystal orientation [14], dislocations [15], graphene stacks misalignments [16–18], thickness estimation [19] are some of the structural properties that can been studied using Moirés patterns. More recently Moirés method has been implemented in high resolution STEM [20]: the STEM Moirés fringes for a regularly periodic lattice arise when the interval of pixels defined by the scanning step is close to a lattice spacing of crystalline or to a multiple of it.
The technique described in this paper combines electron holography and Moirés patterns to improve the field sensitivity achievable in TEM through a frequency study and to develop the so-called dynamical holographic Moirés (DHM) method. The basic idea of DHM is to superimpose two holograms obtained on a same area of an object which is periodically stated in two different but controlled configurations (either electrostatic or magnetic). The overlapping of both holograms gives rise to Moirés contrasts in the final amplitude image carried out by the fringes of the holograms.
This idea already proposed in optical interferometry is based on the so-called double exposure technique (or holographic interferometry) and was formerly used in a photonic bench. As examples of application, it enabled to access variations of gas distribution during an arc discharge or to the macroscopic deformation of a given objects under external stress [21, 22]. It was then firstly implemented in a electron microscope 30 years ago [23] and applied to off-axis EH experiments on electromagnetic fields [24–26].
The double exposure technique presents different advantages. First at all the signal can be directly visualized and interpreted from the obtained image by observing the modulation of the amplitude of fringes. Secondly it is not necessary to correct the DHM pattern for any perturbations of the reference wave (as it has to be done for EH) as these perturbations do not contribute to the modulated amplitude if they remain the same for both holograms which will be overlapped. Finally the Moirés contrasts linked to the relative signal between both holograms are not influenced by the distortions originating from the microscope setup (projector lens, camera,...) as they remain identical for all images recorded at the same magnification. These advantages explain why the use of such a technique was initially mandatory for simply and quantitatively mapping electromagnetic information at a large scale of pure phase objects. An exhaustive and complete review of this technique can be found in [27]. Double exposure EH has been further developed by various groups to improve the phase sensitivity by implementing various wavefront tilting [28, 29] or interfering waves number [30, 31].
However, the main drawback of this method is a lower spatial resolution and a lower sensitivity to weak signals compared to the ones obtained in off-axis EH. In addition, the superimposition between both holograms requires to necessary record the holograms with identical conditions and to control the signal change between them. In addition, the emergence of computational hologram treatment as well as the great improvement of CCD cameras with high pixels density, fast acquisition rate and high pixel dynamic turned out this technique less used with respect to achievable modern methods (fast Fourier treatment) which are less time consuming for an improved sensitivity. Nevertheless, browsing the numerous techniques commonly used in industrial interferometric holography, it appears that the double exposure method is somehow the preliminary step towards dynamical characterization tools like the so-called real time and time average holographic interferometry [32].
The purpose of this paper is to show the implementation of the time-average holographic interferometry in a TEM using the combination of off-axis EH and in situ techniques. We highlight in the following the DHM capabilities with two different in situ EH experiments: the first concerns the measurement of magnetic induction generated by a writer pole of a hard disk drive (HDD) as a function of the AC current sent into its coils and the second is the electrostatic field emanating from a biased carbon nanotube studied in situ by EH.
2. Methods
The DHM method is depicted by an illustration using the calculated electrostatic field from a virtual charged sphere. Let us consider that the charge state of such a sphere can be modulated between a positive and negative state. The only feature required in our experiment is to be able to switch the charge state of the sphere without any other modification of the optical system during the acquisition time. We define two coherent electron waves  passing on the left (l) and the right (r) side of a Möllenstedt biprism which can be overlapped by applying a suitable voltage on the biprism. s corresponds only to the object contribution to the phase (e.g. the charge of the virtual sphere). The resulting interference pattern (i.e. the hologram) contains the phase difference between the two beams
  but also the phase distortions coming from the microscope setup
  . Figure 1(b) presents
  for a simulated positive charge where we added the experimental phase distortions from a microscope setup (projector lens of Hitachi HF3300C and Gatan US1000 CCD camera).
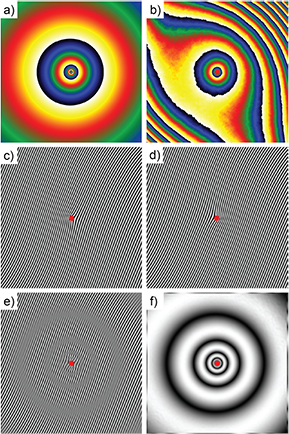
Figure 1. (a) Phase image simulation of a sphere with a positive charge of 100 e (field of view equal to 1 μm). (b) Phase image simulation of the same sphere including experimental phase distortions due to the microscope setup (projector lens and CCD camera). (c) and (d) Simulated holograms for a positive and negative charge respectively. (e) Double exposure hologram (interferogram) corresponding to the addition of the two previous hologram. (f) Electrostatic map obtained from the amplitude analysis of the interferogram in (f).
Download figure:
Standard image High-resolution imageThe intensity of corresponding hologram with spatial wave vector  (figure 1(c)) can be written as:
This hologram displays a fringe deformation coming from the electric field generated by the sphere. The phase difference between the two beams  is usually extracted by Fourier filtering while the phase distortions
  are removed recording a reference hologram in the vacuum or knowing the different contributions to the phase distortions (projector lens, CCD camera,...) [33]. The figure 1(d) shows the same hologram for an opposite charge.
The recorded image using the double exposure method corresponds to a simple addition of the half intensity of both previous holograms where s1 and s2 describe two different charge states (here opposite states with  ):
):
which can be rewritten into:
This simple mathematical description shows that the amplitude of the holographic fringes is modulated by the cosine of the phase difference  between both superimposed states. This associated cosine term
  then corresponds to the envelop function of these holographic fringes and is the origin of the Moirés contrasts. Note that this term does not depend on the holographic fringe periodicity i.e. the applied voltage on the biprism. As depicted figures 1(a) and (e), we can clearly observe the appearance of the Moirés pattern which can be emphasized by the use of a classical Fourier filtering on the fringe frequency (figure 1(f)). This double exposure hologram will be hereafter designed as an interferogram and is the core of the DHM technique.
It is straightforward to observe that the shape of the Moirés pattern within the interferogram only represents the variation of the electrostatic potential (equal to twice the electric field) emanating from the charged sphere, while the phase distortions due to the microscope optic and the camera have been removed. As a consequence, the interferogram contains a quantitative information on the relative variation of the magnetic and/or electric potential between two defined states without any contribution from any other phase terms remaining constant during such variation. The distance between two maxima (white lines) or two minima (black lines) corresponds to a difference of one period of the holographic fringes between both superimposed holograms, i.e. a phase shift of  coming from the presence of an electromagnetic field. For example, in case of magnetic induction only (no changes in the electrostatic contribution), it delimits a magnetic flux equal to
  . For an electric field, this distance represents a variation of the projected electrostatic potential (i.e. integrated along the electron path) of
  . The experimental challenge to perform successfully such DHM experiment relies on the ability to quickly vary and control the electromagnetic field for making an addition of at least two defined states during the acquisition time, keeping the whole optical alignment stable without any change. Microelectronic devices whose state can be tuned in two configurations by an external alternative input of various frequencies are perfect systems to be studied by DHM. Any defined state can then be studied with any frequency.
3. Results and discussion
The major assumption made in the DHM description is the possibility to change and to control the magnetic or the electric state only of the sample under study. In a previous EH experiment we have successfully studied the magnetic field emanating from a hard disk drive (HDD) writer pole [34]. In this previous paper, we developed a novel strategy that allows in situ imaging an operational write pole of a HDD slider in a TEM in normal working conditions. The complete local hysteresis loop on each point of a large area has been obtained while the magnetic signals originating only from the write pole and those of the shield material have been separated and quantitatively analyzed changing the applied current through the write coils. The writing/erasing magnetic field is generated by the current flowing in the coils intended to behave linearly with the applied current without hysteresis when reversing the current to allow for a fast and accurate writing and erasing of data. To precisely tailor the profile of emanating magnetic field, the current carrying coils and bulk magnetic material of the writer are shielded from the disk media. This also insures that the magnetic environment experienced by the media is dominated by the write pole and not from other surfaces of this three dimensional electromagnetic device. These shields are composed of soft magnetic materials to amplify the magnetic field gradients coming out of the write pole (more details on the HDD writer part description in [34]). The slider was carefully prepared to be electrically bounded on a dedicated TEM sample holder. We achieved to make a thin TEM sample reducing the overall size of a HDD slider from 1.2 mm down to 30 μm by mechanically polishing while keeping intact the writer coils and the electrical contact pads. The in situ EH experiment was performed in Lorentz mode on a Cs-corrected Tecnai F20 microscope operating at 200 kV. The Möllenstedt biprism, positioned parallel to the surface of the slider at a distance of about 600 nm, is used to create the interference pattern (applied voltage of 140 V giving a fringes periodicity equal to 2 nm).The resulting electron hologram then allows extraction of the phase shift between the electron beam interacting with the generated magnetic induction field in front of the write pole and a reference beam that passes far from it through an almost field-free region [34]. In this experiment, the electron phase shift is only related to the magnetic induction through the Aharanov–Bohm relation presented in the first part of this article as no electrostatic signal is present.
It is then possible to inject either a positive (figure 2(a)) or a negative (figure 2(b)) DC current through the coil of the pole during EH experiment for phase analysis. The white rectangle on the middle left side is the write pole location. Stating that the magnetic flux generated is symmetric with respect to the current sign, simple half sum (figure 2(c)) and half subtraction (figure 2(d)) of two phase images obtained for opposite currents were performed to access to the intrinsic writer pole magnetic flux and the intrinsic magnetic shield contribution respectively. Using a complete set of excitation currents between −60 mA and +60 mA, we are able to obtain a hysteresis loop along any direction of the magnetic flux being emitted by the pole and the shield for any location in the studied area. More details regarding this experiment as the influence of the weak signal in the reference wave can be found in [34]. Figure 3(a) presents the hysteresis loops of the horizontal component (i.e. perpendicular direction to the surface of the pole) of the projected magnetic inductions for the pole and the shield. They have been calculated from an area located in front of the write pole at a distance of 5 nm from its surface as marked by the orange square on the figures 2(c) and (d). We can clearly observe that the shield contribution presents a rather constant and low value while the pole contribution shows an important variation of the projected magnetic induction. The highest value corresponding to the magnetic saturation of the projected induction at 118 T · nm is reached for an applied current around 20 mA. Finally figure 3(a) demonstrates the absence of remnant and coercive fields that are both expected for a HDD read/write device.

Figure 2. Off-axis electron holography performed on a HDD writing head reported in [34]. ((a) and (b)) Wrapped magnetic phase images obtained for a current injected of +60 mA and −60 mA respectively. ((c) and (d)) Half sum and half difference of the phase images displayed in (a) and (b) revealing respectively the pole and shield contributions.
Download figure:
Standard image High-resolution image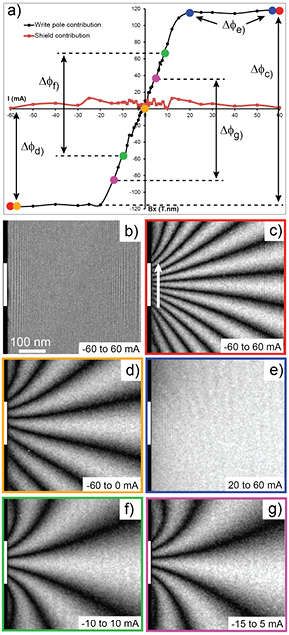
Figure 3. Time-averaged holographic interferometry on the HDD writing head. (a) Hysteresis loop of the horizontal magnetic induction component (perpendicular to the pole surface) for the writing pole (black) and the shield (red). Colored dots and corresponding  correspond to the amplitude signal between the excitation states used in the following interferograms. (b) Raw interferogram corresponding to the sum of two holograms obtained for a
  mA AC square signal. (c)–(g) Amplitude images extracted from interferograms obtained for a (c):
  mA (d):
  mA (e):
  mA (f):
  mA and (e)
  mA AC signal.
Download figure:
Standard image High-resolution imageWhen an AC square current is sent into the coils (instead a DC one), the emanating magnetic field oscillates between the two states defined by the AC square signal. The oscillation of the signal may then be tuned with different current values and frequencies during the acquisition time allowing to obtain interferograms by the DHM method. The amplitude part of these interferograms displayed in figure 3 corresponds to the ones obtained for the AC signal depicted with a color code on the hysteresis loop. The frequency was set at 1 kHz and the acquisition time at 4 s meaning that 4000 holograms were overlapped (2000 for each current value/magnetic state). We start our description with the case of an AC square signal between −60 and +60 mA @  kHz which are the maximal values of injected current. The corresponding magnetic variation is represented on figure 3(a) by
  . The resulting interferogram directly recorded by the CCD camera is displayed figure 3(b). From the extracted amplitude image by Fourier analysis with a circular numerical mask giving a spatial resolution of 6 nm (figure 3(c)), we clearly see that the Moirés pattern fits qualitatively with the intrinsic signal of the pole only as depicted in figure 2(c). This illustrates that the shield contribution, which remains constant (as well as any contant phase distortion coming from the microscope setup), is not contributing to the DHM amplitude and that DHM only reveals the magnetic changes associated to the AC square current. Approximately 10 white lines surrounded by dark lines emanating from the writer part can be deducted. They then correspond roughly to a total magnetic flux of
  i.e. 41.36 10−15 Wb.
If the AC signal is set between −60 and 0 mA ( ), the amplitude of the magnetic variation of the pole contribution is the half of the previous one. We do observe on the corresponding image (figure 3(d)) only 5 white lines from the writer pole giving a total magnetic flux of
  which is also the half of the previous signal. With a AC signal set between 20 and 60 mA (
 ), the two states are in the same saturated part of the hysteresis loop. As a consequence, no magnetic variation arose and the amplitude image of the corresponding interferogram shows a uniform contrast although a large magnetic induction is generated in front of the writer pole. This result confirms the sensitivity of DHM only to the magnetic variation between both different states.
A more detailed analysis on the quantification of the magnetic flux is presented figure 4(a): on this graph are given the profiles extracted along the white arrow in figure 3(c) for the magnetic variations corresponding to  (−60 to +60 mA in red),
  (−60 to 0 mA in blue) and
  (+20 to +60 mA in yellow). As detailed previously, the distance between two minima (dark lines on the amplitude image) corresponds to a phase shift of
  between both superimposed holograms. This phase shift is equivalent to a magnetic flux variation of
  (
( Wb) through a surface perpendicular to the induction defined by a rectangle with a width equal to the distance between minima and an infinite length parallel to the electron beam. Dividing this flux by the distance between minima amounts to obtain the integrated magnetic induction along the electron path (unit T · nm) which is the physical parameter reported in the hysteresis loop presented figure 3(a). From the red curve in figure 4(a), the distance between two minima (centered on the writer pole) is measured to be about 18 nm giving a projected induction variation of 230 T · nm. This variation corresponds to twice the saturated magnetic induction (
 for −60 to +60 mA): we have to divide by 2 to obtain the final value of the saturated induction equal to 115 T · nm. This value is very close to the one measured by classical off-axis EH and reported on the hysteresis loop. Using the blue curve with
  as variation, the distance between two minima is now 36 nm which is twice the previous distance. The corresponding projected induction is then half of the previous one and so in agreement with the value obtained by off-axis EH. The yellow curve (
 ) confirms the absence of real magnetic variation between the two states even in the presence of an important magnetic field.

Figure 4. Profiles of interferograms extracted from figure 3(a) at a distance of 5 nm from the surface (white arrow of figure 3(c)). (a) Profiles extracted from figures 3(c)–(e). (b) Profiles extracted from figures 3(d), (f) and (g).
Download figure:
Standard image High-resolution imageIf we now probe the signal within the hysteresis loop, keeping a constant AC current amplitude of 20 mA, i.e. between −10 and 10 mA ( ) and between −15 and 5 mA (
 ), we define the same magnetic variation than
  since the magnetic saturation is almost achieved for an applied current of 20 mA. On the corresponding amplitudes images figures 3(f) and (g), the same quantification of the emitted magnetic flux is obtained: 5 whites lines for a total magnetic flux of
  . The figure 4(b) shows the nice superimposition of the corresponding quantitative profiles and illustrates the same variation of the projected magnetic induction at various levels equal to 115 T · nm. Some slight differences can however be noticed between the two amplitude images in figures 3(f) and (g) and the one between −60 and 0 mA in figure 3(d). These discrepancies are also visible at the extremities of the profiles. They can be explained studying which parts of the hysteresis loop contribute to the DHM pattern: the first two cases (
 and
and  ) are located on the linear variation of the magnetic flux with the injected current while the last one includes the saturated part. Even if the saturation state is reached, small variations in the magnetic flux can arise with the overflow current and certainly the interaction between the fields produced by the pole and the magnetic shield is different. Both effects may induce the asymmetry while keeping valid the quantification of the magnetic flux that is measured at the vicinity of the pole.
As a brief summary of these results, we claim that DHM allows to probe all part of the hysteresis loop independently, without any complex data treatment and in a qualitative way. In addition, the magnetic response of this device under the application of an alternative current can be studied for different AC frequencies. DHM allows then to study the frequency dependence of the system under consideration, as described below.
The behaviour of the HDD writer head is now studied as a function of frequency with a fixed amplitude signal (−60 and 60 mA). The frequency is tuned from 0.5 Hz to 50 kHz keeping the acquisition time fixed to 4s. Two variations can thus be expected in that case: first at all the signal quality could be modfied with the frequency as more holograms are added in a single interferogram and secondly inductance effect could arise when increasing the frequency thus modulating the magnetic flux. Four different interferograms for four different frequencies are depicted in figure 5: no noticeable modification of the magnetic flux spreading from the pole is observed: the shape shown on the amplitude images (figures 5(a)–(d)) as well as the value of the projected induction deduced from profiles in figure 5(e) remain the sames. We observed only an important decrease of the fringe amplitude close to the write pole for 'high-frequency' excitations ( kHz). This is supposed to be related to our experimental set up (sample holder, source meter and cables) that is not designed for such high frequency experiments producing possible decay of the electrical power and mechanical vibrationss. As it worth noting that a standard HDD writing head is supposed to work at a frequency of 2.4 GHz, a dedicated sample holder for high frequency signals should be used to explore such high frequency domain in order to observe and study local dumping due to the inductance effect.
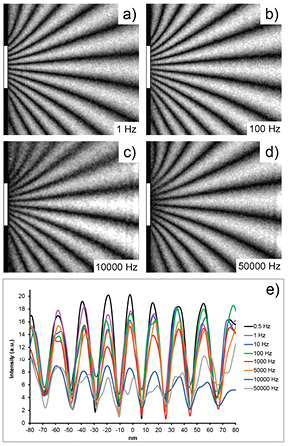
Figure 5. Frequency analysis on the interferograms at a fixed amplitude of  mA. ((a)–(d)) Frequency of 1 Hz, 100 Hz, 10 kHz and 50 kHz respectively. (e) Profiles of interferogram (same as in figure 4 extracted from various frequency measurements).
Download figure:
Standard image High-resolution imageWe performed a last experiment on the HDD writer head changing the applied voltage on the biprism (i.e. the distance between the holographic fringes) keeping the others parameters constant. As expected no effect of the biprism voltage is observed: the periodicity of the holographic fringes does not interfere with the formation of the Moiré pattern.
The figure 6 illustrates the capability of DHM in the observation of other types of signal using other kind of stimuli. In a previous work we studied in situ the field emission process of carbon cone nanoTips (CCnT) [35]. During a particular Electron Holography experiment it turned out that the CCnT broke due to an arc discharge during the acquisition time of an hologram. The amplitude analysis of the resulting hologram (figure 6(a)) evidences a nice pattern corresponding to the electrostatic potential changes when the tip is switched down from +100 V to 0 V (figure 6(b)). On the contrary to the HHD writing head analysis previously described and for which time-average holographic interferometry was performed, that unintentional DHM experiment carried out on the CCnT is a simple double exposure experiment. Nevertheless it clearly evidences the performances of DHM experiments to study devices in which the electrostatic field can be switched between two states. It is however obvious that high AC electric field application in a TEM is a more complex task as it deviates easily the electron beam and is tedious to master particularly within the objective pole pieces of a TEM.

Figure 6. Double exposure holography on a field emitting carbon cone nanoTip. (a) Raw hologram obtained for the emitting CCnT during its collapse. (b) Amplitude extracted from (a).
Download figure:
Standard image High-resolution image
This last remark is in fact a general drawback of the DHM method: it requires to master the combined complexity of both the EH and in situ experimental constraints. Moreover DHM is only limited to the study of perfectly reversible processes for which the two states that are superimposed in the interferogram are fully reproducible. Finally the quantification of the interferogram is realized with a lower spatial resolution compared to the phase image obtained by off-axis EH. In addition, the appearance of the Moiré pattern is linked to a sufficient variation of the signal allowing multiple of  phase shift. This method is therefore not adapted to the study of weak signal variations. However DHM method offers a very interesting alternative to off-axis EH in some cases. The main drawback of traditional off-axis EH experiments is that the electron wave not only experiences phase shifts due to its interaction with the electromagnetic field of the object under consideration (and the surrounding stray fields) but also with the microscope setup (including the microscope lenses and the CCD camera distortions). Therefore, the requested phase information is always mixed with unexpected phase modulation arising from the microscope setup. These artifacts can be removed using a couple of holograms [36]. A second limitation of off-axis EH may occur when no reference area of the studied field of view on the phase image can be chosen to correct the slope arising from the Fourier analysis (misalignment between the center of the numerical mask and the carrier frequency). This problem can be encountered when studying a magnetic wall and its leak field. The third limitation is that, like most of the TEM methods, typical acquisition time for EH experiment is between hundred of milliseconds to ten seconds, limiting the technique to pseudo-static studies. Dynamical studies in TEM require the use of complex instruments ([37, 38]) where electron pulses are generated by photo-emission processes thanks to the use of controlled pulsed laser. Up to now the limited brigthness and poor spatial coherence of the ultrafast photocathodes used in these advanced dynamical-TEMs (DTEMs) does not permit to perform electron interferometry experiments on them. We claim that our new DHM method is addressing (at least part of) all these three points. We showed that phase distortions either coming from the microscope setup are not influencing DHM interferograms. Moreover DHM interferograms can be directly quantified without any needs of other image treatments. They can be obtained between different defined excitation states and used to study the resulting signal variation in terms of amplitude and distribution. Most of all, the possibility to tune the frequency opens the way to emphasis dynamical effects and damping functions such as inductance or capacitance (at the expand of instrumental developments toward high frequency signal injection).
4. Conclusion
We showed that this DHM technique raised the possibility of studying easily and quantitatively a system that is stated in two reproducible magnetic or electrostatic configurations and to extract quantitative information on these configurations without time consuming and complex electron hologram analysis. This technique was demonstrated to overcome traditional EH limitations such as artifacts from the microscope setup or others static constant phase shift contributions. We succeed in analyzing dynamically the behavior of a HDD writing head and studying different part of the corresponding hysteresis loop. Similar analysis could be implemented to study electric fields.
Acknowledgments
The authors acknowledge A Masseboeuf for carefully reading and correcting the paper. The authors also acknowledge the European Union under the Seventh Framework Programme under a contract for an Integrated Infrastructure Initiative Reference 312483-ESTEEM2, the ANR EMMA 12-BS10-0013 project, the support of the French National Research Agency under the Investissement d Avenir program reference No. ANR-10-EQPX-38-01, and the Conseil Regional Midi-Pyrénées, the European FEDER within the CPER program and the Labex NEXT through the MIME project for financial support.