

Abstract
The formation conditions of single magnetic bubbles through in-plane field demagnetization are investigated in an array of Co/Ni circular dots by magnetic force microscopy and compared to micromagnetic calculations. We demonstrate high success rates in nucleating stable bubbles. The efficiency of single bubble formation is found to depend not only on the dot size, material thickness and intrinsic material parameters but also on the bubble nucleation path. Experimental phase diagrams and micromagnetic calculations highlight the influence of the starting in-plane field amplitude and dipolar interactions in stabilizing the bubble. The identification of a systematic procedure for controlling nucleation of single bubbles, multidomain states or a uniform state is important from a technological point of view, opening a path toward the realization of reprogrammable magnonic crystals for the control of spin-wave propagation.
Export citation and abstract BibTeX RIS
1. Introduction
Several numerical analyses and theoretical studies have recently predicted that magnetic soliton states observed in systems with perpendicular magnetic anisotropy (PMA), i.e. bubbles and skyrmions, would have the potential to significantly widen the scope of recording and dynamics of existing spintronic devices [1–5].
Magnetic bubbles, in particular, are spots of opposite magnetization in an otherwise uniformly magnetized perpendicular anisotropy magnetic thin film either with zero [6, 7] or integer topological charge [8], the latter being recently called skyrmion bubbles [9, 10]. On the other hand, skyrmions, characterized by a topological number equal to ±1, were initially predicted [3, 11, 12] and finally observed [13, 14] in thin ferromagnetic films coupled to heavy metals at room temperature where the interfacial Dzyaloshinskii—Moriya interaction (i-DMI) [15, 16] plays a decisive role (differently from skyrmion bubbles that are due to a trade-off between exchange and dipolar field [9]).
Experimentally, bubbles were induced in several extended thin films, by external magnetic field [10, 17], by local magnetic field from a magnetic tip [18], by locally injecting spin polarized current in nano-contacts [19, 20], or in antiferromagnetic coupled multilayers [21]. There are several reports on forming a bubble in confined geometry, i.e. in micro- or nano-structured films. In some of them, the appearance of a bubble was demonstrated in micrometer-sized cylindrical Co [22], Permalloy [23], Ni [24] dots with weak PMA, and in circular dots of L10 FePt dots with large PMA energy [25]. The last work, in particular, studied an array of dots that was initially saturated by means of a large perpendicular field, then, at remanence, fewer than 15% of dots were in a bubble state. Overcoming this lack of reproducibility would give a path in achieving both spin-transfer-torque (STT)-based devices analogous to the vortex based nano-oscillators [3, 26–28] and novel bubble-based magnonic crystals.
In this paper, we report a procedure that enables reproducible nucleation of well-defined single magnetic bubbles in confined dots. The experiments have been performed on an assembly of Co/Ni circular dots, with diameters ranging from 4 micron down to 200 nm, and with thicknesses from 20 to 7 repeats (i.e. 16 nm down to 5 nm). The i-DMI is here negligible for two main reasons: (i) the large thickness of the ferromagnet [3] and (ii) the ferromagnet sandwiched between the same heavy metal (Pt). Micromagnetic simulations are used to qualitatively understand the mechanism of bubble formation and to identify the key ingredients that rule the reproducible magnetic bubble nucleation.
The paper is organized as follows. Section 2 provides the details of the experimental framework. Results and discussions are given in section 3, while section 4 is dedicated to the conclusions.
2. Experimental details
The Co/Ni multilayer is considered as a good candidate in view of STT applications providing several of the requested features, such as low damping, high perpendicular anisotropy at low saturation magnetization, high spin-polarization and moderate magnetization [29–33]. A set of Ta(5)/Pt(10)/[Co(0.2)/Ni(0.6)]n=7,10,15,20/Pt(5) (where the numbers in parentheses are the nominal thickness of the individual layers in nanometers) multilayer was deposited on thermally oxidized Si wafers at room temperature by magnetron sputtering. The magnetic properties of the full films at room temperature were determined by SQUID-VSM. All multilayer films have saturation magnetization MS around 500 ± 50 kA m−1 and PMA K, measured as the in-plane saturation field, around 3.6 ± 0.9 × 10⁵ J m−3.
The [Co/Ni]n films were patterned to circular dots, with diameters ranging from 0.2 to 4 μm, by combining electron beam lithography and ion beam etching. The distance between dots (center-to-center) was set to be four times their diameter in order to have negligible dipolar interactions. The atomic force microscopy and the scanning electron microscopy images indicate that the patterned dots have well defined circular shape down to 400 nm diameter. Magnetic force microscopy (MFM) was used to study the magnetic domain structures of the samples.
In order to form a single bubble state, we tested various field-induced demagnetization methods. In figure 1, we show MFM images obtained on 1.25 μm diameter circular dots made of [Co(0.2)/Ni(0.6)]10 multilayers after AC out-of-plane field demagnetization (figure 1(a)), single in-plane field application (figure 1(b)) and AC in-plane field demagnetization (figure 1(c)). We define the starting (i.e. maximum) field amplitude during the demagnetization process as Hmax. For all types of AC demagnetizations, samples were first saturated out-of-plane, then the field sweep rate was kept as 10 mT s−1 with maximum field decreasing by 0.3 mT at each period. Out-of-plane AC magnetic field provides only a single domain state, i.e. saturated state, with dot moments randomly pointing up or down (figure 1(a)). The absence of checker board phase confirms negligible dipolar interactions among the dots with 5 μm center-to-center spacing. For comparison, full film with same composition and AC out-of-plane demagnetization also leads to a uniformly magnetized state without any strip-out instability [21] because of the large quality factor of our sample,  [6, 25] (see for instance a typical magnetization versus out-of-plane field experimental hysteresis loop in figure 1(d)).
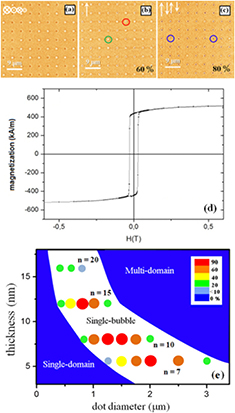
Figure 1. (a)–(c) MFM images of 45 × 45 μm2 array of 1.25 μm diameter [Co/Ni]10 dots after demagnetization under (a) AC out-of-plane field, (b) one 0.4 T in-plane field pulse and (c) AC in-plane field starting from Hmax = 0.4 T. The direction of the applied field is indicated in the left upper corner of the images. The percentage values indicate the ratio of single bubble states over 81 dots. The red, green and blue circles show a single bubble state, single domain state (saturated state) and multi-domain state, respectively. (d) A typical magnetization versus out-of-plane field experimental hysteresis loop for our full film samples. (e) Best percentage of single bubble as a function of the dots diameter and dot thickness for four [Co/Ni]n multilayers with n = 7, 10, 15 and 20, respectively. The color scale indicates the maximum percentage of single bubble, e.g. red corresponds to percentage between 60% and 90%.
Download figure:
Standard image High-resolution image3. Results and discussion
Figure 1(b) shows the MFM images of the dots' magnetic state after application of the 0.4 T in-plane field. Magnetic bubbles (red circle in figure 1(b)) are observed in 60% of the dots while the others are still uniformly magnetized (green circle in figure 1(b)). After a second field sweep in the opposite direction down to −0.3985 T (not shown here), only 5% dots remained as a single domain while 80% of the dots hold a well centered and circular bubble. Further AC demagnetization created a few more bubble nucleations and made each bubble slightly larger, more circular and well settled in the dot center. Figure 1(c) corresponds to the magnetic configuration imaged after AC in-plane demagnetization starting at 0.4 T. The last 15% of dots hold a magnetic configuration which consists of either more than one bubble or a bubble that is not centered and spreads to the dot edge (blue circles in figure 1(c)). We call these various states as a 'multi-domain state'. Because it provides the best success rate, AC in-plane demagnetization was used in our further experiments.
Figure 1(e) plots an experimental bubble nucleation diagram, indicating the highest bubble percentage achieved experimentally after optimizing the demagnetization procedure (see below), as a function of multilayer thickness and dot diameter. The diagram shown in figure 1(e) contains three regions. The two blue regions correspond to the parameters space where only single domain or multi-domain states are observed. Note that the concentric domain (see inset of figure 2(d) and [22, 25]) is experimentally rare in the multi-domain region and is usually reached neither experimentally nor in the micromagnetic simulations after in-plane AC demagnetization. The white region corresponds to parameters space where the bubble can be formed and it is stable. By changing the number n of Co/Ni bilayer repeats, one may tune the thickness, i.e. the influence of demagnetization field, while keeping similar K, MS and exchange strength A [34]. As n increases from 7 to 20 repeats the magnetostatic energy increases and, as a consequence, dot diameter has to be decreased in order to conserve single bubble formation [35]. In general, for a fixed thickness, the dot diameter cannot be too small, otherwise the dipolar fields, coming from the dot volume and from the dot edge, are not large enough to compensate for the cost of bubble domain wall energy. No bubble can be stabilized and the dot remains uniformly magnetized (single domain state). On the other hand, if the dot diameter is too large, the average domain size is such that more than one bubble fits inside the dot (multi-domain state). Besides, as the dot thickness increases, the dipolar fields increase relative to the domain wall energy and the stable bubble diameter decreases. Therefore the single bubble state and multi-domain state can be stabilized for smaller dot diameter in the case of larger thickness. Here, for comparison, the full film average domain width measured after in-plane AC demagnetization is about 300 nm at n = 10 (not shown here). In an assembly of dots, however, a reduced distance between them affects the bubble nucleation process because of the large dipolar field. In those cases, in fact, a chessboard-like antiferromagnetic array is expected [36] being the lowest energy ground state. The phase diagram in figure 1(e) is similar to those already reported in [22, 24, 25], except that we select a specific AC demagnetization procedure to achieve a large percentage of bubble formation.

Figure 2. MFM images of 45 × 45 μm2 array of 1.25 μm diameter [Co/Ni]10 dot array after AC demagnetization under in-plane field with Hmax of (a) 0.35 T, (b) 0.375 T, (c) 0.4 T, and (d) 0.45 T. Inset of (d) shows a concentric multidomain state in 1.75 μm diameter dot observed as a rare event. The percentage values indicate the ratio of single bubble state over 81 dots.
Download figure:
Standard image High-resolution imageIn order to further characterize the role of the demagnetization process on the formation of single domain, single bubble or multi-domain states, we demagnetized the same dot array as in figure 1 by AC in-plane field starting from various Hmax values. MFM images after demagnetization are shown in figures 2(a)–(d). When Hmax ⩽ 0.35 T, all dots keep their initial single domain state, whereas 20% are in single bubble state for Hmax = 0.375 T. At Hmax = 0.4 T, 5% of the dots remain single domain, 80% hold a bubble and 15% are in a multi-domain state. Further increase of Hmax above 0.45 T leads to less than 10% of single domain and single bubble state and most of the dots are in the multi-domain state.
We performed the same experiments as described in figure 2 for various dot diameters from 0.2 to 4 μm. We plot in figure 3(a) a phase diagram indicating the limits of observation of the three magnetic states. As the dot diameter decreases, the value of Hmax which marks the transition between the single domain and multi-domain state increases. A large percentage of bubble state is obtained only in a small region of 'Hmax versus dot diameter' space. So we conclude that, in order to form a large array of single bubbles, one has not only to tune the system parameters to ensure the energy metastability of the bubble as discussed, for instance, in [22, 24, 25], but also to choose the right AC in-plane field demagnetization process. The same feature is observed for the five tested samples with different number of repeats from n = 7–20. In figure 3(b) we plot the region of reliable bubble formation (i.e. the circled region in figure 3(a)) as a function of dot diameter and Hmax/Hkeff ratio for these five samples. Here Hkeff is defined as '2K/MS − MS'. For accuracy we indicated on the figure 3(b) the full film values of MS and K for each sample. For the same dot diameter, the Hmax/Hkeff ratio required to obtain single bubble percentage decreases as n increases.
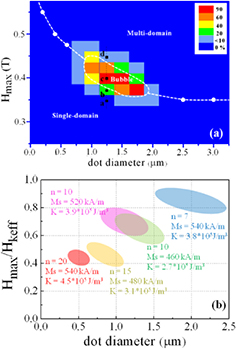
Figure 3. (a) Percentage of single bubble nucleation as a function of the dots diameter and Hmax after AC demagnetization process for [Co/Ni]10 dot array. The color code quantifies the percentage of single bubbles. The four black points marked as 'a', 'b', 'c', and 'd' are in accordance with figures 2(a)–(d), respectively. The color scale indicates the percentage of single bubble. (b) Zones of percentage of single bubble higher than 10% as a function of Hmax and dot diameter for Co/Ni MLs having n = 7 (blue), 10 (green and violet), 15 (orange), 20 (red) repeats. MS and K values are indicated for each sample.
Download figure:
Standard image High-resolution imageMicromagnetic calculations were performed to understand the mechanism leading to each of the three states of the phase diagrams in figure 3, depending on the Hmax amplitude of the AC demagnetizing process. We solved numerically the Landau–Lifshitz–Gilbert equation using three different micromagnetic codes based on finite difference, namely OOMMF [37], MUMAX3 [38], home-made solver [39, 40] obtaining similar results. We tested relaxation considering the equilibrium configuration achieved when the effective field energy and the magnetization are parallel for each computational cell (the algorithm stops for a residual down to 10−8) as well as time evolution. For the effective field, we take into account the exchange, self-magnetostatic and out-of-plane uniaxial anisotropy fields. For the simulations in figure 4, we chose to simulate a 0.8μm diameter dot with n = 15 repeats (i.e. 12 nm) in order to limit computational time while maintaining discretization with1.5 × 1.5 × 12 nm3 and 2 × 2 × 2 nm3 cells. The simulation parameters are exchange A = 1 × 10⁻¹¹ J m−1, MS = 550 kA m−1 and the anisotropy constant K = 3.3 × 10⁵ J m−3. We computed the magnetic configuration while an in-plane magnetic field was set up to Hmax and then decreased back to zero field. Three regimes could be observed depending on the value of Hmax: (i) At Hmax = 0.2 T, the dot magnetization is almost uniform and exhibits only a small tilt as compared with the perpendicular anisotropy axis (figure 4(a)). As the field decreases from Hmax towards remanence, the magnetic state remains uniform and the magnetization goes back along the anisotropy axis (figures 4(b) and (c)). This process leading to the single-domain state is dominated by the exchange energy term. (ii) For intermediate values of Hmax around 0.4 T, the magnetic configuration exhibits a non-uniform spatial distribution of the z-component of the magnetization with both positive and negative region when applying Hmax (figure 4(d)). Indeed Hmax larger than a threshold value (the so-called nucleation field) changes the energy landscape in such a way that the energy barrier that separates the uniform state from the other minima is decreased and the magnetostatic energy balances the exchange energy. In other words, when the in-plane field amplitude is at intermediate values, the system reduces its dipolar field energy by forming a wavy magnetic configuration (figure 4(d)) with lateral variation of the z-component of the magnetization pointing successively in the up and down directions, instead of minimizing the exchange energy by maintaining all spins along a unique tilted direction as in figure 1(b). Then, when the external field is reduced back towards zero, the demagnetization field freezes the magnetic configuration in a bubble state whose shape and diameter depend on the interplay between domain wall energy and dipolar energy. (iii) For Hmax higher than 0.5 T (the so-called saturation field) the bubble state is no longer stable under in-plane Hmax field and the magnetic configuration tends to become uniform with all moments pointing mostly along the in-plane field direction (figure 4(h)). When the in-plane field is reduced, because of the symmetry of the magnetic configuration in figure 4(i), the multi-domain state is then formed as a result of edge magnetic configuration (figure 4(l)). The micromagnetic simulations successfully reproduce our experimental data. Similar calculation results have been achieved for dots with diameter of 0.5 and 1 μm. Based on the simulation findings, one can also understand the evolution of efficient Hmax/Hkeff with thickness for a given diameter dot. Indeed, as the thickness increases, the influence of the dipolar fields increases in the volume of the dot and helps to form the magnetic state in figure 4(d) which further produces bubble at remanence. So the in-plane field required to form this magnetic configuration is decreased as n increases.

Figure 4. Snapshots of the calculated magnetic configuration in a 0.8 μm diameter circular dot, having features of [Co/Ni]15 sample, under in-plane applied field, starting from the uniform out-of-plane state. The black arrow indicates the field H direction. The three rows correspond to the three different values of Hmax leading respectively to (i) the uniform magnetic state if Hmax is low, (ii) bubble nucleation for an intermediate Hmax value, and (iii) multi-domain if Hmax is strong enough to almost saturate the dot in-plane; (c), (g), (l) are MFM images, corresponding to calculated states.
Download figure:
Standard image High-resolution imageWe would like to comment on the nature of the observed bubble equilibrium state. MS and K can be precisely known from magnetrometry on full films, while the exchange constant is not easy to determine experimentally. In the literature, an intermediate value between pure Co and pure Ni exchange constants such as 10−11 J m−1 is generally considered to quantify Co/Ni multilayers exchange [41–44]. Considering the experimental values of 550 kA m−1 for the saturation magnetization and 3.3 × 10⁵ J m−3 for the PMA, in the ideal dot the bubble state has a lower energy than the monodomain state for exchange constant lower than 0.6 × 10⁻¹¹ J m−1 and is unstable for values larger than 0.9 × 10⁻¹¹ J m−1. The scenario changes in the presence of defects at the edges (surface anisotropy) and of local A or K variations which can be very important for bubble stabilization. From the computed energy of the bubble state, it is possible to estimate that a minimum effective field dE/dMz variation of about 5 mT for an exchange constant of 10−11 J m−1 is sufficient to stabilize the bubble as metastable state for long term retention at room temperature. Such a value is much lower than the typical values related to anisotropy distribution in perpendicular multilayer films [45]. Alternatively, the interacting magnetostatic energy can be designed to increase the thermal stability of the single dot device [46].
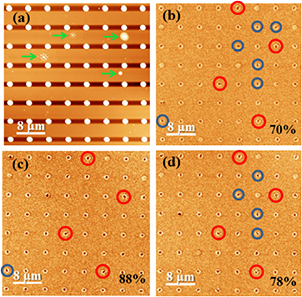
Finally, we tried to identify the reason why 100% success rate has never been reached during our experiments. Anisotropy and exchange distribution as well as the non-zero component of out-of-plane field during the in-plane AC demagnetization must play a role. In particular, the polycrystalline nature of the sputtered [Co/Ni] films often generates misoriented grains, grain boundaries and therefore non-uniform anisotropy distribution [45] which could modify the magnetic processes presented in figure 4. Nevertheless the influence of dot edges has been found to be the main obstacle to 100% success rate. To prove it, three AC demagnetization processes have been performed and MFM images have been taken after each. We used some non-magnetic defects between the dots to always image the same region of the sample. Figures 5(b)–(d) shows between 70% and 88% of dots with a well centered single bubble, 4–5% of the dots are in uniform state and 8–16% contain a bubble that touches one region of the dot edge. We called this state 'broken bubble state'. In diagrams of figures 1(e) and 3(a), it belongs to the more generic multi-domain state. Interestingly, the broken bubbles (when created) are always present in the same dots. The red circles or blue circles in figures 5(b)–(d) indicate the dots containing broken bubble state after each of the three or two over three independent AC demagnetizations, respectively. And even more interestingly, for each dot taken separately, the location at the edge region where the bubble touches the dot edge is the same after each AC demagnetization. In addition, we performed micromagnetic calculations considering non-uniform random distributions of PMA where K varies from 95% to 105% of 3.3 × 10⁵ J m−3. The distributions were obtained by means of a well known Voronoi tessellation algorithm. Results of those simulations did not highlight any change in the formation process and success rate, in agreement with previous reports on the influence of a non-uniform distribution of PMA [47, 48]. Therefore, we can conclude that strong edge defects (probably due to patterning) induce nucleation in these dots or favor propagation of the bubble domain wall up to the edge. Improving the patterning process and removing edge defects would most probably allow us to reach bubble formation success rates close to 100%.
Figure 5. (a) AFM and (b)–(d) MFM images of 40 × 40 μm2 array of 1.25 μm diameter [Co/Ni]10 dot array after out-of-plane field saturation and then AC demagnetization under in-plane field with Hmax of 0.4 T. The green arrow in (a) marks the defects used to locate the same region after each AC demagnetization. The percentage values in (b)–(d) indicate the ratio of single bubble state over 64 dots. The red circles indicate the dots containing a so-called broken bubble state, i.e. a bubble touching the dot edge, after each of the three AC demagnetizations (b)–(d). The blue circles indicate the dots containing a bubble touching the dot edge after two over three AC demagnetizations (b)–(d).
Download figure:
Standard image High-resolution image
4. Conclusions
In summary, we studied the success rate of single magnetic bubble formation in an array of perpendicular anisotropy circular dots. Up to 90% of bubbles can be formed by tuning not only the dot and materials features, but also the bubble nucleation process. We demonstrate that higher success rate would be achieved by suppressing dot edge defects. We use an in-plane field AC demagnetization procedure whose success rate strongly depends on the starting field Hmax. Micromagnetic calculations show that it originates from the existence of a field range for which dipolar field favors a wavy magnetic configuration (figure 4(d)) that transforms into a single bubble state when the field is swept back towards remanence. Understanding how to form a single bubble state in a large array of nano-dots opens the path towards the characterization of bubbles response to rf-fields or spin-transfer torque (analogous to widely reported works on vortex) as well as towards original magnonic crystals.
Acknowledgments
The authors thank D Lacour and S Mc Murtry for help with respectively MFM and e-beam lithography experiments; thank D Ellsworth and J Maclin for the help of English correction. This work was financially supported by FEDER, the Region Lorraine and the Grand Nancy and the bilateral agreement France-Turkey (TUBITAK-CNRS) project (TUBITAK Grant # 114F318, CNRS Grant # PICS42452). The work of VP and GF was supported by the project PRIN2010ECA8P3 from Italian MIUR. GF and OO were also supported by the bilateral agreement Italy-Turkey (TUBITAK-CNR) project (CNR Grant # B52I14002910005, TUBITAK Grant # 113F378) 'Nanoscale magnetic devices based on the coupling of Spintronics and Spinorbitronics'.