

Abstract
Ferroelectrics have been, among others, studied as electroactive implant materials. Previous investigations have indicated that such implants induce improved bone formation. If a ferroelectric is immersed in a liquid, an electric double layer and a diffusion layer are formed at the interface. This is decisive for protein adsorption and bioactive behaviour, particularly for the adhesion and growth of cells. The charge distribution can be characterized, in a simplified way, by the zeta potential. We measured the zeta potential in dependence on the surface polarity on poled ferroelectric single crystalline LiNbO3 plates. Both our results and recent results of colloidal probe microscopy indicate that the charge distribution at the surface can be influenced by the surface polarity of ferroelectrics under certain 'ideal' conditions (low ionic strength, non-contaminated surface, very low roughness). However, suggested ferroelectric coatings on the surface of implants are far from ideal: they are rough, polycrystalline, and the body fluid is complex and has high ionic strength. In real cases, it can therefore be expected that there is rather low influence of the sign of the surface polarity on the electric diffusion layer and thus on the specific adsorption of proteins. This is supported by our results from studies of the adhesion, growth and the activity of alkaline phosphatase of human osteoblast-like Saos-2 cells on ferroelectric LiNbO3 plates in vitro.
1. Introduction
Biomaterials, i.e. natural or artificial materials designed for application in biotechnologies and in medicine, are widely used for replacing irreversibly damaged tissues in the human body. Bone implants, e.g. hip and teeth implants, are frequently applied, but efforts are still being made to improve the healing and the biocompatibility of the implant material.
It is well known that bones are electrically active under mechanical loading, due to the piezoelectricity of collagen [1, 2], the possible ferroelectricity of nanocrystalline hydroxyapatite [3], and the flow of ionic fluids within the bone structure (streaming potential) [4]. The electrical potential in mechanically loaded bone has been linked to the mechanical adaptation of the bone in response to loading [5–7], leading to the suggestion that the addition of an electrically active component (e.g. a coating) to an implant material may improve healing and integration with the surrounding living tissue. Recently, interest has grown in exploiting this phenomenon to develop electrically active ceramics for implantation in hard tissue, which may induce improved biological responses [8]. Both polarized hydroxyapatite, the surface charge of which is not dependent on loading, and piezoelectric ceramics, which produce electrical potentials under stress, have been studied in order to determine the possible benefits of using electrically active bioceramics as implant materials. The polarization of hydroxyapatite has a positive influence on interfacial responses to the ceramic [8, 9]. In vivo studies of polarized hydroxyapatite have shown polarized samples to induce improvements in bone ingrowth [8, 10]. Most of the piezoelectric ceramics proposed for implant use contain barium titanate (BaTiO3). In vivo and in vitro investigations have indicated that ceramics of this kind are biocompatible and, under appropriate mechanical loading, induce improved bone formation around implants [8]. The mechanism by which the electrical activity has a positive influence on biological responses is not yet clearly understood, but it is likely to result from preferential adsorption of proteins and ions on to the polarized surface.
However, a detailed examination of the literature shows that the results of the studies mentioned above are somewhat ambiguous. For hydroxyapatite, the growth of osteoblasts during in vitro tests depends not only on the surface electric charge, but also on the surface roughness and topology [10]. The tests in vivo are sometimes ambiguous, and can differ from the tests in vitro [9]. In most studies, cell growth is favoured by a negative charge on the surface, but some tests have shown that a positive charge is preferred [8]. The (+) surface charge formed by groups on the surface of plasma-treated fluorinated polymers grafted by cysteamine lead to improved cytocompatibility [11]. For ferroelectric (i.e. also piezoelectric) BaTiO3 and its composites, BaTiO3–polyvinylidenfluoride–trifluorethylene [12], TiO2–BaTiO3 [13] and hydroxyapatite–BaTiO3 [14, 15], the results are also somewhat ambiguous. In most of these materials, a negative charge on the surface is preferred for cell growth. Most experiments on piezoelectrics have been done without loading, or with insufficiently controlled loading.

It follows from previous studies that the use of electrically-active ceramics on the surface of implants can bring benefits compared to existing implant materials. Among electrically active materials, ferroelectrics can be advantageous due to their spontaneous polarization and simultaneous piezoelectricity. However, previous studies have not taken into account the fact that the charge at the surface is always quickly compensated (screened) by the opposite charge from the surroundings. Kalinin et al [16, 17] showed that the charge at the surface of polarized BaTiO3 (or the ferroelectric domain) is fully screened at room temperature by the adsorbed charges from the air, so that the charge on the surface is opposite to the charge from the polarization. If a ferroelectric is immersed in a liquid (e.g. tissue fluid), it is obvious that an electric double layer and a diffusion layer are formed on its surface. To the best of our knowledge, there have been no studies about the charge distribution in such a case, except for one recent paper [18]. It was therefore not clear how the spontaneous polarization in ferroelectrics affects the charge distribution in a liquid at the surface of ferroelectrics, and therefore the adsorption of proteins. Ferris et al [18] found by colloidal probe force microscopy that the ion distribution within the double layer in a dilute electrolyte at an ultrasmooth ferroelectric PZT film can be changed by reversing the ferroelectric polarization. If a ferroelectric is exposed to dynamically changing stress (loading), its surface charge is influenced by the piezoelectric effect, and this can additionally affect the charge distribution in the liquid, and also the behaviour of cells in contact with the material.
The charge distribution at the spontaneously polarized ferroelectrics immersed in a liquid can also be characterized, in a simplified way, by the zeta potential (the potential at the 'slipping' plane). The zeta potential and its dependence on pH have frequently been measured on colloidal ferroelectric BaTiO3 particles, because the zeta potential is crucial for the stability of colloidal suspensions. However, the dependence of the zeta potential on the polarity of the surface of poled ferroelectrics has not been investigated until now. Our paper will report on measurements of this type, together with their correlation with the adhesion, growth and the activity of alkaline phosphatase (ALP) of human bone-derived cells on ferroelectric surfaces.
To avoid possible side effects (e.g. grain boundaries, roughness), poled well-polished single crystalline ferroelectric plates with polarization perpendicular to the surface were considered for the measurements. Two materials were taken into account—BaTiO3 and LiNbO3. BaTiO3 is known to be biocompatible, but it has lower stability of the polarization, and Ba2+ ions are transiently leached from the surface to an adjacent liquid [19]. LiNbO3 has good stability of polarization (spontaneous polarization 71 μC cm−2, coercive field 21 kV mm−1, Curie temperature 1160 °C) and it is also chemically stable. Recent studies have shown that LiNbO3 and other related ceramics (e.g. LiTaO3 or lithium sodium potassium niobate) are biocompatible, i.e. promoting the adhesion, growth and other functions of osteoblasts and fibroblasts in cultures on these materials [20–23]. LiNbO3 and LiTaO3 ceramics are also bioactive, i.e. promoting the formation of apatite-like structures on their surface when immersed into simulated body fluid [24]. However, both LiNbO3 and LiTaO3, tested in the form of microparticle powder, were transiently releasing Li+ ions. Lithium is a well-known mood stabilizer clinically applied for treatment of psychiatric disorders. Studies in vitro revealed than in lower doses, lithium acted as cytoprotective, antiapoptotic and preventing the oxidative damage of different type of cells [25–27]. However, at higher doses Li showed opposite effects, i.e. it acted cytotoxically, antimitotically, pro-apoptotically and caused oxidative damage of cells [26, 27]. It can be expected that the release of higher concentrations of Li+ ions is more likely in LiNbO3 in the form of powder than in the form of films or bulk material [24]. As for niobium, it has been considered as a promising non-toxic component of novel beta-titanium alloys (e.g. TiNb), intended to replace potentially toxic aluminum or vanadium present in TiAlV alloys, which are used in current clinical practice as orthopaedic and dental implants [28, 29].
Another important parameter for choosing the material was the price, single crystalline BaTiO3 plates are much more expensive than LiNbO3 plates. Regarding all relevant parameters, LiNbO3 was chosen as a model material for our measurements.
2. Methods
2.1. Samples for zeta potential measurements
Commercial LiNbO3 substrates were used (MTI Corporation, single crystal, optical grade, dimensions 10 × 10 × 0.5 mm3 or Ø76.2 mm × 0.5 mm, two-sides polished, surface roughness <0.8 nm (by AFM), (0001) orientation, poled). The polarity of the surface was determined using the d33 meter (piezoelectric coefficient d33 = ± 23 pC N−1).
2.2. Principle of zeta potential measurements
Zeta potential cannot be measured directly. The most widely used technique for measuring zeta potential is electrophoresis, which is frequently used for suspensions of small particles (<10 μm). However, this technique cannot be used for large surfaces, e.g. for plates or foils. Use is made here of the fact that passing a liquid over the surface by a pressure gradient disrupts the surface charge distribution and creates an electrical potential difference, the streaming potential. If the circuit is closed, a streaming current is formed. The streaming potential or the streaming current is measured, and is converted to the zeta potential using the Helmholtz–Smoluchowski equation (1) [30]
where Istr is the streaming current, ζ is zeta potential, εr is relative permittivity of the liquid, ε0 is permittivity of the vacuum, η is dynamic viscosity of the liquid, a is channel radius, L is channel length and ΔP is the pressure difference.
A streaming cell with a configuration based on the flow between two flat, parallel plates was suggested and constructed [31]. This concept is applied in the commercial SurPASS electrokinetic analyzer for solid surfaces (Anton Paar GmbH) [32], which we used for our measurements.
2.3. Electrokinetic analyzers
We expected a small difference in the zeta potential—if any—and therefore we wanted to evaluate the laboratory-to-laboratory reproducibility. We used three analyzers in three different laboratories. Two analyzers were equipped with an adjustable gap cell (at J. E. Purkyně University in Ústí nad Labem, Czech Rep., and at Anton Paar GmbH, in Graz, Austria), and one was equipped with a clamping cell (at Tomáš Baťa University in Zlín, Czech Rep.). In the adjustable gap cell (figure 1), the gap (0.1 mm in thickness) was formed with either two LiNbO3 surfaces of (+) polarity or with two LiNbO3 surfaces of (−) polarity. In the clamping cell (figure 2), the gap was formed with one LiNbO3 surface with (+) polarity or with (−) polarity, and with standard polypropylene foil as a reference. A 0.001 M water solution of KCl, pH adjusted by a 0.1 M water solution of HCl, was used as the flowing electrolyte.

Figure 1. Scheme of the adjustable gap cell. The electrolyte flows alternately from left to right and back from right to left.
Download figure:
Standard image High-resolution image
Figure 2. Layout of the clamping cell.
Download figure:
Standard image High-resolution image2.4. Cell culture on ferroelectric materials
Ferroelectric single crystalline LiNbO3 plates (10 × 10 × 0.5 mm3 in size) with (+) and (−) polarity on the opposite surfaces were used for the cell culture tests. The plates were sterilized by 70% ethanol for 2 h and inserted into 24-well polystyrene cell culture plates (TPP, Trasadingen, Switzerland; well diameter 1.5 cm), either with (+) polarity or with (−) polarity, exposed on the upper surface. The samples were then seeded with human osteoblast-like Saos-2 cells (European Collection of Cell Cultures, Salisbury, UK, Cat. No. 89050205). Each well contained 28 000 cells (i.e. about 15 000 cells cm−2) and 1.5 ml of McCoy 5A medium (Sigma, USA, Cat. No. M4892) with 15% foetal bovine serum (FBS; Sebak GmbH, Aidenbach, Germany) and gentamicin (40 μg ml−1, LEK, Ljubljana, Slovenia). The cells were cultured for 1, 3 and 7 d at 37 °C in a humidified air atmosphere containing 5% of CO2. The experiment was performed in triplicate. Microscopic glass coverslips were used as a reference cultivation substrate.
2.5. Evaluation of the cell number and spreading
On day 1 after seeding, the cells on the samples were rinsed with phosphate-buffered saline (PBS; Sigma, USA, Cat. No. P4417), fixed with 70% frozen ethanol (room temperature, 20 min) and stained with a combination of two fluorescent dyes, namely Texas Red C2-maleimide (Molecular Probes, Invitrogen, USA, Cat. No. T6008; 20 ng ml−1 of PBS), which stains proteins of the cell membrane and cytoplasm, and Hoechst #33258 (Sigma, USA, Cat. No. 94403; 5 μg ml−1 of PBS), which stains the cell nuclei. Both dyes were applied for 1 h at room temperature. These cells were used for measuring the number and the spreading area on microphotographs taken under an IX 51 microscope, equipped with a DP 70 digital camera (both from Olympus, Japan, objective 10×). The size of the area projected on the material was measured using Atlas Software (Tescan, Brno, Czech Republic). Cells that developed intercellular contacts were excluded from the evaluation. For each experimental group, three independent samples (containing 614–842 cells in total) were evaluated. In the following days, cells stained for β1-integrins and vinculin (day 3) and with Hoechst #33258 (day 7) were used for an evaluation of the cell number and morphology (see below).
2.6. Immunofluorescence staining of molecules involved in the cell adhesion
The cells were stained by immunofluorescence against β1-integrins and vinculin, i.e. molecules participating in cell-substrate adhesion (on day 3 after seeding). The time interval was selected on the basis of the previous experiences. On day 3, the focal adhesion plaques are usually better-formed, more numerous, larger, streak-like, and thus better distinguishable than on day 1, when they are smaller, usually dot-like and less distinguishable from the background of unassembled integrin or vinculin molecules. In addition, the function of vinculin is to stabilize focal adhesion plaques, thus it occurs in more mature plaques after some days of cultivation. The cells were rinsed twice in PBS and fixed with 70% frozen ethanol (room temperature, 20 min), pre-treated with 1% bovine serum albumin in PBS containing 0.05% Triton X-100 (Sigma, USA, Cat. No. X100) for 20 min at room temperature, and then incubated with monoclonal primary antibodies produced in mice, namely anti-human β1-integrins (Merck Millipore, MAB1981) and anti-human vinculin (Sigma, USA, Cat. No. V9131). The antibodies were diluted in PBS to concentrations of 1:200, and were applied overnight at 4 °C. After rinsing with PBS, the secondary antibody, i.e. goat anti-mouse F(ab')2 fragment of IgG (dilution 1:1000), was added for 1 h at room temperature. The secondary antibody was conjugated with Alexa Fluor® 488 (Life Technologies—Molecular Probes, Cat. No. A11017). After incubation with the secondary antibody, the cells were rinsed twice in PBS and evaluated under an epifluorescence IX 51 microscope, equipped with a DP 70 digital camera (both from Olympus, Japan, objective 10×). The concentration of β1-integrins and vinculin were estimated by measuring the fluorescence intensity. For this purpose, 12 micrographs from each sample were taken at the same exposure time. The fluorescence intensity was measured using Fluorescence Image Analyser software (ver. 1.1, 2013, available from http://alice.fbmi.cvut.cz/software/fia). A single colour plane threshold was set on each image to remove the non-protein area from the image data. These threshold and colour plane settings were the same for each image of the protein that was measured. Then the cumulative sum of all pixel intensities was evaluated, and the background intensity of the negative staining control (i.e. cells stained without primary antibodies) was subtracted. The total immunofluorescence intensity of the proteins was normalized to the number of cells in the microscope field. After these microphotographs were taken, the cells were additionally incubated with phalloidin conjugated with TRITC (Sigma, USA, Cat. No. P2141, dilution 1:1000) in order to stain the actin cytoskeleton, and with Hoechst #33258 (Sigma, USA, Cat. No. 94403, dilution 1:200) to visualize the cell nuclei. Both dyes were diluted in PBS and applied for 30 min. The last step was to rinse the samples in PBS. Microphotographs of the vinculin-stained cells were taken under an SPE confocal microscope (Leica, Germany, objective 20×), and pictures of the β1-integrin-stained cells were taken under an IX 51 epifluorescence microscope, equipped with a DP 70 digital camera (both from Olympus, Japan, objective 40×).
2.7. Activity of alkaline phosphatase
The activity of ALP was measured on two samples for each experimental group on day 7 after cell seeding. The cells were rinsed twice in PBS, then the lysis buffer CyQUANT (Life Technologies, Cat. No. C7027, dilution 1:10) was added for 10 min at room temperature. Two sets of microtubes were prepared; one for ALP evaluation (1-Step™ PNPP, Life Technologies, Cat. No. 37621) and the second for quantification of the total protein content (Micro BCA™ Protein Assay Kit, Life Technologies, Cat. No. 23235). The cell lysates were divided into these two microtubes, and the analysis was performed according to the manufacturers' protocols.
2.8. Statistics
The quantitative data for cell numbers are given as Mean ± S.E.M. (standard error of mean). The data for intensity of fluorescence and activity of ALP are given as Mean ± S.D. (standard deviation). The statistical significance of the differences among the experimental groups was evaluated using one way analysis of variance (ANOVA), Student–Newman–Keuls method (p ⩽ 0.05 was considered significant).
3. Results
3.1. Zeta potential measurements
The preliminary measurements carried out at J. E. Purkyně University were not reproducible. We suppose that this could be due to contamination of the surface while the sample was being unstuck from the double adhesive tape by acetone. We therefore decided to use only 'virgin' sample surfaces (optical grade quality, as delivered from the factory) for further measurements.
The results of measurements performed on 'virgin' surfaces at J. E. Purkyně University are shown in figure 3. The zeta potential is more positive at the (+) surface.

Figure 3. Measurements of zeta potential in dependence on surface polarity, measured at J. E. Purkyně University.
Download figure:
Standard image High-resolution imageThe results of measurements performed on 'virgin' surfaces at Anton Paar GmbH are shown in figure 4. Significant and reproducible dependence of the zeta potential on surface polarity was detected. Again, the zeta potential is more positive at the (+) LiNbO3 surface. Zeta potential measured on microscope glass coverslip used as a reference cultivation substrate is shown in figure 4 as well.

Figure 4. Measurements of zeta potential in dependence on surface polarity, measured at Anton Paar GmbH. The measurement of a microscope glass coverslip is shown for comparison.
Download figure:
Standard image High-resolution imageThe results obtained on 'virgin' surfaces at Tomáš Baťa University are shown in figure 5. These results are consistent with the results obtained at Anton Paar GmbH and at J. E. Purkyně University. However, after the LiNbO3 plates were removed and reversed, the zeta potential values fluctuated, and in average the zeta potential on the (+) LiNbO3 surface was lower than the zeta potential on the (−) surface. The same effect was obtained in the first measurement at J. E. Purkyně University after the sample was unstuck from the double adhesive tape by acetone.

Figure 5. Measurements of zeta potential in dependence on surface polarity on 'virgin' surfaces, measured at Tomáš Baťa University.
Download figure:
Standard image High-resolution image3.2. Cell behaviour on ferroelectric surfaces
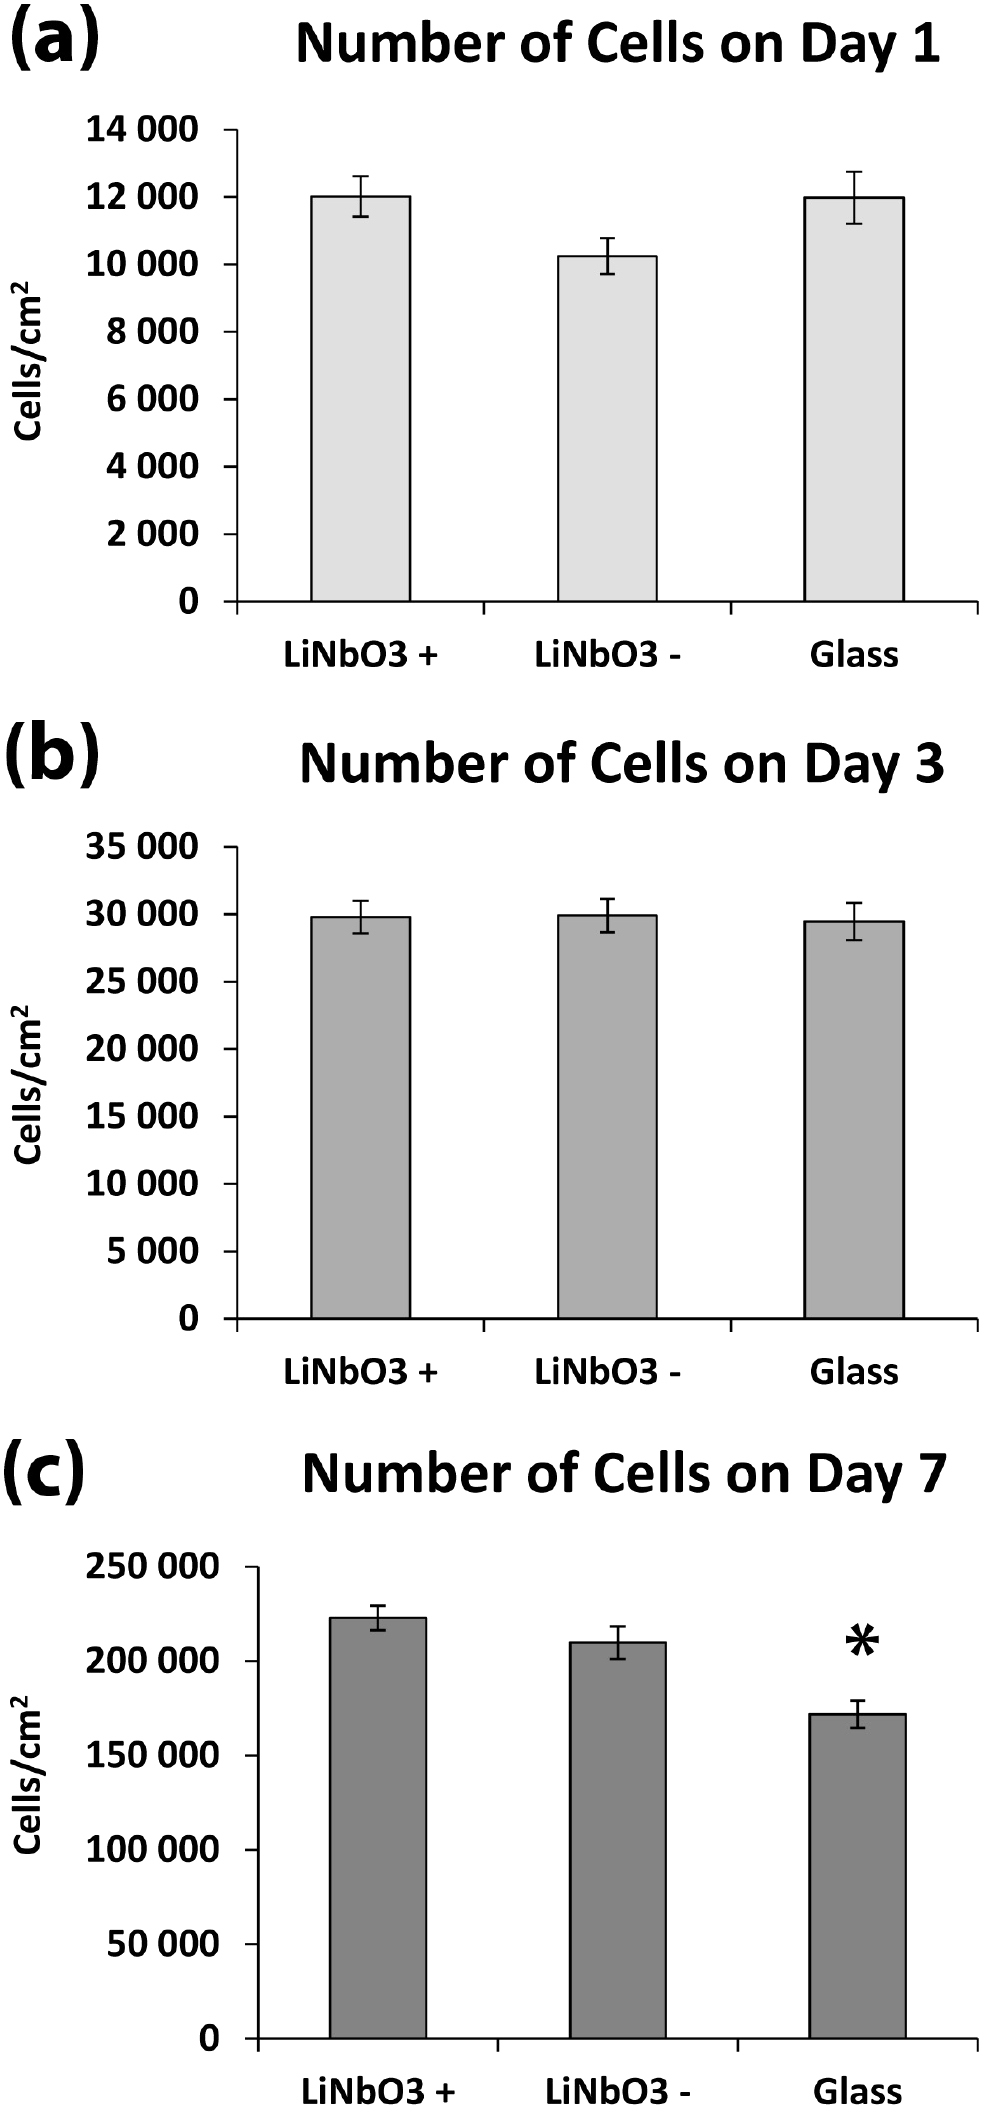
On day 1 after seeding, the human osteoblast-like Saos-2 cells adhered on all tested surfaces, i.e. (+) poled LiNbO3 and (−) poled LiNbO3 and the control microscopic glass coverslips (which are considered as a standard cell culture material) in comparable numbers (figure 6(a)). The average cell number on the (+) LiNbO3 surfaces tended to be slightly higher than on the (−) LiNbO3 surfaces and on glass, but these differences were not significant. The cells on all tested surfaces were well-spread, and were mostly polygonal in shape (figures 7(a)–(c)). However, the cell spreading area, measured on day 1, was significantly larger on both (+) charged samples and (−) charged samples than on the control glass coverslips (figure 7(d)).

Figure 6. Number of human Saos-2 cells on day 1 (a), day 3 (b), and day 7 (c) after seeding on positively () and negatively () charged samples, and on the control microscopic glass coverslips (glass). Mean ± S.E.M. performed in triplicate (in total 36 values for each day and for each experimental group). An asterisk above the glass column indicates an experimental group significantly differing (p ⩽ 0.05) in cell number from both charged samples.


Download figure:
Standard image High-resolution image
Figure 7. Human osteoblast-like Saos-2 cells in 1 d-old cultures on positively charged (a) and negatively charged (b) LiNbO3 samples, and on control microscopic glass coverslips (c). The cells were stained with Hoechst #33258 (blue fluorescence) and Texas Red C2-maleimide (red fluorescence). Olympus IX 51 microscope, objective 10 ×, DP 70 Digital Camera, bar = 200 μm. Cell spreading area of human osteoblast-like Saos-2 cells (d) on day 1 after seeding on charged samples and on a microscopic glass control. Mean ± SEM from 614 to 842 cells obtained from triplicate. An asterisk above the glass column indicates an experimental group differing significantly (p ⩽ 0.05) in cell number from both charged samples.
Download figure:
Standard image High-resolution imageOn day 3 after seeding, the differences in cell numbers still remained non-significant (figure 6(b)). In addition, the β1-integrin- and vinculin-containing focal adhesion plaques and the actin cytoskeleton were well-developed in cells on all tested surfaces. However, the intensity of the fluorescence of the β1-integrins and vinculin was significantly higher in cells on both (+) charged and (−) charged LiNbO3 samples than on the control glass coverslips (figures 8 and 9). Moreover, the differences in cell number became significant on day 7 after seeding (figure 6(c)). The ALP activity measured from cell lysates showed higher activity on a positively charged LiNbO3 sample than on a negatively charged LiNbO3 sample (figure 10).

Figure 8. Immunofluorescence of β1-integrins ((a), (d), (g)) in human osteoblast-like Saos-2 cells in 3 d-old cultures on positively charged ((a)–(c)) and negatively charged ((d)–(f)) LiNbO3 samples, and on the control microscopic glass coverslips ((g)–(i)). The actin cytoskeleton was counterstained with phalloidin conjugated with TRITC ((b), (e), (h)), and the cell nuclei were counterstained with Hoechst #33258 (merged microphotographs) ((c), (f), (i)). Arrows indicate the focal adhesion plaques. Olympus IX 51 microscope, objective 40 ×, DP 70 Digital Camera, bar = 50 μm. (j): the fluorescence intensity measured using Fluorescence Image Analyser software. Mean ± S.D. from 12 microphotographs. An asterisk above the glass column indicates significantly lower (p ⩽ 0.05) fluorescence intensity than on both charged samples.
Download figure:
Standard image High-resolution image
Figure 9. Immunofluorescence of vinculin ((a), (d), (g)) in human osteoblast-like Saos-2 cells in 3 d-old cultures on positively charged ((a)–(c)) and negatively charged ((d)–(f)) LiNbO3 samples, and on the control microscope glass coverslips ((g)–(i)). The actin cytoskeleton was counterstained with phalloidin conjugated with TRITC ((b), (e), (h)), and the cell nuclei were counterstained with Hoechst #33258 (merged microphotographs) ((c), (f), (i)). Arrows indicate the focal adhesion plaques. SPE confocal microscope (Leica, Germany), objective 20 ×, bar = 25 μm. (j): the fluorescence intensity measured using Fluorescence Image Analyser software. Mean ± S.D. from 12 microphotographs. An asterisk above the glass column indicates significantly lower (p ⩽ 0.05) fluorescence intensity than on both charged samples.
Download figure:
Standard image High-resolution image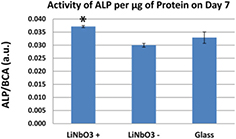
Figure 10. Activity of alkaline phosphatase (ALP) per μg of protein in human osteoblast-like Saos-2 cells in 7 d-old cultures on positively charged () and negatively charged () samples, and on the control microscopic glass coverslips (glass). Mean ± S.D., from four measurements performed on two samples. An asterisk above the column indicates significantly higher (p ⩽ 0.05) activity of ALP compared to the negatively charged samples.


Download figure:
Standard image High-resolution image4. Discussion
Our results for zeta potential measurements obtained in three different laboratories and two different measuring cells performed on 'virgin' surfaces showed that the zeta potential is higher at the (+) surface than that at the (−) surface. However, the zeta potential values fluctuated after the LiNbO3 plates were removed and reversed, and in average the zeta potential was lower on the (+) LiNbO3 surface than on the (−) LiNbO3 surface. It should be noted that even slight contamination can play a role in zeta potential measurements, and only 'virgin' surfaces maintain the intrinsic surface polarity. The measured isoelectric point (pH for zeta potential = 0) is in good accordance with the isoelectric point in suspensions of Er 3+/ Yb3+-doped LiNbO3 nanocrystals in a 0.001 M water solution of KCl [33] (see table 1).
Table 1. A comparison of measured isoelectric points.
| LiNbO3 single crystal (−) side | LiNbO3 single crystal (+) side | Er3+/Yb3+-doped LiNbO3 nanocrystals | |
|---|---|---|---|
| Laboratory | Isoelectric point | ||
| J. E. Purkyně University | 3.7 | 4.0 | — |
| Anton Paar GmbH | 3.7 | 4.1 | — |
| Tomáš Baťa University | 3.9 | 4.3 | — |
| Reference [33] | — | — | 3.4 |
The zeta potential measurements performed on an as-delivered (optical grade) surface are consistent with the colloidal probe force microscopy performed by Ferris et al [18]. Our results and the results of Ferris et al [18] indicate that the electric double layer and the diffusion layer in a liquid at the surface of poled ferroelectrics are influenced by the surface polarity under certain 'ideal' conditions (low ionic strength, non-contaminated surface, very low roughness). However, the suggested ferroelectric coatings (ceramics, films) on the surface of implants for solid tissues—bones, teeth, are far from ideal. The coatings are rough, polycrystalline, and the body fluid is complex and has high ionic strength (0.15 M). In this real case, it can therefore be expected that the influence of the sign of the surface polarity on the electric diffusion layer, and thus on the specific adsorption of the proteins, is low. It is probable that important factors for the biocompatibility of ferroelectric coatings are their piezoelectricity (surface charge depending on loading) and their surface polarity, regardless of its sign.
The cell experiment results indicate that the surface charge (i.e. irrespective of the positive or negative charge) has a great impact on cell adhesion and on the spreading area of cells. Adhesion and spreading are crucial for subsequent cell proliferation and differentiation. It seems that the type of charge (positive or negative), makes no difference; both positive and negative charges are beneficial for cell adhesion and subsequent growth. Similar results were obtained on hydroxyapatite and composite hydroxyapatite-barium titanate ceramics. The adhesion and growth of human osteoblast-like Saos-2 cells or mouse osteoblast progenitor MC3T3-E1 cells were higher on poled surfaces than on unpoled surfaces, irrespective of their surface charge [9, 14]. Positive and negative polarization also increased the ingrowth of osteoblasts inside hydroxyapatite scaffolds implanted in vivo into rabbit femur condyles [10].
However, the number of initially adhered cells in our study tended to be slightly higher on (+) poled LiNbO3 surfaces than on (−) LiNbO3 surfaces, though this difference was not significant. Moreover, the activity of alkaline phosphatase was significantly higher on positively charged surfaces than on negatively charged surfaces. This might be explained by the assumption that the proteins mediating the cell adhesion, e.g. vitronectin and fibronectin, which are spontaneously adsorbed on the cultivation substrate from the serum supplement of the culture medium, are more easily adsorbed on positively charged material surfaces, due to the negative charge of these proteins. In addition, these proteins are adsorbed in an advantageous geometrical conformation resembling the physiological conformation of these proteins. Thus the bioactive sites in these molecules (e.g. specific amino acid sequences such as RGD) are accessible to the cell adhesion receptors (for a review, see [34]). On macroporous hydrogels based on 2-hydroxyethyl methacrylate (HEMA) copolymers, higher population densities of rat bone marrow stromal cells were obtained on positively charged hydrogels than on negatively charged hydrogels and on hydrogels carrying both charges [35]. A poly(ethylene glycol)-diacrylate hydrogel incorporated with positively charged 2-(methacryloyloxy)ethyl-trimethylammonium chloride (MAETAC) increased the protein adsorption to the hydrogel proportionally to the concentration of MAETAC, and also increased the adhesion, proliferation and activity of ALP in osteoblast progenitor MC3T3-E1 cells on the hydrogel [36]. Positively charged hydrogels also promoted the adhesion, growth and differentiation of neural progenitor cells [37]. However, several studies have reported better adhesion, growth and differentiation of osteogenic cells on negatively charged surfaces, e.g. human foetal osteoblast cells on titanium coated with electrically polarized hydroxyapatite [38] or MC3T3-E1 cells on porous hydroxyapatite scaffolds [39]. The negatively charged surfaces also promoted hydroxyapatite nucleation and bone matrix mineralization, which was explained by the attraction of Ca2+ ions to these surfaces, followed by the attraction of negatively charged ions such as , and ([10]; for a review, see [8]). Thus, the effects of positively and negatively charged surfaces on the cell behaviour are probably dependent on the type of material, and on other physical and chemical properties of its surface (e.g. roughness, topography, wettability), and also on the cell type, cultivation procedure and many other factors, including the amount of surface charge. For example, positively charged polylysine incorporated into poly(ethylene glycol) diacrylate increased the adhesion, growth and differentiation of neural progenitor cells only up to a concentration of 2 wt.%, and then the cell activity stagnated or decreased [37].


5. Conclusions
(+) and (−) poled ferroelectric single crystalline LiNbO3 surfaces differed in zeta potential under 'ideal' conditions (low ionic strength, non-contaminated surface, very low roughness). The zeta potential at a (+) surface was higher than that at a (−) surface. Both poled surfaces supported the attachment, spreading, formation of focal adhesion plaques, growth and the activity of alkaline phosphatase in an extent similar to or higher than the control microscopic glass coverslips. These effects, particularly the initial cell attachment and the activity of alkaline phosphatase, were slightly more apparent on (+) LiNbO3 surfaces.
Acknowledgments
This work has received financial support from Czech Science Foundation grant No. 15-01558 S. M Lehocký would like to express his gratitude to the Ministry of Education, Youth and Sports of the Czech Republic (Project No. LO1504).