

Abstract
Developing arrays of parallel microplasma jets is an attractive route to scaling the area available for the treatment of surfaces with low temperature plasma. Increasing the packing density of the arrays may lead to electrical and gas kinetic jet–jet interactions, but previous work has focused almost exclusively on electrostatic coupling between the jets. Chemical interactions ('crosstalk') have received considerably less attention. We report here the results of an investigation of chemical crosstalk in 4 × 4 arrays of microplasma jets, produced in flowing helium at atmospheric pressure. Oxidation damage to an Escherichia coli lawn serves as a diagnostic of the spatial distribution of molecular radicals and other reactive plasma species, produced at the plasma jet/ambient background interface or between the jets, and incident on the surface. Spatial maps of bacterial inactivation by the microplasma jet array for 20 s show the destruction of E. coli at distances as large as 2.7 jet diameter from the nearest plasma perimeter, compared to typically less than 0.5 jet diameter in the single jet case. Extending to 30 s of plasma exposure leads to destruction of the entire bacterial sample. This 'action at a distance' effect, the production of long-lived species such as O, O2(a1Δg) and O3 that are responsible for bacterial deactivation, peaks along a line bisecting columns and rows of plasma jets. The data illustrate the synergistic effect of adjacent jets on off-axis formation of reactive species, and show that the chemical and biological impact of an array cannot be inferred from the plasma chemistry of a single jet.
Export citation and abstract BibTeX RIS
1. Introduction
Low-temperature atmospheric-pressure gas plasma jets are being studied extensively because the richness of their reaction chemistry is of considerable value to several applications of societal importance such as healthcare, environment remediation, and nano-scale fabrication [1–3]. A significant obstacle to the wider utility of plasma jets, however, concerns the cross-sectional area of a single jet, which is typically limited to less than 5 mm2 [4, 5], whereas medical treatments, for example, require effective coverage areas of at least 100 cm2 [6]. Parallelizing multiple atmospheric-pressure plasma jets in an array has led to stable operation of one- and 2D arrays having cross-sectional areas up to 20 cm2 [6–13] but efforts to place jets in close proximity to one another have often met with intrinsic and complex interactions among the individual plasmas. It has been known that electrostatic repulsion between adjacent plasma jets leads to jet divergence, influenced further by dynamics of the flowing gas and photolytic ionization [6, 14–16]. To date, studies of jet–jet coupling have focused almost exclusively on electrostatic coupling [9–18] and considerable progress has been made in understanding the dependence of such coupling on the inter-jet spacing (pitch) in relation to the jet diameter, the flowing gas field, the axial electric field, and the magnitude of the radial component of the local electric field [14–16, 19].
A fundamental question that has not been addressed previously is the degree to which the plasma chemistry initialed by an array of jets can be described as that arising from the superposition of individual jets acting independently. In other words, is there a significant chemical interaction between plasma jets to be included in the analysis and design of plasma jet arrays? The primary goal of the study reported here is the examination of chemical crosstalk between adjacent jets in a well-collimated array of 4 × 4 atmospheric pressure microplasma jets, with the reaction chemistry characterized by means of spatially resolved inactivation of an E. coli lawn on agar plates. The experimental and computational results demonstrate that the physical contact of a jet with the surface under treatment is not necessary, and the gas phase chemistry cannot be described simply as the sum of individual jets.
2. Experimental methods
2.1. Atmospheric pressure plasma jet arrays
A brief description of the design and performance of the microplasma jet arrays employed in these experiments has been published previously [20], but a more detailed account is given here. End-on and plan views of the structure of a 4 × 4 array of microplasma jets are presented in panels (a) and (b), respectively, of figure 1. Fabricated in a flexible silicone polymer, this array structure has an overall volume of 10 × 10 × 4 mm3. For all of the experiments reported here, the microchannel diameter (Dc) and pitch (center-to-center spacing) along the vertical coordinate (Lco) were fixed at 355 μm and 1 mm, respectively. However, the channel pitch along the horizontal coordinate (Lcp) was varied between 0.5 mm and 2 mm, which corresponds to jet packing densities in these arrays of 60–240 cm−2 in the plane defined by the microchannel exit apertures. Since the diameter of the electrode wire is 255 μm, the distance from an electrode to the wall of the nearest microchannel is 195 μm. In view of the microchannel separations (pitch) mentioned above, one concludes that the radial expansion of the bactericidal effect arising from a single jet is unlikely to perturb that produced by an adjacent plasma column if jet–jet interactions are negligible.

Figure 1. Design and operation of a 4 × 4 array of low temperature microplasma jets: (a) end-on view of the array, illustrating several dimensions of the structure and one set of electrodes oriented parallel to the plane defined by the microchannel apertures; (b) top view of the array, as well as a few of the electrical connections; (c) photograph of a 4 × 4 microplasma array exiting from the assembly (at top) and impinging on an electrically-grounded, agar plate. The reflection of the jets in the plate is evident, and the He gas flow through each microchannel was set at 0.625 slm. The applied voltage to the electrodes had an RMS value of 1 kV at 23 kHz.
Download figure:
Standard image High-resolution imageResearch grade helium served as the feedstock gas and the flow rate was maintained at 0.625 standard liters per minute (slm) throughout the experiments. Powered by a 23 kHz sinusoidal voltage having an RMS magnitude of 1 kV, the array was operated with all plasma jets ignited (although the capability for individually addressing the jets is available), and the array was positioned such that the microchannel exit plane was 4 mm from an agar plate lying within a 6 cm diameter Petri dish. Panel (c) of figure 1 is a photograph of the 4 × 4 array in operation and impinging on the agar plate which was electrically grounded. The jets are observed to be uniform in cross-section from jet-to-jet, and a flattening of each plasma plume as it arrives at the agar plate is evident. While electrostatic interactions among different plasma jets is inevitable, the images obtained of the arrays tested throughout this work (such as that of figure 1(c)) suggest that their influence on the collimation characteristics of these dense microplasma jet arrays appears to be minimal.
2.2. Diagnostic of reaction chemistry
Classical plasma diagnostics are capable of measuring absolute concentrations of reactive species from non-equilibrium atmospheric pressure plasmas, for instance nitric oxide (NO), hydroxyl (OH) and atomic oxygen (O) often with laser-based diagnostics [21–24]. It is however neither practical nor possible at present to measure the absolute concentrations in a plasma that drive a biological or materials process of interest. In fact, at least some of the species responsible for a specific plasma-initiated treatment are frequently not identified. For many applications of atmospheric plasmas, it appears that the efficacy of the process is often facilitated synergistically by multiple plasma species [1]. In short, the identities of the species underlying the plasma processes of greatest interest, and the threshold number densities required to drive a specific process, are often unknown [1]. As a result, a focus on one or a few reactive plasma species that may be accessible optically, but without clear application context, is of limited scientific and practical value.
An unconventional and novel diagnostic is therefore needed to account for both the synergy among different plasma species and the context of important applications. For biomedical effects of atmospheric pressure plasmas, one such diagnostic was reported with bacterial mutants of which key repair genes against damages to DNA and lipid as well as oxidation damages are knocked out [25]. Plasma inactivation of these bacterial mutants in comparison with that of their wild type could then be used to contrast out relative importance of different plasma species. This and other studies have demonstrated oxidation stress as a key mechanism for atmospheric plasma induced bacterial inactivation [26, 27]. It is therefore opportune to use bacterial inactivation as a novel diagnostic of reactive oxygen species (ROS) of plasmas and also of whether plasma ROS concentrations may have exceeded a threshold for bacterial killing, even if this threshold concentration may still be numerically unknown. For investigation of chemical coupling of individual plasma jets in an array, this method offers an important advantage of spatial resolution by using a lawn of bacterial cells as the substrate to the array of plasma jets, as used previously for the case of single plasma jet [28].
Each sample treated by the arrays is a lawn of the bacterium E. coli K12 prepared on a 6 cm diameter Petri dish with an initial cell concentration of ~1.2 × 105 cm−2. Such a large cell density is useful in order to observe both the antibacterial effects of individual plasma jets, as well as jet–jet interactions. Bacterial inactivation is quantified by transfecting the E. coli K12 cells with green fluorescence protein (GFP) Sox-promoter plasmid. Sox is a gene that prevents oxidation by hydrogen peroxide, and its expression via its promoter plasmid is indicated by GFP fluorescence. Cell transfection with GFP promoter follows the standard protocol [29] and fluorescence produced when transfected cells are photoexcited at 483 nm (with a filtered lamp) serves as a measure of the active E. coli population. Extinction of the green fluorescence, however, is an indicator of bacterial inactivation by any chemical or physical process [30]. Because GFP-transfected bacteria are weaker than their non-transfected counterparts, experiments were also conducted in which normal E. coli K12 cells were treated with the microplasma arrays. Microscopic images of the treated samples show a clear contrast in gray scale between those areas where the bacteria are inactivated and those in which they are not.
3. Results and discussions
3.1. Electrical and thermal characteristics
Electrical characteristics of the arrays are illustrated in figure 2 for horizontal microchannel pitch values of Lcp = 0.5, 1.0, and 2.0 mm. Current and voltage waveforms, shown in figure 2(a), exhibit a single current pulse that quickly follows the zero crossing preceding the positive half-cycle of the driving voltage. Similar behavior is not observed during the negative half-cycle of the voltage waveform, a result attributed to the asymmetric arrangement of the power electrodes of figure 1(b). The positive slope of the voltage-current (V–I) characteristics of figure 2(b) indicates a modest electrical conductivity of the microplasmas, and reflects the operation of the array discharges in the abnormal glow mode [31]. Measurements of the power dissipated by the array find that over 700 mW is consumed by the 16 channels for an RMS current of 0.32 mA. These values contrast with the considerably larger currents drawn by a single jet with a cross-sectional area comparable to the composite area encompassed by the array [19], suggesting more effective coupling of input electrical power into plasma production and sustainment. In turn, this indicates an electrical coupling either through charge storage on the capacitive electrode structure of figures 1(a) and (b) or through a shared use of seed electrons among adjacent microplasma jets.
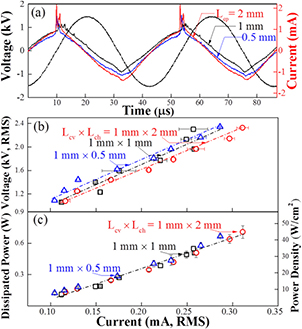
Figure 2. Electrical characteristics of the plasma jet array of figure 1 when the microchannel pitch along the horizontal axis of figure 1(a) (Lcp) is 0.5, 1.0 and 2.0 mm: (a) voltage and current waveforms; (b) voltage-current characteristic and (c) current dependence of the power dissipated in the 16 jet array.
Download figure:
Standard image High-resolution imageThe microplasma jet array can run continuously for over 60 min without adverse influence on the reproducibility of electrical characteristics of the microplasma jet array. Electrode temperature and the temperature of the plasma plume near its contact point with the bacterial lawn were found to remain at room temperature (data not shown) for over 60 min. Together with sub-wattage power dissipation (figure 2(c)), these results confirm that microplasma jets in the array of figure 1 are non-equilibrium and nonthermal. As a result, the effects of the plasma jet array on the downstream bacterial lawn are also nonthermal.
3.2. Crosstalk in reaction chemistry
Figure 3 is a series of optical micrographs representative of the GFP fluorescence images recorded when Lcp (microplasma jet pitch along the horizontal coordinate) = 1 mm. The sample surface area viewed in panels (a)–(d), 880 × 760 μm2, is larger than that occupied by four microplasma jets and the outlines of the jet positions in figure 3(b)–3(d) are indicated by the dashed white circles. Figure 3(a) is a fluorescence image of the control (gas flow on and plasma off) E. coli lawn, and panels (b)–(d) illustrate the effect of exposing the E. coli lawn to the microplasma array for 1, 2, and 3 s, respectively. The darker regions in these images are those in which the E. coli bacteria have been deactivated. After 1s of treatment (figure 3(b)), the deactivated region is approximately the same in area as the jet cross-sections themselves. When the treatment (exposure) time is increased to 2s, however, the deactivated region expands considerably beyond the jet cross-section, giving rise to areas of cell destruction lying along lines connecting the jet axes. Raising the exposure time still further to 3s results in the deactivation region increasing to ~9 times the cross-sectional area of any single jet. If jet–jet interactions are negligible, the cell destruction region is not expected to extend more than 40–50% in diameter beyond that of an individual jet [28]. Our experiments, and those of others, with a single jet confirm this conclusion [27, 32].

Figure 3. Optical micrographs of GFP transfected E. coli samples transfected before and after exposure to the microplasma jet array; (a) control; (b) exposure of 1 s; (c) 2 s exposure, and (d) 3 s of exposure to the array. In (b)–(d), the locations of the jets within the field of view are indicated by dashed white circles. Panel (e) is an optical microscope image of a GFP-transfected E. coli sample after a 5 s exposure, confirming bacterial inactivation over the entire portion of the surface defined by the array (the light brown color indicating the area of deactivated E. coli cells and the dark brown the area of the living cells). In recording this image, the surface was not illuminated at 483 nm. The inset is a fluorescence image of the upper left-hand corner of a 483 nm-irradiated region of the same sample, demonstrating that the GFP fluorescence images provide an accurate map of the spatial distribution of active E. coli cells. For these images, the microchannel pitch along both orthogonal coordinates was set at 1 mm (i.e. Lcp = Lco = 1 mm).
Download figure:
Standard image High-resolution imageAnother aspect of figure 3 that should be mentioned is the appearance of small, circular areas of cell deactivation that are surrounded by a region of living E. coli cells but are remote from any microplasma jets (marked with a centered red circle in figures 3(c) and (d)). Lying almost precisely at the geometric center of a group of four jets in figure 3(d) (marked in a red circle), for example, this phenomenon is unexpected but reproducible. Because of the centrality (relative to the jet positions) of this circular region of cell deactivation, gas flow effects are presumed to be responsible. Specifically, the fluid dynamics of the flowing He gas in the confined region bordered by four plasma jets gives rise to a quiescent, localized area in which the buildup of long-lived excited species can occur. It is equally possible however that chemical reactions remote from any plasma jets and secondary to those taking place within the plasma jets may have been facilitated, for example OH radicals being converted to H2O2 through 2OH + He → H2O2 + He away from the jets. Regardless the relative importance of a simple buildup of long-living species or secondary production of reactive species away from the microplasma columns, it is clear that the array of multiple microplasma jets facilitates strong coupling of reaction chemistry of individual microplasma jets and that such chemical coupling could lead to different type of reaction chemistry in the remote regions to that taking place in the columns of microplasma jets. Similar behavior in a different geometry and over a larger surface area will be discussed later in connection with figure 5.
In an effort to confirm the reliability of the GFP fluorescence images as an accurate indicator of cell inactivation, images of GFP-transfected cell lawns exposed to blue-green (483 nm) radiation have been compared to those of identical samples for which the transfected bacteria were not photoexcited. One such comparison is presented in part (e) of figure 3. Both of these images were recorded after 5s of exposure of the E. coli lawn to the 4 × 4 microplasma array, and microscopic examination shows the entire treatment field to be free of active cells. The larger image of figure 3(e) is an optical micrograph of the sample in the absence of visible illumination, while the inset shows only a portion of the fluorescence generated when the sample is irradiated at 483 nm. As indicated by the white square in the figure, only the upper left-hand corner of the microplasma treated area of figure 3(e) is given by the inset but this suffices to demonstrate that the two spatial maps are virtually identical.
As noted earlier, experiments similar to those of figure 3 were conducted with normal (non-transfected) E. coli K12 cells because of the relative frailty of the GFP-transfected bacteria. Exposed samples were imaged over an area of 6 × 6 mm2 by conventional light microscopy, and figure 4 is a false color image acquired after an E. coli K12 lawn was exposed to the 4 × 4 array for 20 s. Despite the increased resistance of the non-transfected cells to the plasma array, the area of cell inactivation associated with each jet is as much as a factor of eight larger than the jet cross-sectional area. Furthermore, evidence in figure 4 of jet–jet interactions in the cell inactivation process is clear.
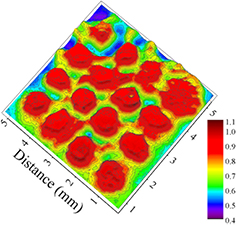
Figure 4. False color image of a lawn of E. coli K12 cells that were exposed to the 4 × 4 He microplasma array for 20 s. These E. coli cells were not transfected with GFP. The areas in red indicate effective bacterial deactivation and the areas of other colors indicate ineffective or little deactivation.
Download figure:
Standard image High-resolution imageAll of the data presented thus far pertain to arrays for which the microplasma jet pitch along both the horizontal and vertical coordinates was set to 1 mm. If, however, the spacing between the jets is increased within either the rows or columns of the array, spatial modulation of the microplasma-initiated chemistry is observed readily. As an example, figure 5 is a false color image similar to figure 4, and representative of those observed when the center-to-center spacing of the rows is set to 2 mm. This particular spatial map was recorded after 20 s of exposure of the E. coli substrate to the array, and the positions of the 16 jets in the array are marked with the dashed white circles. The deactivation of E. coli cells over large swaths of substrate area that are well-removed from the nearest row of jets is now quite vivid (as indicated by the red regions of the image). Before discussing these results in more detail, it should be noted that increasing the plasma treatment time to 30s results in the complete deactivation of all bacteria on the agar plate.
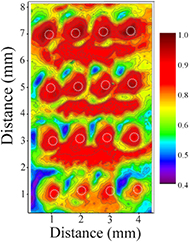
Figure 5. False color image similar to that of figure 4 but for a 4 × 4 array in which Lcp has been increased to 2 mm and the plasma exposure time remains 20 s. The positions of the 16 jets are indicated by dashed circles.
Download figure:
Standard image High-resolution imageThe small, essentially circular, areas of cell deactivation (discussed earlier with regard to figure 3) are also apparent in the image of figure 5 but the secondary areas of cell destruction (between rows of microplasma jets) are of much greater extent and interest. It must be noted that the deactivation of cells in figure 5 is not continuous along the rows of plasma jets, and yet continuous areas of inactivated cells lying between the rows of jets are observed. This phenomenon appears to have not been reported previously but confirms the existence of significant coupling of reaction chemistry. It is of interest to note that there are areas of ineffective deactivation between adjacent jets in the horizontal rows of jets. In the vertical direction, the jet-to-jet distance is twice as much as that in the horizontal direction and as such the buildup of long-living reactive species should be less between jets in a column of jets than in rows of jets. Yet, the deactivated areas between rows of jet (in the vertical direction) are larger and with darker color as compared to those in the narrower gaps between two horizontal jets. In comparison with figure 4, results in figure 5 offer further support to secondary reactions away from the jets themselves. These results are critical to the future of microplasma jet arrays and their use for processing substantial surface areas (>a few cm2).
3.3. Possible crosstalk pathways
The results of figure 5 are counterintuitive to the presumption that proximity to the plasma jet is necessary if significant bacterial inactivation is to occur. Rather, the data acquired in these experiments demonstrate that microplasma jets are capable of not only deactivating bacteria at distances approaching three jet diameters from the nearest plasma but also that the bacterial deactivation process proceeds most quickly away from the jets.
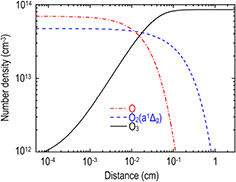
As discussed briefly earlier, one possible mechanism responsible for this 'action at a distance' appears to be the diffusion of long-lived species produced with or near the plasma columns. Although the radiative or collisional lifetimes of singlet delta oxygen (O2(a1Δg)) and helium metastable atoms (He*), for example, have been measured to be 30 ms [33] and 1–5 μs [34], respectively, little has been reported in the literature of the direct measurement of the diffusion distance of these and other species in the effluent region of atmospheric pressure helium plasmas. By contrast, atmospheric He–O2 plasmas have been numerically studied extensively and several have been validated experimentally [14, 31]. In gas phase chemistry, the distance over which the number density of a given species declines from its peak value by two orders of magnitude is often designated as the effective diffusion length (EDL) [35]. Within the microplasmas, the diffusion lengths for O, O2(a1Δg) and O3 are found with a 1D fluid model to be 230–290 μm, and those for charged species are no more than a few μm [35]. In the regions of cold ambient gas outside the microplasma perimeters, however, the EDL values are expected to be considerably larger because the rates of collisions between species produced in the plasmas drop precipitously. In this regard, our 1D fluid model [35] has been applied to simulating the plasma dynamics and chemistry of a radio-frequency (RF) atmospheric plasma in a He–O2 gas mixture, produced by a discharge structure having an electrode gap of 2 mm and an effluent region 3 cm in width. Given that the spaces in the jet array lying between the plasma columns is occupied by helium and air, we simplify the modeling of the effluent region with a He–O2 mixture. For a dissipated power of 40 W cm−2 at 13.56 MHz and a O2/He ratio of 0.5%, conditions identical to those described previously [35], the concentrations of O2(a1Δg), O and O3 were calculated as a function of distance into the effluent space from the plasma boundary, and the results are illustrated in figure 6. Note that the diffusion lengths for O2(a1Δg), O and O3 are found to be 9.7 mm, 1.3 mm and >30 mm, respectively, suggesting that reactive oxygen species are, indeed, able to traverse the jet–jet distance of 0.5–2 mm of figures 3–5. Simulations more specific to the array of plasma jets under study are certainly feasible, but the results of figure 6 are relevant to the geometry and operating conditions for the plasma columns because factors affecting electron kinetics (e.g. power density, frequency) influence the effluent region considerably less than the plasma.
Figure 6. Concentrations of reactive oxygen species as a function of distance into the effluent region of an atmospheric He + O2 plasma sustained at a RF power density of 40 W cm−3. The O2 concentration is 0.5% of the He + O2 mixture.
Download figure:
Standard image High-resolution image
In addition to the considerations discussed above, it is known that oxygen atoms are an important plasma agent for bacterial and protein deactivation [27, 36], and that their production is largely the result of the dissociation of O2 by electron impact [24]. The off-axis presence of long-living helium metastable atoms and molecules allow for Penning ionization among themselves and with impurity nitrogen to generate a modest amount of electrons away from the jets [35]. In the presence of a moist downstream sample such as the case studied here, production of O and OH by a single jet is linked to each other with the maximum O concentration found near the perimeter of the jet [37]. The availability of off-axis electrons, as discussed above, allows oxygen atoms to be produced further away from plasma columns. This may be responsible for the off-axis maxima of bacterial inactivation in figure 5. In addition, the destruction of oxygen atoms to form O3 (O + O2 → O3) and that of OH radicals to form H2O2 (2OH + He → H2O2 + He) are likely to produce and deposit large quantities of these long-living and reactive species in spaces between the jets. Impinging or diffusing into the downstream bacterial sample, short-living species such as O and OH are quenched more rapidly by water molecules in the bacterial sample and the dominance of long living species such as O3 and H2O2 becomes more pronounced [38]. It is evident therefore that unique off-axis reaction chemistry is enabled and is likely to be dominated by neutral species. By contrast, reaction chemistry within a plasma column (or plasma jet) is likely to be dominated by electrons and charged particles. Notwithstanding the need for more detailed characterization studies, it is clear that distinct off-axis reaction chemistry is enabled by chemical crosstalk among individual jets in plasma jet arrays.
4. Conclusions
In summary, experiments in which E. coli K12 lawns are exposed to atmospheric pressure helium microplasma jet arrays for 20 s demonstrate the effective inactivation of the bacteria at distances approaching about three jet diameters from the nearest plasma jet, an action at distance well beyond that of a single plasma jet. Maps of E. coli inactivation illustrate the spatial modulation of reaction chemistry over the substrate through interactions of reactive plasma species generated by individual jets. These results reveal previously unreported existence of strong coupling of reaction chemistry initiated by individual plasma jets. This adds a new dimension to in the presently active studies of jet–jet interactions in atmospheric pressure plasma jet arrays for which the focus has been exclusively on electrostatic couplings [9–18]. Whilst electrostatic coupling that adversely affect the collimation of all individual jets in an array could be corrected and controlled by means of good array designs, chemical coupling is inevitable since long timescale of metastables and other long-living species facilitate (1) long-distance diffusion with local build-up of long-living species, and (2) enhancement in particle diffusion in the space between adjacent jets due to reduced chemical reactions. This previously overlooked aspect of physics and chemistry of jet–jet interactions is likely to be important to the future studies of atmospheric pressure plasma jet arrays and how they may be used for treatment of large abiotic and biotic surfaces.
For plasma inactivation of surface-born microbes, this study also reveals interesting new phenomena. For example, the deactivation of bacteria or pathogens over extended areas does not require the plasma to impinge on the substrate to be treated. Rather, bacterial inactivation beyond the periphery of the jet is accelerated by the proximity of another plasma jet, indicating that the chemistry responsible for cell deactivation is a synergistic effect relying on the combined action of two or more neighboring jets. Thus, the chemical and biological impact of an array cannot be described as the sum of the individual jets acting independently. Given the complexity of gas-phase reaction chemistry [38], unambiguous identification of the species responsible for deactivating bacteria will be needed and is expected to yield new science.
Acknowledgments
We wish to thank S C Ricke of Texas A & M University for providing the GFP plasmid, and the support of this work by Old Dominion University, the Air Force Office of Scientific Research (grant no. FA9550-14-1-0146), the Department of Energy and the National Science Foundation (grant no. DE-SC0008333), the National Science Foundation of China (Grant No. 51307134, 11404333 and 51221005), and the Fundamental Research Funds for the Central Universities is gratefully acknowledged.