
Abstract
A set of composite PbZr0.53Ti0.47O3 − xPb2Ru2O6.5 (PZT 53/47 − xPRO) and pure PbZr0.53Ti0.47O3 (PZT 53/47), PbZr0.38Ti0.62O3 (PZT 38/62) and PbZr0.36Ti0.64O3 (PZT 36/64) thick films (thicknesses 20–30 µm, porosity 25–50%) prepared by screen printing on (0001) single-crystal sapphire substrates, were studied using Fourier-transform infrared (FTIR) reflectivity and time-domain terahertz transmission spectroscopy. The compositions studied with 10, 15, 20 and 25 vol% PRO were around the electrical percolation threshold in the bulk ceramic composites (~17 vol%), known from impedance spectroscopy by Bobnar et al (2008 Appl. Phys. Lett. 92 182911). To obtain the effective dielectric functions of the films, we accounted for their porosity by using the Lichtenecker model. Using the dielectric functions of bulk pure PZT 53/47 ceramics and PRO single crystals from the literature available, effective dielectric functions were compared with those obtained using the generalized effective medium model by McLachlan with percolation threshold and critical percolation exponents, which fit the low-frequency data by Bobnar et al. The effective dynamic response in all the samples was dominated by an overdamped THz conductivity peak (central mode), as in pure PZT. The percolation threshold was not particularly apparent in the polar-phonon frequency range as it characterized the localized response. Unlike the low-frequency permittivity, which diverged at the percolation threshold, the effective microwave–terahertz permittivity increased above it.
Export citation and abstract BibTeX RIS
1. Introduction
Pb(Zr,Ti)O3 (PZT) solid solution is the most popular and most utilized ferroelectric system for piezoelectric applications [1]. It is also well-known for its high permittivity, used in multilayer ceramic capacitors [2]. Permittivity can be increased by mixing the high-permittivity dielectric with some conductor particles, forming a ferroelectric–conductor composite. In particular, close to the electrical percolation threshold of such a composite, the static permittivity is expected to diverge [3]. In the case of PZT this idea was first successfully realized by processing PbZr0.53Ti0.47O3 − xPb2Ru2O6.5 (PZT 53/47 − xPRO) all-ceramic composites [4]. PRO is a highly conductive material with a pyrochlore structure and good metallic behavior over the whole temperature range [5], which can be well sintered together with PZT powder at up to ~1200 K without any mutual reaction [4], forming, in such a way, an ideal ferroelectric—metal composite with sharp interfaces among the components. Bobnar et al [4] succeeded in processing composite ceramics with room-temperature permittivity reaching ~ 40,000 at 1 kHz near (but below) the percolation threshold (at 17 vol% of PRO), exceeding that of the pure PZT by about sixty times.
Static permittivity divergence at the percolation threshold manifests itself in a broad spectral range of the effective dynamic dielectric response. Recently, this has been analyzed up to the infrared (IR) range within the effective medium approximation (EMA) for a simple idealized model of a composite of loss-less dielectric with frequency independent permittivity and a Drude-type conductor, using the Bruggeman and Hashin–Shtrikman models [6]. It has been shown that the known low-permittivity increase and divergence in the effective dynamic dielectric response with a concentration approaching the percolation threshold [3], is connected with the critical slowing down of a relaxation, which softens from the IR range down to zero frequency. Such a feature has not yet been demonstrated experimentally, as it requires a thorough dielectric study in a very broad frequency range up to the IR for several compositions close to the percolation threshold. Our first attempts in this direction concerned the PET polymer–carbon nanotube [7] and alumina–carbon nanofibre composites [8]. The present paper is the first attempt to study such effects in all-ceramic composites using our unique broad-band dielectric spectroscopy facilities [9].
2. Experimental
For the first experiments we prepared several ceramic pellets similar to those studied in [4]. However, for time-domain THz transmission spectroscopy (TDTTS), even the pellets polished down to 50 µm were opaque. Since TDTTS is our most accurate technique in the high-frequency range, we decided to prepare thinner samples by a screen-printing technique of thick-film processing. Paste with the corresponding composition was screen printed on THz-transparent c-cut sapphire substrates with a subsequent annealing at 850 °C for 2 h. Five compositions of PZT 53/47 − xPRO films with x = 0, 10, 15, 20 and 25% of PRO were processed. All the compositions were checked by x-ray diffraction spectra. As it is difficult to prepare bulk dense PZT ceramics in the tetragonal composition range further away from the morphotropic boundary due to their tendency to crack, two pure tetragonal PZT films were also prepared of the PZT 38/62 and PZT 36/64 compositions. The resulting films were 20–30 µm thick and partially porous. The porosity was determined to be ~25–50% (with a relative accuracy of ~10%) by weighing, using the theoretical density of PZT and PRO amounting to 8.0 and 8.88 g cm−3, respectively and the known thickness and area of the films. The samples were sufficiently translucent in the THz range, but opaque in the polar-phonon IR range, so that the FTIR reflectance measured could have been taken as the effective IR reflectivity of the porous composite films.
For our studies at room temperature we used two experimental techniques: FTIR specular reflection under quasi-normal incidence (~ 10°) in the 30–3000 cm−1 range using the commercial Bruker IFS 113v spectrometer and TDTTS measurements in the 5–50 cm−1 range using a custom-made spectrometer based on femtosecond sapphire-Ti lasers [10]. The latter technique was also used for low-temperature measurements of selected samples, from 300 to 10 K. Trial measurements were also performed in the microwave (5–6 GHz) range using the composite resonator technique and in the standard low-frequency range (102–106 Hz) using two upper-stripe electrodes with a gap of ~0.5 mm between them. However the absolute permittivity values were lower by an order of magnitude than the expected bulk values, presumably due to the field penetration into the low-permittivity substrate. Nevertheless, the loss measurements confirmed the percolation threshold of between 15 and 20% of PRO, revealed by the appearance of a constant low-frequency conductivity plateau (above ~10 Hz) in the ac-conductivity spectra [6] above the percolation threshold, in agreement with [4].
3. Results, evaluation and model fitting
Room temperature FTIR reflectivity spectra of our thick-film samples are shown in figure 1. On the low-frequency end the data calculated from the TDTTS experiment are also plotted. Our FTIR reflectivity data were adjusted to these values by a small renormalization of the absolute reflectivity values, since the photometric accuracy of TDTTS is higher than that of the FTIR reflectivity. The reflectivity spectra were then fitted in the standard way using the well-known relationship between reflectivity and the dielectric function in the factorized form [11]

and the fitted curves are also shown as solid lines in figure 1. In equation (1) ωTOj and ωLOj denote the transverse and longitudinal frequencies of the j-th polar phonon, respectively, γTOj and γLOj denote their corresponding damping constants and the high-frequency permittivity, ε∞, results from the electron absorption processes in the UV range. As can be seen, very good fits were achieved. The dielectric spectra (permittivity and optical conductivity) of the three pure PZT films calculated from the fits are shown in figure 2 (lines) and similarly, the dielectric spectra of the four composite films are shown in figure 3.
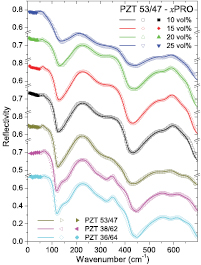
Figure 1. Room-temperature IR reflectivity spectra of our thick-film samples (empty symbols). THz data calculated from our TDTTS data are added at the low-frequency end (full symbols). The fits using equations (1) and (2) are shown by full thin lines.
Download figure:
Standard image High-resolution image
Figure 2. Permittivity and optical conductivity calculated from the fit to reflectivity of the pure PZT films in figure 1 (lines), compared with the directly calculated TDTTS data (symbols).
Download figure:
Standard image High-resolution image
Figure 3. Permittivity and optical conductivity calculated from the fit to reflectivity of the composite PZT 53/47—xPRO films in figure 1 (lines), compared with the directly calculated TDTTS data (symbols).
Download figure:
Standard image High-resolution imageThe next step was to estimate the effective reflectivities and dielectric functions of the fully dense samples. Neglecting the surface-film scattering (the pores are much smaller than the radiation wavelengths), this can be achieved fairly well by modeling the porosity, x, using the Lichtenecker model [12]

as has been shown convincingly recently for a set of PMN ceramics of different porosities [13]. Here ε1 is the dielectric function of the material, ε2 is the dielectric function of the pores, i.e. unity and α is a fitting exponent, which, for values close to zero, represents a complex shape and topology of the components [14]. We chose the value α = 0.426, which for our PZT 53/47 film fits the reflectivity data for the dense bulk ceramics in the best way [11], also for calculations of the spectra of all other dense compositions. The positive value of α means that both components (PZT and pores) of the composite are partially percolated for any composition. The effective reflectivities, together with the dielectric functions (permittivity and optical conductivity) of the fully dense pure PZT compositions, calculated using the Lichtenecker model with the same α, are shown in figure 4. Similarly, the effective reflectivities and dielectric functions of fully dense composites, calculated in a similar way, are plotted in figure 5.
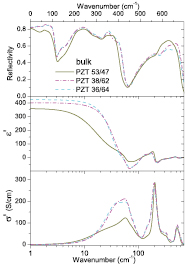
Figure 4. IR reflectivity, permittivity and conductivity spectra of fully dense PZT compositions: for PZT 53/47, as measured and fitted from the bulk ceramics; for the tetragonal PZT, as calculated from the thick-film spectra in figure 2 using the Lichtenecker model with α = 0.426 and known porosity (~40 and 45% for PZT 36/64 and PZT 38/62, respectively).
Download figure:
Standard image High-resolution image
Figure 5. IR reflectivity, permittivity and conductivity spectra of fully dense PZT 53/47—xPRO composites, as calculated from the thick-film spectra in figure 3 using the Lichtenecker model with α = 0.426 and known porosity (~25% for PZT–10%PRO and PZT–15%PRO, ~40% for PZT–20%PRO and ~50% for PZT–25%PRO).
Download figure:
Standard image High-resolution imageAs the last step we modeled the influence of the percolation threshold on the dielectric spectra and compared it with our experiment. The Bruggeman model with spherical particles shows the electrical percolation threshold at the conductor fraction xc = 1/3 and the Hashin-Shtrikman model only in the limit approaching xc = 1 [6]. To investigate the general percolation phenomena within the EMA, McLachlan et al [15] proposed a phenomenological formula, which is able to describe the percolation with an arbitrary percolation threshold xc and with general positive critical exponents t and s (see below for their meaning), the so called generalized effective medium (GEM) equation
where A = (1–xc)/ xc, ε is the effective dielectric function and x is the conductor volume fraction with the dielectric function, ε1. Formula (4) has the advantage that for static (dc) properties and close to the percolation threshold, in the case of ideal conductor–loss-less dielectric composite, equation (4) reduces to the general percolation power laws [3]

In order to apply the McLachlan model to our data we need to know the dielectric functions of both bulk components. For the bulk PZT ceramics we can take it from [11] and for the PRO crystal from [5]. In [5] the optical reflectivity was measured in a broad frequency range 50–30,000 cm−1 between 10 and 300 K temperature interval and compared with dc-resistivity measurements in the same temperature interval. The spectra below ~13,000 cm−1, including the dc conductivity, could be well fitted with two additive Drude-term contributions, in agreement with the microscopic considerations, from which the lower-frequency one dominates in the spectral range of interest (below ~700 cm−1). In figure 6 we show the room-temperature reflectivity, permittivity and conductivity for both components. Notice the rather high negative permittivity for the PRO crystal, typical of metals. These spectra were used to calculate the reflectivity, permittivity and conductivity spectra of the composites using formula (4) for xc = 0.17, s = 1 and t = 2.5 which fit the low-frequency data of [4]. The resulting spectra are plotted in figure 7.
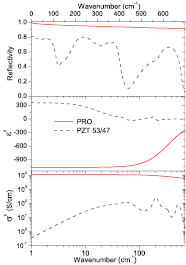
Figure 6. Room-temperature IR reflectivities and THz-IR permittivities and conductivities of the dense PZT 53/47 ceramics and PRO single crystal.
Download figure:
Standard image High-resolution image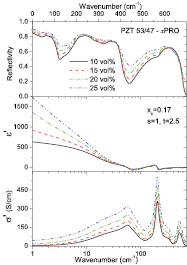
Figure 7. Effective room-temperature THz-IR reflectivity, permittivity and conductivity, calculated according to the McLachlan formula (4) for xc = 0.17, s = 1 and t = 2.5 from the component spectra in figure 6.
Download figure:
Standard image High-resolution image4. Discussion
Comparing the THz-IR spectra of pure PZT films in figures 2 and 4, it can be seen that the main difference concerns the THz range below ~ 100 cm−1, in which the strong overdamped mode (so called central mode – CM) dominates in all compositions studied [11]. (See the review [16] for a more general discussion.) The differences between the TDTTS data and fits to IR reflectivity are caused by the fact that the minor features at the low-frequency reflectivity end were not considered in the fits. It appears that the CM is broader for PZT 53/47 at the morphotropic boundary composition than for the tetragonal compositions with higher Ti content. This can be expected due to the higher structural disorder in the morphotropic boundary region.
Comparing the THz-IR spectra of PZT 53/47 with the PZT 53/47 − xPRO composites in figure 3, recalculated for the dense materials in figure 5, one can see that the main changes again concern the CM. Its strength increases with x, whereas its frequency slightly softens. The low-frequency permittivity dramatically increases with x, particularly above the percolation threshold. The mode strengthening and permittivity increase with x also agree qualitatively with the modeling in figure 7 using formula (4). However, the sharp percolation threshold in the latter formula results in pronounced low-frequency increases in the permittivity and nonzero dc conductivity above the percolation threshold in figure 7. These features are, of course, neglected in our reflectivity fits using equation (1), which is appropriate only for dielectrics.
Concerning the manifestation of the percolation threshold in the spectra, it appears not to be very pronounced in the polar phonon response. Changes with the PRO concentration in all the spectra are rather gradual without an apparent steeper change at the threshold. This holds even more for the modeled spectra in figure 7. It can be understood from the fact that the phonon vibrations, as well as the conductivity, in the THz and IR range probe very localized (in nm distances or less) excitations and diffusion processes (in the case of conductivity) and are, therefore, not sensitive to percolation phenomena, which concern mesoscopic and macroscopic distances.
However, on decreasing the frequency below the THz range, percolation phenomena should become more and more pronounced both in the conductivity as well as in the permittivity. Since we have fitted our experimental spectra with equation (1), which is valid for dielectrics and does not consider the non-zero dc conductivity, we cannot discuss the percolation phenomena with the spectra in figure 5, which cannot be correctly extrapolated to lower frequencies. To estimate it from our model, we have to extrapolate the model spectra in figure 7 to lower frequencies. However, it should be taken into account that the extrapolated properties are not fully realistic, since we have not considered the full spectra of the pure PZT ceramics here; these are known to display additional dielectric relaxations in the GHz range and at lower frequencies [17]. In figure 8 we plot effective static permittivity and dc conductivity computed from equation (4) in the limit of low frequencies as a function of x. One can see the expected conductivity increase above the percolation threshold and permittivity divergence at the threshold. Comparison with the high-frequency values in figure 7 shows that the surprising effective permittivity increase with x, even above the percolation threshold, is a specific feature of high frequencies; at lower frequencies a crossover to the expected permittivity decrease with PRO concentration above the percolation threshold is observed. This can be understood as a slowing down of a strong dielectric relaxation through the THz-microwave range on approaching the threshold from above as a function of PRO concentration, in agreement with modeling by the Bruggeman EMA model [6].

Figure 8. dc conductivity and low-frequency permittivity of the PZT 53/47—xPRO composites, calculated using formula (4), as a function of PRO fraction x with the same parameters as the effective dielectric functions in figure 7.
Download figure:
Standard image High-resolution image
5. Conclusions
We have studied several tetragonal PZT and morphotropic PZT 53/47 − xPRO ferroelectric–metal composite thick ceramic films by using TDTTS and FTIR reflectivity around the electrical percolation threshold near 17 vol% of PRO, known from the low-frequency impedance spectroscopy [4]. The spectra were fitted in a standard way to obtain the complex dielectric function. Porosity of the films was accounted for by the Lichtenecker model to obtain the effective dielectric function of fully dense materials. This model is appropriate for a complex topology of pores with their partial percolation for any porosity. The spectra of composites were then also fitted by the McLachlan EMA formula (4) [15] with an adjustable percolation threshold using the known spectra of both components and the critical exponents from the low-frequency data [4]. The effective THz response in all the films was dominated by an overdamped excitation known as central mode [11, 16]. The THz-IR conductivity increases gradually with the PRO composition without an apparent step at the percolation threshold, in agreement with the local character of the conductivity at such high frequencies. Unlike low-frequency permittivity, which diverges at the percolation threshold, the THz and microwave permittivity increases even above the threshold, due to the dynamic slowing down of a dielectric relaxation on approaching the threshold [6].
Acknowledgments
The authors thank S Drnovšek, K Makarovič and M Hrovat for support regarding the material processing, P Vanĕk for measurements of the film porosity, V Bovtun and M Kempa for the attempt microwave measurements and M Savinov for the trial low-frequency impedance spectroscopy. We acknowledge the support of the Czech Science Foundation (project No. P204/12/0232) and the Slovenian Research Agency (program P2-0105).