
Abstract
The physical and chemical aspects of plasma–surface interaction in high-power impulse magnetron sputtering (HiPIMS) discharges are overviewed. The data obtained by various plasma diagnostic methods representing the important sputtering discharge regions, namely the cathode vicinity, plasma bulk, and substrate vicinity, are reported. After a detailed introduction to the problem and description of the plasma characterization methods suitable for pulsed magnetron discharge analysis, an overview of the recent plasma diagnostics achievements in both non-reactive and reactive HiPIMS discharges is presented. Finally, the conclusions and perspectives suggesting possible directions and research strategies for increasing our knowledge in this domain are given.
Export citation and abstract BibTeX RIS
List of abbreviations
| HiPIMS | high-power impulse magnetron sputtering |
| HPPMS | high-power pulsed magnetron sputtering |
| R-HiPIMS | reactive HiPIMS |
| DCMS | direct current magnetron sputtering |
| MPPMS | modulated pulse power magnetron sputtering |
| CVD | chemical vapour deposition |
| PVD | physical vapour deposition |
| IPVD | ionized physical vapour deposition |
| dc | direct current |
| RF | radio frequency |
| RD | deposition rate |
| UV | ultraviolet spectral range |
| VIS | visible spectral range |
| IR | infrared spectral range |
| NIR | near infrared spectral range |
| OES | optical emission spectroscopy |
| OES-i | optical emission spectroscopy imaging |
| ROAS | resonant optical absorption spectroscopy |
| LIF | laser-induced fluorescence |
| DL | diode laser |
| LIF-i | laser-induced fluorescence imaging |
| TALIF | two-photon absorption laser induced fluorescence |
| TD-LIF | tunable diode–laser induced fluorescence |
| LDIF | laser diode induced fluorescence |
| TR-DAP | time-resolved–direct absorption profile |
| TD-LAS | tunable diode–laser absorption spectroscopy |
| FPI | Fabry–Perot interferometry (interferometer) |
| IRT | infrared thermography |
| MS | mass spectrometry |
| Te | electron temperature |
| Ti | ion temperature |
| Trot | rotational temperature |
| Tg | gas temperature |
| Ne | electron (plasma) density |
| Vp | plasma potential |
| Vf | floating potential |
| X+ | species X in a singly ionized state |
| XM | species X in metastable state |
| NGS | ground state number density
 —of species X) —of species X) |
| NM | metastable state number density
 —of species X) —of species X) |
| N* | excited state number density
 —of species X) —of species X) |
| Iij | spontaneous emission intensity corresponding to a transition between the states i and j |
| A | line absorption in plasma |
| EEDF | electron energy distribution function |
| IEDF | ion energy distribution function |
| VDF | velocity distribution function |
| FWHM | full-width at half-maximum |
| CCD | charge coupled device |
| ICCD | intensified charge coupled device |
| PMT | photomultiplier tube |
| PEM | plasma emission monitoring |
| TTL | transistor–transistor logic |
| CRM | collisional–radiative model |
1. Introduction
Film forming species in a sputtering plasma discharge always cover a certain pathway, under definite physical and chemical conditions, until they are finally solidified on a surface facing the plasma. On their pathway particles may be ionized, neutralized, participate in various chemical reactions, etc. The species involved in these processes can be characterized through a set of fundamental physical parameters, such as the number density, relative composition, ionization degree, energy or velocity distribution function, average energy, thermalization degree, gas temperature (in case of thermalization), fluxes, etc. The listed parameters depend in turn on the classical plasma parameters, such as the electron density, electron energy distribution function, and excitation mechanisms, which are in turn defined by the plasma type (source) and its working conditions. Finally, the surface related processes, which have their own characteristics, play an important role as well. The plasma–surface interaction in this regard can be represented as the interconnection between these three sets of parameters, representing the plasma source, the plasma bulk, and a surface faced to the plasma. The goal of this review article is to give an insight into the plasma–surface interaction in the highly demanded and intensively studied high-power impulse magnetron sputtering (HiPIMS) discharges, through utilization of advanced plasma diagnostic methods, both non-intrusive and intrusive ones.
Since the second half of the 19th century, thin films have been used to improve and control the surface properties of numerous bulk materials. Today, they have become an intrinsic part of everyday life, with applications in numerous technological domains including hard, wear-resistant or corrosion-resistant coatings, coatings for optical or electrical applications, coatings for microelectronics, etc [1–3]. If the potential of a given coating type is obviously defined by the physico-chemical properties of the used material (e.g. electrical, chemical, mechanical properties), its fabrication route is also of tremendous importance. For example, depending on the basic process parameters, a coating made of an intrinsically transparent bulk material can be opaque due to the developed microstructure [4].
Among the families of methods employed for thin film growth, those belonging to the field of physical vapour deposition (PVD) are among the most commonly utilized. PVD covers a range of deposition methods, including thermal evaporation, vacuum arc deposition, laser ablation, and sputtering. The PVD methods differ from the chemical vapour deposition (CVD) ones in the sense that the source of material is solid or liquid, as opposed to a gaseous one in the case of CVD [4]. However, chemical reactions still can occur in a reactive PVD, i.e. in a process running under reactive atmosphere (pure or mixed with a noble gas) leading to oxide or nitride formation. Concerning the origin of the PVD mechanism, it may have a thermal nature (evaporation, ablation) or be a result of a cascade of energetic collisions in a superficial layer of a definite material (sputtering) leading to the ejection of non-thermal particles.
Thermal evaporation has been the most used PVD process for many years because of the easy handling and relatively high deposition rate (RD)compared to the first known sputtering process, namely diode sputtering [5]. The latter process has been known since its first description in 1852 by English physicist W R Grove, who had managed sputtering of a cathode material on the walls of a glass vessel using a massive inductive coil [6]. In diode sputtering, ions of the sputter gas, commonly argon, hit a negatively biased cathode (also known as the target) with energy up to a few hundred electron volts. This energy is high enough to allow, through collisional cascades, the ejection of near surface atoms having a given probability, after their transport in a chamber, to condense on the chamber surfaces, including a potential substrate, as described by Sigmund [7]. In addition, due to the ion–surface interaction processes, secondary electrons are emitted, playing a crucial role in maintaining the discharge. In comparison with the evaporation process, the growing film also experiences bombardment by the sputtering gas ions generated in plasma. These ions often allow us to improve certain film properties such as its density, or to control the phase (micro-structure) constitution. Nevertheless, in diode sputtering, due to the relatively high (roughly 10 Pa) process pressure needed to ensure the discharge stability, the mean free path of the ejected atoms (millimetre range) is much lower than the typical substrate–target distance (centimetre range), resulting in a reduced RD and in a relatively poor quality of the deposited coating.
The diode sputtering limitations were overcome in the 1960s in the works of Kay and Gill [8, 9] by using the magnetic field to create an enhanced ionization region for efficient sputtering, followed in 1974 by introduction of planar magnetron sources [5, 10], which are characterized by the presence of permanent magnets beneath the cathode. This resulted in more efficient electron trapping close to the cathode surface and, accordingly, in an essential increase of ionization rate of the sputter gas in the cathode vicinity. Consequently, the pressure necessary to maintain the discharge current can be reduced by about one order of magnitude (down to the pascal range or even lower; see [8]), allowing for a significant increase of RD and for synthesis of high quality coatings. In addition to these achievements, strong efforts have been devoted to get a better control on the synthesis of compound coatings by introducing so-called reactive magnetron sputtering. Since that time the (reactive) magnetron sputtering technology has flooded the market, being nowadays one of the most highly demanded for thin film research and industrial applications [11].
These achievements have mainly been possible thanks to a thorough characterization of the plasmas driving various deposition processes. The systematic plasma characterization work has allowed us to gain fundamental understanding of the plasma physics behind the technological developments and, ultimately, to follow the goal of the process optimization by describing the plasma–surface interaction phenomena, especially at the plasma–target and the plasma–growing film interfaces. As an example, numerous magnetron discharge characterization studies, made both for non-reactive and reactive discharges, have to be acknowledged. Among these works, the essential contribution of Berg et al [12] and later Depla et al [13–15] dedicated to control of the poisoning mechanism during the reactive magnetron sputtering should be mentioned.
The increasing demands for new functional coatings as well as for deeper understanding of the plasma–surface interaction physics has driven the development of more versatile deposition techniques based on the magnetron sputtering principle. Most of the time, this development was targeted to a better control as well as to enhancement of the density and energy of the bombarding ions during film growth. Indeed, many works have demonstrated the benefit of such a control for tuning the film microstructure and phase constitution, as described by Anders [16] in his structural zone model adapted from the previously known structural models [17, 18].
One of the critical points in magnetron sputtering is related to the magnetic field topology. Indeed, in a basic magnetron configuration (balanced magnetron), the arrangement of the magnets leads to a strong confinement of the ionizing electrons close to the target surface. In this case, the dense plasma region above the target is roughly comparable to its radius (assuming a planar circular target) [19]. If the substrate is located outside this region, the bombardment of the growing films by the plasma ions is strongly reduced (<1 mA cm−2), limiting the benefit of the process. Changing the magnetic field topology near the cathode can improve the situation, letting some of the field lines reach the substrate surface. In such an 'unbalanced' configuration, plasma is not confined completely as before, and much more ions are able to reach the growing film, generating an ionic current density of about 2–10 mA cm−2, which is typically one order of magnitude higher than in the balanced magnetron case [1].
On the other hand, independently from the magnetic field configuration, some research groups have established strategies related to the way of coupling power to the discharge. Initially, the development of such original plasma sources has been driven either by aiming an efficient insulating compounds deposition by reactive magnetron sputtering or by a potential possibility of direct sputtering of a compound target. Aiming for power delivery optimization, radio-frequency (RF) sources (working at 13.56 MHz) have been employed. However, the relatively low RD, as well as the difficult scaling up of these plasma sources, has limited their applicability. Following this trend, in the early 1990s, pulsed-dc (direct current) magnetron sputtering was proposed. It has been demonstrated that pulsing the discharge in the medium frequency range (10–200 kHz) allows deposition of ceramics at almost the same RD as for metallic films, which also drastically reduces the defect density in the coatings [20, 21]. Most of the time, pulsed-dc power supplies are operated by successively alternating the negative (sputtering phase) and positive (charge dissipation phase) cycles. Depending on the polarity of a positive pulse (ground or positive value ∼10% of the negative voltage), the power supply might be unipolar or bipolar. Nowadays, most of the magnetron sputtering processes for the synthesis of insulating compound coatings use pulsed magnetron sources [1].
Based on the plasma diagnostic studies performed in pulsed magnetron sputtering discharges (see [22] and therein), it has been concluded that, in addition to reliable and efficient growth of the insulation coatings, pulsing the discharge also improves the ion bombardment of a growing film. The mentioned studies were conducted in terms of the fundamental plasma parameters involving typically optical spectroscopy methods, energy- and time-resolved mass spectrometry (MS), Langmuir probes, etc [21, 23–25]. Such usability of the pulsed plasmas should first of all be attributed to the presence of several energetic ion groups in the discharge, including high-energy ions that are generated as a result of the specific voltage waveform in a pulsed magnetron discharge. Figures 1(a) and (b) show an example of the voltage and current waveforms observed in asymmetric bipolar pulsed discharge [26]. The latter can be divided into three main regions: the negative on-time (conventional sputtering), the short (<250 ns) positive overshoot region, and the positive off-time. This structure of the waveforms is 'transposed' to the Ar+ energy distribution measured by energy-resolved MS, in which three energy groups of Ar ions can be identified: (i) a low-energy group around 3–5 eV similar to the one observed in conventional dc magnetron sputtering (DCMS), (ii) a mid-energy group around 25 eV attributed to the ions accelerated during the off-pulse steady state, and finally (iii) a high-energy group attributed to the ions accelerated during the voltage overshoot at the end of the on-time (see figure 1(c)). In addition, it has been demonstrated that the population of the mid- and high-energy ion groups rises with the pulse frequency [27].
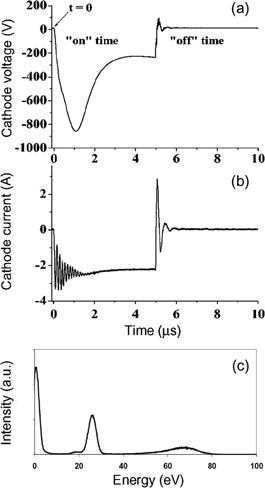
Figure 1. Voltage (a) and current (b) waveforms in a pulsed-dc magnetron discharge. After the positive transient at t = 5 µs (duration 200 ns) the remainder of the off-time is known as the 'reverse'. Reproduced with permission from [26]. Copyright 2007 IOP Publishing. (c) An Ar+ ion energy distribution corresponding to the discharge operated with a pulse frequency of 100 kHz and a duty cycle of 50% at 500 W. Reproduced with permission from [27]. Copyright 2009 INOE Publishing.
Download figure:
Standard image High-resolution imageAlthough careful design of the magnetic traps for development of the pulsed magnetron sputtering technologies is fairly efficient to improve the coating quality (by optimizing the ion bombardment), the continuous development of certain technological domains, and particularly of microelectronics in the 1980s, has triggered a new family of magnetron sputtering processes, the so-called ionized physical vapour deposition (IPVD) techniques. A detailed review of the IPVD technology is given by Helmersson et al [28]. In a typical IPVD discharge, a significant fraction of sputtered atoms is ionized in flight, which essentially affects the film growth. This fraction can reach 100% in certain cases. This new technological approach has resulted in appearance of a new paradigm in the magnetron sputtering community. Indeed, the fact that the metallic ions are often the dominating species in IPVD processes can be especially useful, for instance, in the case of coating the vias, trenches or other complex 3D surfaces. Such advances became possible due to the accurate ion energy control, which is realized through tuning of the substrate bias voltage in such a way that the depositing metal ions may cause preferential re-sputtering of the previously deposited film layers, thus resulting in better sidewall coverage in deep structures [28].
The main idea behind the IPVD techniques is to generate denser plasmas than appear in conventional magnetron sputtering in order to ionize the sputtered atoms more efficiently (up to the level of number densities ∼1013 cm−3 versus 108–1010 cm−3 in conventional sputtering). To do this, several methods have been proposed. Among them, the most efficient are (i) use of a secondary plasma (usually an inductively coupled plasma—ICP) generated around an inductive coil located between the sputtering target and the substrate [29], and (ii) an original design of the magnetron cathode itself, resulting in higher metal ion production, such as in the hollow cathodes [30]. It should be emphasized again that both the development and control of these newly emerged discharges become possible as a result of the detailed characterization of the plasma phase by diagnostic methods. At this point we should note the significant contribution of Rossnagel and Hopwood in both understanding and characterization of the magnetron discharges enhanced by the ICP plasmas through the measurements of the corresponding plasma characteristics [29, 31].
In the mid 1990s [32–34], the IPVD family was enlarged by the novel plasma processing technology called high-power impulse magnetron sputtering, or HiPIMS (also known as high-power pulsed magnetron sputtering—HPPMS—along with so-called modulated pulse power magnetron sputtering—MPPMS). Its principle is based on redistribution of the energy supplied to the sputtering discharge among the short pulses with very low duty cycle (∼1%), keeping the average applied power comparable to that used in the DCMS discharges [35–37]. Indeed, it is known that increasing the target voltage and hence the discharge current results in higher plasma density in magnetron sputtering. At the same time, the power cannot be increased indefinitely due to the thermal load on the target induced by the bombardment of sputtering ions. HiPIMS discharge uses pulse durations ranging from a few to a few hundred microseconds, while the pulse repetition frequency spans from ∼10 Hz to ∼10 kHz. In these conditions, the peak current density may reach values of up to several A cm−2 compared to a few mA cm−2 in DCMS, but only for <∼1% of the time, as described by Gudmundsson et al in the recent review [35]. As a consequence, dense plasma is generated during the plasma on-time, enabling not only an efficient target sputtering but also a high ionization rate of the metallic vapour [37].
For almost 20 years, both non-reactive and reactive HiPIMS processes were successfully implemented for synthesis of various types of coatings. The research in this domain not only has clearly demonstrated the benefits of the technology itself in terms of the enhanced selectivity of film properties, but it has also revealed the complexity of the physical mechanisms involved in this sputtering technique [35, 37]. The latter is mainly caused by the high plasma density transiently generated during the HiPIMS pulses making the plasma–target and ultimately the plasma–surface interactions rather complex. For instance, the lower deposition rate often attributed to HiPIMS as compared to the conventional magnetrons (assuming the same average power level) is still under discussion, where such phenomena as self-sputtering and metal ion transport may be the key responsible mechanisms [37]. On the other hand, under the reactive conditions, the target poisoning mechanisms are much more complicated than in conventional magnetron sputtering, and the opinions explaining the data reported for the reactive HiPIMS discharges, such as the hysteresis phenomenon, are still divergent.
It is obvious that strong efforts are still necessary, first of all in terms of characterization of the plasma phase generated in HiPIMS discharges. This is important to clarify the plasma–surface interaction at any level, starting from the target–plasma interface, and moving towards the plasma–film interfaces. This is particularly true for the reactive conditions, where the volume kinetic processes are much more complex. The role of plasma diagnostics should also be underlined in connection with the modelling studies of a HiPIMS discharge, which are still at their early stage for non-reactive gas mixtures, and have yet to be developed for the reactive ones.
The present paper has a goal to overview the recent achievements in the domain of HiPIMS discharge characterization, obtained in both non-reactive and reactive regimes of operation. The next section of this manuscript is related to the plasma characterization approaches that are (or may be potentially) implemented for the detailed analysis of HiPIMS discharges, both in space and time domains. The following sections overview the discharge characterization data obtained so far, in both non-reactive and reactive HiPIMS cases, paying special attention to the main discharge regions such as the target vicinity, plasma bulk, and substrate vicinity, where plasma interacts with a growing film. Finally, a summary and future perspectives conclude this review.
2. Overview of plasma diagnostic methods
This part overviews the plasma diagnostics techniques potentially suitable for HiPIMS discharge characterization. It includes the description of the measurable plasma parameters, as well as the main advantages and drawbacks of each method. The remarks concerning the implementation of the described methods are also given. The optical plasma diagnostic methods which we think do/will have a particular interest in the domain of the pulsed discharges are mainly considered. At the same time, the well-known techniques, such as Langmuir probes and MS, are described briefly.
Representing the pulsed sputtering discharges with rather short pulse duration (typically 5–500 µs), HiPIMS plasma should undoubtedly be characterized in a time-resolved way. This is especially important since the most critical discharge phenomena, such as sheath formation, bulk gas ion acceleration, interaction with the target surface, secondary electron emission, etc, occur during the on-time. The main HiPIMS pulse parameters necessary for time-resolved characterization, such as plasma on- and off-times, period, etc are defined in figure 2. The characteristic time resolution required for HiPIMS might be estimated based on its typical pulse duration. Suggesting the on-time ≈10 µs (short-pulse case) to be covered by ⩾10 experimental points, we obtain a sub-microsecond time resolution. This time, of course, can be much longer for the longer pulses, as well as for the off-time. The majority of the existing diagnostics techniques are able to provide such resolution, as indicated in table 1. Another critical point is the time synchronization during the characterization of a pulsed discharge, which is normally realized by utilization of a TTL logic sequence generated in a power supply and corresponding to the plasma pulses. Such a synchronization signal is often connected to a detector (e.g. a photomultiplier tube (PMT), an intensified charge couple device (ICCD) camera [38], etc) via a digital delay generator (DDG). Since the time jitters of modern DDGs are typically ∼1 ns, the additional requirements for the pulsed power supply to provide a jitter matching the overall time resolution should be considered [39, 40]. The synchronization schemes may be more complicated depending on the presence of the external light sources, etc, as described below.
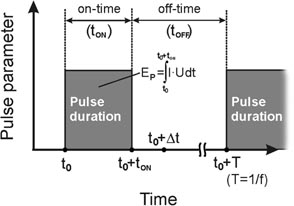
Figure 2. Schematic representation of HiPIMS pulse illustrating the terms used in this work, such as on- and off-times, period (T = tON + tOFF), pulse repetition frequency (f = 1/T), and energy per pulse EP. The arbitrary delay time Δt starting from the pulse beginning is used for the time-resolved result description. I and U stand for discharge current and voltage respectively.
Download figure:
Standard image High-resolution imageTable 1. Summary of the selected plasma diagnostic methods potentially applicable for HiPIMS discharge characterization.
| Method | Measurable parameters and references | Whether ON- or OFF-time | Spatial resolution (approximate) | Temporal resolution (approximate) | Comments |
|---|---|---|---|---|---|
| Optical in situ diagnostic methods | |||||
| OES | Iij, excited state density (N*) [47], Te, Ne [48, 49, 56, 59–61], Trot, Tg [39, 55, 80, 317–319], PEM [273, 320, 321], etc | ON | mm range | ns rangea | General name including variety of techniques |
| OES-i | Excited state density (N*) mapping [95, 96, 290] | ON | mm range | ns range | |
| ROAS | NGS, NM (absolute) [75, 98, 100, 109, 225, 322] | ON, OFF | About 1 cm | ns range | Can be used for absolute density calibration [136] |
| LIF | NGS, NM (relative) [111, 115, 124, 323, 324], Trot, Tg [129, 325], VDF [118, 124, 326–328] | ON, OFF | Can be <1 mm | ns range | |
| LIF-i | NGS, NM relative density mapping [129, 327], VDF mapping [132] | ON, OFF | Can be <1 mm | ns range | |
| TALIF | Similar to LIF [114, 329, 330] | ON, OFF | Can be <1 mm | ns range | |
| FPI | High-resolution spectral line profile (Tg) [83, 91], velocimetry (VDF) [76, 77], etc | ON | About 1 cm | µs–ms range (typically)b | Time resolution depends strongly on FPI mirror stability |
| TD-LAS | Similar to ROAS [109] | ON, OFF | About 1 mm | sub-μs range | |
| TR-DAP | Similar to ROAS [40] | ON, OFF | About 1 mm | μs range | |
| TD-LIF (LDIF) | Similar to LIF [123, 124, 328] | ON, OFF | About 1 mm | sub μs range | |
| Thomson scattering | Direct EEDF, Te, Ne [144, 145, 331–334] | ON | Can be <1 mm | ns range | |
| Rayleigh scattering | Tg [137, 333, 335], NGS [137], temperature mapping [141], velocimetry [137, 140] | ON, OFF | Can be <1 mm | ns range | Can be used for absolute density calibration [116] |
| Pyrometry (IRT) | Temperature of solid surfaces in plasma [211] | ON, OFF | mm range | ms–s range | |
| Other in situ diagnostic methods | |||||
| Langmuir probes | EEDF, Te, Ne, Vp [22, 148, 170, 175, 298, 336] | ON, OFF | Can be <1 mm | sub-μs range | |
| Ion probes (Katsumata probes) | IEDF, Ti [171, 173, 174] | ON, OFF | mm range | n/a | |
| Thermal (calorimetric) probes | Heat flux to the substrate [201–205] | ON, OFF | cm range | seconds | |
| Mass spectrometry | IEDF, Ti [23, 177, 183, 184, 189, 190, 195, 337, 338] | ON, OFF | Space-integrated information | Sub-μs range | |
aThe given time resolution is defined by a detector and/or acquiring circuitry capabilities and represents fairly typical values. bIn spite of the fact that the FPI systems use the same detectors as for OES etc, the time resolution of this technique is typically much lower due to the low light signals it deals with.
2.1. Optical diagnostic methods
2.1.1. Optical emission spectroscopy (OES).
The principles. Optical emission spectroscopy, or OES (also known as atomic emission spectroscopy—AES), is based on the measurements of light generated as a result of spontaneous relaxation of excited species in plasma. The phenomenon of stimulated emission can also be of use for diagnostic purposes [41]; however, this topic is not covered in this paper. OES is essentially a line-of-sight measurement method, where the information is averaged along a certain (normally conical or cylindrical) plasma region. In the case of discharges with spherical or cylindrical symmetry (which is often the case in magnetron sputtering), the additional space-resolved information can be withdrawn by implementation of the well-known Abel inversion procedure [42, 43] on the obtained line-of-sight data.
The intensity of light emitted as a result of spontaneous transition between two energy states of an excited atom (i and j, see figure 3(a)) can be expressed in the following form (see, e.g., [44, 45]):

(where Ni is the density in state i, Aij is the spontaneous emission probability, νij(λij) is the frequency (wavelength) corresponding to the transition, and h and c are the Planck constant and the velocity of light). Let us remember that the emission intensity distribution in a line spectrum is normally affected by the response of a particular detection system, e.g. a monochromator combined with a detector. In this case, an additional constant should be introduced in equation (1) [45]. The density Ni as such depends on the excitation mechanism in plasma, reflecting the nature of the discharge. A proper 'population model' needs to be applied in order to describe the excitation processes. The so-called corona model and collisional–radiative model (CRM) are among the most used approaches describing the excitation in plasma discharges. The corona model implies that the discharge particles are excited due only to the direct electron impact, neglecting the radiative cascades, whereas the CRM takes into account the additional factors, such as the presence of metastable particles, higher excited states, radiative cascades, etc, and sometimes the electron energy distribution function (EEDF) is obtained as a solution of the Boltzmann equation self-consistently with the balance equation for the particles. Numerous detailed textbooks [44–46] and reviews [47–49] are available on this topic.
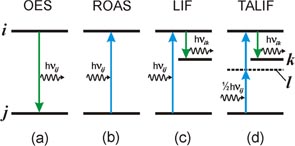
Figure 3. A schematic representation of the atomic states and corresponding spectral transitions used in (a) OES, (b) ROAS, (c) LIF and (d) TALIF plasma diagnostic methods.
Download figure:
Standard image High-resolution imageThe implementation of OES for HiPIMS characterization is straightforward and can be represented schematically as in figure 4. The main diagnostic tools in this case comprise an optical UV–NIR fibre guiding the light from the plasma to a spectrometer equipped with a light sensitive detector, as well as the synchronization system. As mentioned above, a separate DDG might be necessary in order to perform a time-shifted OES acquisition relative to the external TTL trigger.
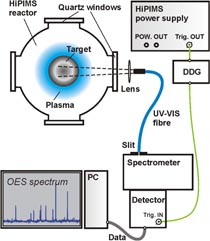
Figure 4. A generalized experimental setup for time-resolved OES diagnostics of a HiPIMS discharge including an optical fiber, spectrometer/monochromator, detector, and synchronization system.
Download figure:
Standard image High-resolution imageQualitative and quantitative OES analysis. The qualitative determination of plasma composition is one of the most straightforward ways of OES implementation widely used in sputtering discharges. Indeed, owing to the line structure of the emission spectra of laboratory plasmas, multiple emitting species can be detected independently. For example, the presence of a considerable number of the ionized species in a HiPIMS plasma, as compared to a DCMS one, can be visualized. In addition, under the assumption of a constant level of electron excitation, the density of excited species
 can be considered to be proportional to the ground state density of the same species,
 . This principle is used in the plasma emission monitoring (PEM) technique for real-time plasma composition control [50]. Detailed knowledge of the electron excitation in plasma enhances the power of OES, and in this case the ground state density can be determined based on known EEDF, assuming for instance a corona equilibrium. The relationship between the excited state density (Ni) and the other plasma parameters in this case takes the following form [47]:

(where 0, j, i denote the ground and excited states, N0 is the ground state density, X0i(Te) is the Te-dependent excitation rate coefficient, and the other terms have their usual meaning). X0i(Te) in the general case is expressed in the form [45, 47]
(where E is the electron energy, E0 is the excitation energy threshold, σ(E) is the excitation cross section, f(E) is the EEDF and me is the electron mass).
The illustration of the role of excitation coefficient for a known EEDF is given in figure 5. As one can see, apart from the excitation threshold, the electron temperature Te has a critical impact on the resulting electron excitation coefficient in plasma. The highly dynamic behaviour of the HiPIMS plasmas, particularly in terms of EEDF [51], as well as the presence of metastable species in the plasma bulk, make the excited states unsuitable candidates for ground species monitoring by OES, at least under the corona approximation. For relative and especially absolute plasma density determination in HiPIMS, extended knowledge of the mentioned plasma parameters, as well as more sophisticated discharge diagnostic techniques, are required.

Figure 5. An example of the electron excitation rate coefficient X0i calculation at different Te for electron impact excitation of Ar, O and Cu (shown by the filled areas).Adapted from [183]. A Maxwellian EEDF is assumed. The cross section data are taken from [339] (Ar), [340] (O), and [341] (Cu).
Download figure:
Standard image High-resolution imageAnother way to determine the absolute density of plasma species by OES is the calibrated light source approach. A detection system (optical fibre + spectrometer + detector) calibrated in a special way produces the 'absolute spectra', allowing us to determine the absolute irradiance of the emission lines (in W m−2 sr−1), thus providing direct access to the plasma parameters, such as Te, Ne, etc [47]. The absolute spectral calibration is usually performed by commercially available calibration light sources emitting in the UV–VIS, VIS or VIS–NIR spectral ranges, which are normally represented by deuterium lamps or tungsten ribbon lamps; however, other ways are also possible [52]. Note that during the absolute calibration one must thoroughly conserve the solid angle, which is often adjusted by using apertures. Knowing precisely the solid angles used during calibration, the absolute density of the emitting species (i.e. state i in figure 3(a)) can be found (equation (1)). To determine the absolute ground state density, assumptions on the main population channels should additionally be made. In the simplest case of corona equilibrium, this value can be performed using equation (2). Further details on the absolute calibration methods can be found in [47].
Ne and Te determination. One of the OES advantages is its ability to determine the fundamental plasma parameters, such as Ne and Te, in a non-intrusive way. Even though this way of determination is less straightforward than the Langmuir probe method, and is applicable to a limited number of cases, its non-intrusiveness represents the main advantage for sputtering plasma characterization, especially in the presence of strong electro-magnetic fields. The key points of this method are described below.
The principle of Te and Ne determination by OES in cold plasmas is normally based on determination of the ratio between two prominent emission lines which are sensitive to the changes of a chosen parameter (e.g. electron temperature), often referred to as the 'line ratio method' [48, 53]. In the general case, this method should be adapted to each particular plasma discharge (i.e. gas mixture), since it requires a population model for the excited states [48]. Based on the chosen population model, the line ratio diagnostics may be applicable to, for example, hydrogen-containing discharges [54], single gas discharges [45, 55, 56], gas mixtures [47, 48, 57, 58], or discharges with a minor addition of several foreign gases to increase the precision of the method [59, 60]. The emission peaks of both ions and neutrals, as well as their combination, can be utilized. It should be noted that the line ratio methods normally provide good agreement with Langmuir probe measurements [48, 56, 60–62]. As an illustration, two empirical formulas for Te determination based on the excitation coefficient ratios for two emission lines calculated for Ar and
 [48] are given in figure 6. The Maxwellian EEDF and corona equilibrium are assumed in this case. The examples of Ne determination methods for low-density plasmas are reviewed by Inković et al [63].
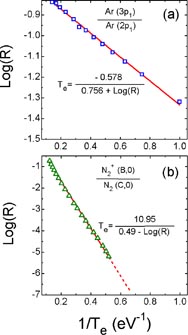
Figure 6. An illustration of Te determination using the electron excitation coefficient ratio (R) corresponding to (a) a single gas and (b) two species in a gas mixture. A Maxwellian EEDF is assumed. Adapted with permission from [48]. Copyright 2010 IOP Publishing.
Download figure:
Standard image High-resolution imageApart from the line intensity ratio, the Stark broadening represents one of the most important diagnostic procedures for Ne and Te determination in plasma. This broadening is a result of interaction between the light emitters in plasma and the local electrical field created by surrounding electrons, and to lesser extent ions (see, for instance [64, p 160]). The fact that the Stark broadening is especially pronounced for atomic hydrogen (where the full-width at half-maximum (FWHM) of the emission line can be several nanometres wide) and for other hydrogenic atoms makes H the main element for Ne and Te measurements for which the Hα and Hβ emission lines are normally used [65]. The non-hydrogenic elements, however, can also be of use [66]. At the same time, most calculations of the Stark broadening realized so far deal with electron densities Ne >∼ 1014 cm−3 [65, 67–69]. This fact makes the magnetron sputtering discharges including HiPIMS doubtful candidates for characterization by this method, since Ne in these discharges normally does not exceed the mentioned value [35, 51, 70, 71].
Gas temperature analysis. There are two main approaches to gas temperature determination based on OES: (i) direct determination of the thermal (Doppler) broadening of an emission line, and (ii) analysis of the rotational emission bands of the diatomic molecules present in a discharge (rotational temperature). Both methods involve high-resolution spectroscopic measurements.
The Doppler broadening of an emission (absorption) line is a result of thermal motion of the emitters (absorbers) in plasma. The analytical expression of the Doppler FWHM (ΔλD) is based on the Maxwellian velocity distribution in the gas [64, 72] and can be expressed in the form

(where λ0 is the wavelength of the considered emission line, T (K) is the gas temperature, and M (amu) is the relative atomic mass). A typical value of Doppler broadening for the Ar emission line (at 750 nm) at room temperature is about 1.5 pm. As one can see, equation (4) provides a straightforward method for gas temperature determination by using the measured ΔλD value. When determining the gas temperature by its thermal broadening the other essential broadening mechanisms [64, 66] should be taken into account. Indeed, for example the Stark broadening of the H lines dominates at high electron densities [65], whereas van der Waals and resonant broadenings for non-hydrogenic lines are essential in atmospheric plasma cases [73]. Even though the low-pressure low-temperature discharges are mainly Doppler limited [74, 75], the sputtering discharges maybe often far from thermal equilibrium, and consequently the gas temperature term might not be applicable. In this case the particles' velocity distribution function (VDF) rather than their temperature defines the final line broadening [76, 77]. In general, high-resolution spectroscopy is required for direct Doppler profile measurements, for example Fabry–Perot interferometry, as will be discussed later.
Another gas temperature determination approach is based on the rotational spectrum analysis. Since the rotational excited levels of diatomic molecules often possess the Boltzmann distribution, they can be characterized by rotational temperature, Trot [78]. This quantity is close to the gas temperature (Tg = Trot) for a great number of molecular species [79, 80], assuming the translational–rotational equilibrium is fulfilled [81]. In this case, the intensity I distribution in a rotational emission band can be written as follows:
(where C is a constant, Qrot is the statistical sum, SJ is the Hönl–London factor [78], λ is the transition wavelength, F(J') is the rotational energy term, J' stands for the upper rotational level, and the other terms have their usual meaning). Based on equation (5), Trot can be determined using the Boltzmann plot restored in the coordinates (F(J'), Log(I/SJ)).
There are a variety of rovibrational transitions suitable for Trot determination, such as the first negative band of
 [79], the first [82] and second [83] positive bands of N2, several rovibrational bands of OH [84], the Angstrom band of CO [85], etc. Having a high-resolution rotational spectrum, straightforward calculation of Trot is possible based on the rotational constants available for a given molecule. The illustration of this method for a HiPIMS discharge using the first negative band of
[39] is given in figure 7. More details on gas temperature determination by OES can be found elsewhere [64, 86].
[79], the first [82] and second [83] positive bands of N2, several rovibrational bands of OH [84], the Angstrom band of CO [85], etc. Having a high-resolution rotational spectrum, straightforward calculation of Trot is possible based on the rotational constants available for a given molecule. The illustration of this method for a HiPIMS discharge using the first negative band of
[39] is given in figure 7. More details on gas temperature determination by OES can be found elsewhere [64, 86].

Figure 7. A rotational emission band from the first negative band of
measured in a HiPIMS plasma by OES (Ar–W–N2 mixture). The N2 content is 30%. tON = 20 µs, Δt = 10 µs. Inset: an example of a Boltzmann plot built based on the marked N2 rotational peaks. Adapted with permission from [39]. Copyright 2013 AIP.
Download figure:
Standard image High-resolution imageThe Boltzmann plot method is also widely used for analysis of the distribution of excited atomic levels in plasma. This enables determination of the so-called excitation temperature (Texc) of species. For this purpose the relative populations of the excited levels are determined based on the OES measurements (renormalized emission line intensities) so that the excitation temperature for a definite gas species can be found. In the case of Ar, the approach is illustrated by García et al [87].
High resolution OES. Fabry–Perot interferometry. Since the typical spectral resolution of a laboratory monochromator is usually about 20–50 pm, an alternative device is often necessary to cover the high-resolution range. This is first of all related to the spectral line profiling purposes having a goal to study the gas temperature (Doppler broadening) or the fine structure of the emission lines. Since under typical conditions the ΔλD of an emission line is equal to a few picometres or less, the corresponding spectral resolution should be less than 1 pm. Owing to their very high spectral resolution, the interferometric techniques (such as Fabry–Perot interferometry—FPI) are normally applicable in this case. With an FPI system a direct broadening measurements in a plasma discharge is possible [83].
A typical FPI consists of a pair of highly reflective parallel mirrors equipped with a motion control, which are normally placed in front of a monochromator (see figure 8). The monochromator plays the role of an optical filter in this case, so its resolution is not important, as pointed out in [83]. As a result of the FPI scanning mode, a high-resolution profile of a certain emission line can be obtained. Either a CCD (ICCD) or a PMT in a photon counter mode can be used as a detector. The first provides the ability to follow several emission lines simultaneously, enabling the measurements of the absolute wavelength shift [76, 77]. In the second case, a better sensitivity and signal-to-noise ratio can be attained. Despite extensive use of the FPI technique in various domains, such as laser mode control [88], astronomy [89], gas temperature measurements [90], etc, its application is rather limited for sputtering discharges. Several existing works in this field are related to either Doppler profiling [91, 92] or particle VDF determination [76]. It should be noted that the sputtering plasma investigations by a time-resolved FPI are even sparser. Regarding this, the high-resolution time-resolved characterization of the HiPIMS discharges would be a challenging task.

Figure 8. A generalized experimental setup for (time-resolved) Fabry–Perot interferometry in a HiPIMS discharge including an optical fibre, interferometer with a controller, monochromator, detector (PMT in a photon counter mode), and synchronization system.
Download figure:
Standard image High-resolution imageOES imaging (OES-i). OES imaging is a very powerful tool for density mapping of the excited species in plasma. In order to study the plasma species selectively, this technique requires an optical filter with a desired band pass (usually about 1–10 nm) to be installed in front of an ICCD camera equipped with an imaging lens (see figure 9). In spite of the fact that OES imaging is a rather popular technique for both pulsed-dc [93, 94] and HiPIMS [95, 96] discharge characterization, it reveals the typical shortcomings of OES. Among the main OES-i drawbacks are (i) its qualitative nature, (ii) inaccessibility to the ground state species in the discharge (the excited states represent only a fraction of the total density of the considered particles), (iii) the ability to characterize a pulsed plasma discharge mainly during the on-time (which is very short in HiPIMS), and (iv) its line-of-sight nature. In addition, the difficulties in implementation of the line-ratio methods, or generally any methods involving spectral line intensity comparison using OES imaging, should also be mentioned.
Figure 9. A generalized experimental setup for time-resolved OES imaging in a HiPIMS discharge including an ICCD detector connected to a PC, and a synchronization system.
Download figure:
Standard image High-resolution image2.1.2. Resonant optical absorption spectroscopy (ROAS).
The principles. Absolute density determination. The principle of resonant optical absorption spectroscopy (also known as atomic absorption spectroscopy—AAS—or optical absorption spectroscopy—OAS) is based on absorption of the atomic or molecular spectral line(s) from a reference source by a gaseous medium containing species of the same kind (see figure 3(b)). In contrast to resonant absorption, the absorption using a continuum spectrum can also be employed for plasma diagnostic purposes, which is out of the scope of this review, however. Similarly to OES, ROAS represents a line-of-sight technique. A typical ROAS experimental setup for HiPIMS characterization is sketched in figure 10.
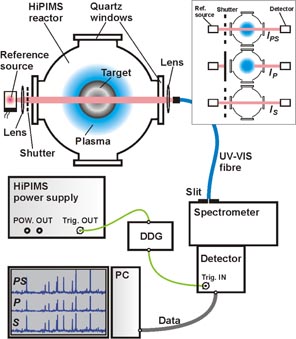
Figure 10. A generalized experimental setup for time-resolved ROAS diagnostics of a HiPIMS discharge including a reference light source, the tools for spectral acquisition, and a synchronization system. Inset: the illustration of the IPS, IP and IS quantities which are used in equation (9).
Download figure:
Standard image High-resolution imageROAS is known to be a reliable tool for absolute density determination in optically thin media. Its theoretical background is described explicitly by Mitchell and Zemansky [72], as well as in other sources [64, 97]. In the case of an optically thin medium with dominating thermal broadening of the spectral lines, its principle can be briefly explained as follows. The absorption coefficient k0 in a gas is linearly proportional to the density Nj corresponding to lower energy state j (usually the ground state) of a chosen spectral transition [72, 98]:

(where Nj is in cm−3, k0 is in cm−1, δσp (cm−1) is the FWHM of the plasma emission line, fji is the absorption oscillator strength, and j(i) stands for the lower(upper) state). fji can be determined as [72, 99]

(where gi(gj) is the statistical weight of the i(j) energy level). The absorption coefficient k0, in turn, can be deduced from the integral line absorption A [72, 100]:

(where L is the effective absorption length and α is the reference source-to-plasma line broadening ratio, representing the temperature broadening in this case). The last expression allows for determination of k0L, and so the absolute density Nj. The line absorption A is normally determined from the experiment as [72]

(where IPS, IP and IS are respectively the intensities of the chosen spectral emission peak(s) from the reference source passing through the plasma, the plasma itself, and the reference source only; see the inset in figure 10). Let us note also the role of the 'inactive' plasma regions, which can affect the IP value, but where no light absorption from the reference source occurs. Indeed, if for some reason collection of extra light (IEX) occurs from these areas, the corresponding portions of light are mutually cancelled according to equation (9), so the resulting line absorption value remains the same:
(where IPS, IP are the total measured signals, and
 ,
,
 are the signals corresponding only to the discharge area covered by the reference source beam).
The critical parameters for ROAS. Representing the line-of-sight methods able only to determine averaged density values (unless Abel inversion is applied), as well as due to the other factors, ROAS reveals a set of limitations/critical points listed below.
- It requires optically thin plasmas, that is, ones where k0L ≪ 1 (see [72, p 117]). This is in particular related to the spectral line shape which is assumed to be Gaussian (Doppler broadening).
- If a non-thermal broadening prevails in plasma, the appropriate corrections should be applied to the expressions given above (see [72, p 97]).
- In the Doppler-limited case both the plasma and source temperatures (i.e. the corresponding line width) should be well defined.
- In a typical ROAS setup, the reference source beam uniformity (level of collimation) is essential. If this is not the case, the absorption may reveal additional dependence along the beam. This fact promotes the implementation of diode lasers (DLs) as reference sources for ROAS [40].
- Due to inevitable instabilities in IP and IS signals, the IS value normally should not exceed IP by more than one order of magnitude: 1 < IS/IP < 10 [101].
- The absorption length L should be well defined during the measurements [98]. A significant error may be brought to the absolute density Nj determined by ROAS otherwise.
Diode laser ROAS. Due to its resonant nature, ROAS can be operated using the spectral emission line(s) originating from any type of light source. Hence, solid state diode lasers, especially the tunable ones, provide unique possibilities for resonant absorption in gaseous discharges [102]. A few main differences between them and the non-coherent sources (i.e. plasma discharge based, such as vapour discharges or hollow cathode lamps) are (i) the typical line width of a free-running DL (non-stabilized) can be as low as 20 MHz (≈0.02 pm at λ = 500 nm), and can be further reduced by about one order of magnitude [102], which makes the DL resolution comparable to that of interferometric methods, (ii) the wavelength tunability allows for direct measurements of absorption profile in the discharge [40], without the necessity of deconvolution, and (iii) the spectral purity of a single mode DL (i.e. with only one narrow spectral component) allows working without a monochromator. Moreover, the diode lasers are usually very stable in terms of both the output power and the wavelength [102]. Among the drawbacks of the tunable DL systems are their rather high price per spectral transition of interest, and narrow tuning range, which lies in the picometre range for Fabry–Perot cavity DLs without the laser mode hop [40], and reaches a few nanometres in systems with an external cavity [103].
Taking into account the fact that the density of absorbing species in low-pressure plasma might be quite low, which is especially true for metastable species, an artificial increase of L may significantly improve ROAS sensitivity. This principle is realized in so-called cavity ring-down laser absorption spectroscopy (CRLAS) [104], where diode lasers are normally used due to their highly collimated beam geometry. The implementation scheme of this technique can be found elsewhere [105]. The other implementations of the diode laser ROAS technique (also called tunable diode laser atomic spectroscopy—TD-LAS—or time-resolved direct absorption profile—TR-DAP [40]) are represented mainly by elemental analysis, including studies on methane detection [106], in inductive plasmas [107], in flames, etc (see [108] and references therein). This technique was also extensively exploited to characterize magnetron sputtered vapour as well as plasma species [40], including HiPIMS discharges [109, 110]. The number of species covered by the commercial DLs today exceeds 50 chemical elements [102]. For spectral line scanning purposes the ROAS experimental setup may include additionally a Fabry–Perot etalon for precise laser wavelength shift control [40].
2.1.3. Laser-based diagnostic methods.
Laser-induced fluorescence (LIF). Laser-induced fluorescence is a process based on the resonant absorption of radiation by atoms or molecules (in the first case it is also known as atomic fluorescence spectroscopy—AFS), which is followed by fluorescence light. Both the intensity and wavelength of the induced fluorescence depend on many factors, such as quenching and re-absorption of the fluorescence light and the intensity of the incident radiation (e.g. laser), and it can occur according to resonant, stepwise, direct, etc. processes, as analysed in detail in [97]. The principle of LIF described here is based on the so-called direct fluorescence scheme shown in figure 3(c).
LIF allows detection of the ground states, long lived metastable species, and under some conditions excited species in plasma. Its detection threshold in terms of the absolute number density of particles is estimated to be about 105–106 particles cm−3 [111]. In the classical case a short-pulse (∼10 ns) laser beam crosses the gaseous discharge, whereas the fluorescence radiation, often called the 'LIF signal', is detected aside. The use of short-pulse lasers is initially implied because of (i) high energy generated per pulse and (ii) the ability to detect the fluorescence emission (with micro second range or longer decay time) after the initial laser pulse. In spite of the presence of laser excitation of the plasma species, in most cases LIF can be considered as a non-intrusive technique, e.g. when low laser energies are used (roughly less than 1 µJ cm−3/pulse of the laser energy density in a plasma volume). The detection of the LIF signal is performed through an optical band pass filter installed in front of detect or in a typical LIF experimental setup, as shown in figure 11(a) (see also [86]).
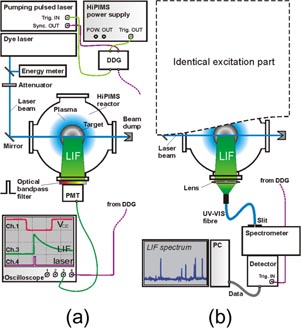
Figure 11. A generalized experimental setup for time-resolved LIF diagnostics of a HiPIMS discharge including pulsed YAG : Nd and dye lasers, beam guiding optics, detection tools, and a synchronization system. Either single fluorescence line detection (a) or LIF spectroscopy (b) can be realized depending on the detection scheme.
Download figure:
Standard image High-resolution imageAs for spontaneous emission, the LIF signal ILIF from the excited state i (figure 3(c)) can be expressed as a function of the laser-excited upper atomic state density:

(where Ni is the population of the excited level i). Since Ni is related to the population of the level of interest (Nj), assuming a far from saturation laser intensity Ilas, and laser pulse duration shorter than the measurement time, the relationship for the LIF signal can be expressed as [111]

(where C is the constant reflecting the laser excitation and detection geometry, Bji is the Einstein absorption coefficient, Qi and Ai stand for total collisional and spontaneous depopulation of excited level i respectively). This expression is obtained for low Ilas, when there is a linear proportionality between ILIF and Ilas, known as the 'linear LIF regime'. The linear dependence between ILIF and Ilas changes by saturation when the laser intensity gets too high (known as 'saturated LIF'), as described in detail by Amorim et al [111].
The first LIF implementation in plasma was the detection of Ar ions by Stern et al [112]. The application area of this technique has significantly increased since that time, covering nowadays a large number of atomic and molecular species [111], including the studies of possible chemical reactions [113]. As follows from equation (12), using LIF it is possible to determine the absolute species number density in state j, Nj (see figure 3(c)). In practice, however, the constant C, as well as the other constants for a chosen spectroscopic transition (such as Qi), are difficult to access. Due to this fact, it is commonly accepted for LIF to measure only the relative number densities in plasma. In some cases, however, when all the necessary constants can be determined as a result of calibration, the absolute number density is measurable [114]. This is also possible as a result of implementation of the other diagnostic techniques for calibration, for example ROAS [115], or Rayleigh scattering [116].
LIF spectroscopy. LIF signal detection through an optical filter leads to certain inconsistencies, which are first of all related to the optical width of the filter. Indeed, being rather expensive, the interferometric filters normally do not provide the tuning possibility for their band pass position and width. Moreover, the filter band pass FWHM is often spectrally limited by 1–10 nm, being unable to separate close spectral lines, which becomes critical especially when strong emission from plasma interferes with the LIF signal. This is especially important in HiPIMS discharges, where the plasma emission is very strong at the end of the on-time [117].
The mentioned inconveniences can be overcome using the LIF spectroscopy approach when the LIF spectrum (i.e. a set of the fluorescent emission lines) is obtained as a result of laser excitation being spectrally resolved by a monochromator, as shown in figure 11(b). Having the monochromator resolution equal to typically 20–50 pm, the emission lines located closer to each other in the resulting LIF + OES spectrum can be studied separately, enabling, for example, LIF rotational spectral analysis, which has several advantages as compared to that performed by OES [84]. The final LIF spectral resolution can be tuned based on the required compromise between the signal intensity and needed line separation. The LIF spectroscopy approach has recently been implemented for time-resolved study of HiPIMS discharge by Palmucci et al [118], as well as for gas temperature measurements using OH radicals by Xiong et al [84]. Among the drawbacks of the LIF spectroscopy, the dramatic (roughly one to two orders of magnitude) signal intensity drop as a result of passing the light through an optical fibre + monochromator should be mentioned.
Diode laser LIF. Traditionally, for a typical laser-excited fluorescence setup a tunable dye laser is considered as a light source. However, semiconductor DLs have been steadily improving in reliability, power, and wavelength coverage and stability, while steadily decreasing in cost, during recent decades. Nowadays, features of DLs related to narrow line width (as compared to the dye lasers), tunability, and spectral purity combined with several tens of watts of emission power, as well as the other features mentioned before, make them very interesting candidates for spectroscopic research [102, 119]. These advantages combined with the LIF ability to probe the ground and metastable state species in plasma bulk make diode lasers unique tools for high resolution plasma characterization in terms of the ground state density of species.
The tunable diode laser LIF technique (known also as tunable diode laser-induced fluorescence—TD-LIF—or laser diode-induced fluorescence—LDIF) has found numerous application for plasma discharge characterization, including measurements of Ar ion density in plasma by Severn et al [120], as well as for the other applications including flames [121] and biological studies [122]. This technique is utilized for investigations of the sputtered particle VDF in magnetron sputtering discharges by Vitelaru and co-workers [123, 124]. Let us note that most of the metals (used as target materials) typically require ∼3 eV to excite an atom from the ground state to a fluorescent upper state, which is readily accessible by the blue-range DLs. However, in the case of the bulk gas species (e.g. Ar), the first excitation level is generally separated from the ground state level by more than 8 eV, making such a transition lie deeply in the UV range. As a result, only absorption of a photon from metastable state(s) is possible with the available DLs in order to perform LIF characterization of the gaseous species in plasma. This point is additionally stressed in the next section.
Two photon absorption LIF (TALIF). If the energy difference corresponding to the spectral transition between states j and i (figure 3(c)) for LIF diagnostics lies in the deep UV, it can be covered by a two photon absorption process. In this case, the corresponding diagnostic method is called two photon absorption laser induced fluorescence (TALIF). Typical examples of species for which TALIF have been successfully used are light atomic species such as hydrogen, carbon, oxygen, nitrogen, and fluorine, which are very demanded in plasma processing. These, as well as many other molecular species along with their ions, have the first excited levels, optically connected to the ground state, at energies above 6.5 eV, so photo-excitation is only possible at wavelengths shorter than 190 nm [111]. Since photons with this (or shorter) wavelength are difficult to generate and deliver to a plasma without significant absorption, the TALIF technique should be applied.
The atomic excitation in the TALIF case can be represented by two consecutively absorbed photons having a virtual intermediate energy state l corresponding to the middle of the band gap between states j and i, as illustrated in figure 3(d). The TALIF experimental arrangement is identical to that used in the normal LIF experiments (shown in figure 11). In spite of this, there are several differences between LIF and TALIF from the physical point of view, which originate from different numbers of absorbed photons. Among them,
- the detection threshold for TALIF in terms of the absolute number density is estimated to be only about 1011–1012 cm−3 [111],
- since TALIF implies a two photon absorption process (with much lower absorption probability than for a single photon), the laser power density needs to be several orders of magnitude higher,
- the TALIF signal is proportional to the square of the laser intensity:
 [125] (compare to equation (12)), and
 - accompanying effects, such as generation of stimulated emission (known as two photon absorption laser induced stimulated emission—TALISE [111]—or amplified stimulated emission—ASE [41]) are typical for the TALIF technique as well.

LIF imaging (LIF-i). LIF imaging is a powerful technique for mapping the plasma species density distribution, as well as the other quantities (e.g. velocity distribution) in the gaseous discharges. The TALIF approach may also be used for this purpose, assuming both the laser intensity and the detected species density are sufficiently high. The experimental arrangement for LIF imaging combines the excitation part of the LIF method (figure 11) and a detection part used for OES imaging (figure 9). The laser beam for LIF imaging is normally made flat (also known as a 'laser sheet'), enabling the excitation of a definite plasma cross section, and allowing 2D mapping of the species concentration, etc. Combining the characteristics of the OES-i and LIF diagnostics, the advantages of the LIF-i technique can be summarized as follows.
- LIF-i provides a 2D map of the species in plasma, which can also be time resolved, which dramatically improves the time-resolved visibility of the plasma processes.
- Similarly to LIF, LIF-i has access to the ground state for some plasma species, so it is applicable for both the discharge and post-discharge areas, and during both the on- and off-time in the pulsed discharge case.
- LIF-i is a powerful technique to study the spatial distribution of metastable species in plasma, which often play a critical role in plasma kinetics.
- The excited volume in LIF-i entirely depends on the geometry of the laser beam, so the spatial resolution in the direction normal to the imaging plane can be made rather small (e.g. <1 mm).
- No Abel inversion procedure is necessary for LIF-i data processing since in most cases the detection is perpendicular to the laser beam. As a result of such detection, a definite discharge cross section in terms of the density of species is obtained.
Owing to its exceptional visualization power, the LIF-i technique finds numerous applications in the domain of plasma characterization in various types of discharge, including mapping of atomic species [126, 127] and radicals [128, 129], species velocimetry [130–132], temperature mapping [133], etc. At the same time, LIF imaging applications in magnetron sputtering discharges are less numerous and mainly represented by the group of Sasaki [132, 134, 135]. Time-resolved density mapping in a HiPIMS discharge has also been recently performed using LIF imaging by Britun et al [136].
Laser scattering techniques. Talking about the optical diagnostics of the gaseous discharges, the light scattering techniques, namely Rayleigh scattering (scattering on heavy gas particles) and Thomson scattering (scattering on free electrons), should be considered. Both techniques are based on the interaction of a laser beam with plasma particles in the region of interest followed by detection of the scattered radiation (in a certain direction), which brings information on the plasma parameters. The degree of intrusiveness of both techniques can be considered as vanishingly small, if the laser-induced effects in the studied plasma, such as photo ionization, are negligible. The schematic arrangement of a typical laser scattering setup resembles that of LIF, shown in figure 11, whereas the detection schemes may be more complicated, as mentioned below.
Rayleigh scattering is based on the fact that the electrons in the atoms and molecules emit similarly to dipole antennas when they are forced to oscillate under an external electromagnetic field (e.g. laser light). Since the scattered radiation is phase locked to the field of the external light source, in a medium with uniformly distributed motion-free atoms the scattering radiation should be cancelled in all but the forward directions. In real gases, however, owing to random motion of species, the fluctuations of the particle density lead to randomization of the phases of scattered light, resulting in direct proportionality between the number of scatterers and the intensity of scattered radiation. In the forward direction the scattered radiation remains coherent. As a result of laser beam scattering on the gas particles without an additional spectral filtering, the measured scattered signal includes a so-called 'Cabannes' (central) component, as well as the Raman rotational and vibrational components [137]. The contribution of the central Rayleigh component to the resulting spectrum is dominant. This component has a complicated structure and a typical FWHM of about 0.06 cm−1 (i.e. about 2 pm at 532 nm). Its polarization is directly related to that of the laser, so the scattering signal attains its maximum if a detector is placed in the plane perpendicular to the E-vector of the scattered laser beam. For more details on this technique the reader may refer to the corresponding reviews (see, e.g., [137] and references therein).
Due to its proportionality to the number of species, the Rayleigh scattering signal is widely used for determination of the temperature and relative density of the gas particles [137]. Besides this, it can be applied for LIF measurement calibration [116, 138, 139] and gas flow studies [140], as well as for the mapping of gas temperature [141], particle density [142], and gas velocity [137]. Provided with the necessary synchronization level, Rayleigh scattering can also find its applications in the pulsed sputtering discharges domain including HiPIMS, since it possesses high time (using a nanosecond range pulsed laser) and spectral resolution (e.g. using an FPI, see [140, 143]). The expected drop of the scattered signal in the case of low-pressure discharges should be considered as a definite drawback of this technique. Among the other drawbacks, the non-resonance nature of Rayleigh scattering, which does not allow different plasma species to be studied selectively, should be mentioned.
Thomson scattering is based on scattering of the external electromagnetic wave on free electrons in plasma. This scattering phenomenon enables the straightforward determination of two fundamental plasma parameters, namely the EEDF and Te [144]. Indeed, for example for the Maxwellian EEDF, the electrons should possess a velocity distribution with a Gaussian shape and characterized by thermal broadening (see equation (4)), similarly to heavy thermalized plasma particles. However, due to significantly smaller electron mass (roughly two orders of magnitude) and significantly higher electron temperatures (more than one order of magnitude) compared to those of heavy species, the Doppler broadening corresponding to the free electrons in cold plasmas is typically equal to a few nanometres [145], which is directly measurable by a standard monochromator equipped with an ICCD detector. For the sake of efficient blocking of the Rayleigh scattering appearing at the same wavelength (typically 532 nm), double or triple monochromator detection schemes are often used [144, 145]. After the experimental acquisition of the Thomson scattering spectrum, and determination of its broadening, Te and Ne can be determined using the following relations:


(where λ1/e (nm) is the half width at the 1/e level, Nm is the density of scattering molecules in the plasma, PTS(PRam) is the total Thomson (Raman) scattering power, and ΓRam represents the ratio between the Raman and Thomson scattering cross sections. Here the normalization to Raman molecular scattering is used for Ne determination; see [145] for the details).
Thomson scattering might be considered as a promising technique for a straightforward determination of Te and Ne time evolution in the target vicinity of the HiPIMS discharges, where the electron densities may reach 1013 cm−3 [70]. Far from this region, however, it might be difficult due to the overall domination of Rayleigh scattering on heavy plasma particles.
2.2. Other diagnostic techniques
In spite of the growing contribution of the optical techniques to the total plasma diagnostic workflow, the classical intrusive plasma diagnostic methods, represented first of all by electrical probes (often associated with Langmuir probes) and mass spectrometry, are among the main plasma characterization tools nowadays. This is also true for the domain of magnetron sputtering discharges, and particularly for HiPIMS. Since these two techniques are fairly well known and well described in the literature, for the sake of briefness only the main features are given here, along with the corresponding references, where more detailed description can be found. In addition, brief notes on the calorimetric probes and the pyrometry (IR thermography) technique are given.
2.2.1. Electrical probes.
Normally a metallic electrode inserted into plasma can be considered as a probe. As a result of measurements of the current I flowing through the probe as a function of the applied voltage V, one can obtain the 'probe characteristic', i.e. I(V). Based on the obtained probe characteristic the charge carrier concentration, the plasma potential, and the EEDF in the immediate neighbourhood of the probe can be obtained. This principle was proposed by Langmuir [146], and it still remains the most demanded plasma diagnostic method. In addition to single probes, double [147, 148] and triple [149–152] probes were also introduced mainly for the sake of stability; each of these is useful for slightly different purposes and has its own practical advantages. For a single probe, for instance, time-resolved values of the plasma potential Vp and floating potential Vf can be obtained [22]. Time-resolved Langmuir probe diagnostics is possible as a result of implementation of corresponding gating electronics (see, e.g., [153]).
In spite of the well-known shortcomings of Langmuir probe utilization in sputtering discharges, such as (i) probe contamination induced by sputtered species, (ii) presence of magnetic field (see [154]), (iii) plasma instabilities affecting the probe sheath size, and (iv) deviation from the Maxwellian EEDF, which is assumed for Vp determination, alternative tools having the goal of overcoming these limitations were proposed. Among them are the so-called emissive (or hot) probes [155–157], which produce electrons via thermionic emission, allowing more reliable Vp determination in pulsed sputtering plasmas [158–160].
Due to their straightforward use, apart from the other types of plasma, the pulsed magnetron sputtering discharges [22, 24, 71, 148, 153, 161–164] including HiPIMS [51, 152, 157–159, 165–170] are the objects of intensive study by electrical probes.
In addition to Langmuir probes, which deal with electrons, ion-sensitive probes were developed and described by Katsumata [171]. These probes are able to measure ion temperature and ion energy distribution function (IEDF), and were successfully applied to several plasma types [172, 173] including HiPIMS [174]. More details related to the electrical probe theory, implementations, and applications can be found in the corresponding articles [22, 150, 153, 156, 171, 175] and textbooks [64, 176].
2.2.2. Mass spectrometry.
The mass spectrometry (MS) technique (also called glow discharge mass spectrometry—GDMS [177]) deals with detection of the atomic and molecular charged particles in a plasma discharge. This technique attracts researchers due to the possibility of quantitative elemental analysis, high sensitivity, time resolution capabilities, etc. In particular, MS allows study of chemical reactions and chemical kinetics, which are crucial for complex gas mixtures [178]. Its principle is based on separation of the ionized species entering a detector aperture by their mass-to-charge ratio, for which quadruple mass analysers are often used due to their exceptional sensitivity [177]. Apart from the quadruple analysers, with the relatively new time-of-flight mass spectrometry (TOFMS) approach, a mass resolution of about 1 amu and time resolution in the nanosecond range can be reached [179, 180]. The analysis of the neutral species is also possible by implementing an auxiliary ionization stage before detection [181]. For MS analysis, normally a very small number of ions is required to reach the detector. This sometimes can give an advantage over the optical diagnostic methods, since a sufficiently sensitive MS apparatus can still detect the ions under very low plasma density, providing the dynamic range (in terms of ion current) in the range of 106–108 [64]. Because of this, the plasma remains practically unperturbed in terms of the extracted ions, thus providing a low degree of intrusiveness. However, since the analysis of the ion mass spectra occurs out of the investigated plasma volume, MS cannot be considered as a pure in situ diagnostic method (even though it might be called in situ sometimes [182]). It should also be mentioned that MS is normally dedicated to the diffuse regions in magnetron plasma rather than to the magnetized ones.
The MS analysis can be performed in a time-resolved way, if appropriate electronics based on the gated acquisition principle is implemented, providing a typical time resolution in the sub-microsecond range [178, 183]. Due to this fact, MS analysis is widely applied for characterization of the pulsed plasma discharges, such as the magnetron sputtering ones [184–187]. The contribution of this technique to understanding the charged particle transport in the HiPIMS discharges, primarily in terms of time-averaged [165, 188–194], as well as time-resolved [183, 194–197] IEDF analysis, should be especially acknowledged. Let us note additionally that the IEDF analysis is particularly important in the HiPIMS case, since the ion bombardment is a key energetic factor defining the film structure in these discharges. Talking about the MS spatial resolution, it should be noted that MS brings only space-integrated information about the species entering a detector, conceding here to the laser-induced diagnostics, where only a dedicated discharge area is analysed (see table 1). Furthermore, in the magnetron sputtering discharges, close cathode vicinity (millimetre scale) can be barely characterized using MS, primarily due to the rather bulky detection head, whereas ROAS, LIF, and TD-LIF approaches are advantageous here.
More information about the MS method along with its implementations for plasma diagnostics can be found in the corresponding literature [64, 177, 184, 185, 198, 199].
2.2.3. Calorimetric probes.
One of the key parameters in any plasma–surface interaction is the total flux of the incoming particles on a surface facing the plasma. Since this flux may induce a considerable substrate (film) heating, it is an important factor for sputtering discharges, where the energy of the sputtered particles, including neutrals and ions, can vary from few electron volts in DCMS [200] to several tens of electron volts in HiPIMS [35]. In such conditions the integral energy flux influences the thermal conditions at the substrate surface and, in addition to momentum transfer, it affects the microstructure, morphology, adhesion, and residual stress of the deposited films [201]. To measure heat flux coming to a surface facing plasma, calorimetric (thermal) probes are used [201, 202]. These are based on the principle that the heat flux balance is proportional to the temperature change rate on the probe surface (see [202] for details):

(where Pin and Pout are incoming and outgoing heat flux correspondingly; TS is the surface temperature). The thermal sensor itself often comprises a metallic plate with known area and heat capacity, to which a thermocouple is attached. The schematics and detailed working and calibration principles, as well as the experimental implementation of thermal probes, can be found elsewhere [203–205]. As a result of diagnostics using these probes, the heat flux expressed in W cm−2 is measured. This method, as expected, provides no selectivity with respect to the incoming particles measuring the integral heat flux. In spite of its rather low time resolution (s range), thermal probes cover the diagnostic domain, which is crucial in understanding of the plasma–surface interaction, especially dealing with low melting temperature substrates, such as the polymer materials. For this reason heat flux measurements recently found applications in pulsed sputtering discharges [206, 207], and HiPIMS [208, 209]. Due to the relatively compact size of a thermal probe, even a rough mapping of the energy flux around the sputtered cathode becomes possible, as reported by Lundin et al [208]. The inevitable contamination of the probe surface during sputtering, which may change its thermal properties, should be mentioned as a main drawback of this method.
2.2.4. Pyrometry.
In addition to analysing the heat flux induced by particles and radiation incoming to a surface facing plasma, it might be also necessary to perform a non-intrusive study of the surface heating process itself. Because of the presence of chemical reactions, surface temperature is especially important to study in the case of CVD or reactive PVD processes, such as plasma etching [210], reactive sputtering, etc. Surface temperature monitoring is particularly important in HiPIMS discharges due to their enhanced ion density, which leads to additional ion bombardment and thus surface heating [209]. These processes might be further complicated in the presence of a reactive gas. In many cases, contact with a studied surface is not desirable, because it may significantly alter local heat transfer (e.g. the substrate facing the magnetron), or might be difficult to achieve (e.g. the magnetron target). As a result of these considerations, the thermocouple measurements are not applicable in this case and special non-contact temperature monitoring is required. The pyrometry technique (also known as IR thermography—IRT—or IR camera imaging) represents a common solution. This technique is based on the measurements of IR Planck radiation from a solid body with a temperature higher than the ambient temperature. The result of wavelength integration of the well-known Planck black body radiation law for a body with the surface emissivity ε < 1 yields the Stefan–Boltzmann law (see e.g. [211]):

(where S is the total radiation flux, σ is the Stefan–Boltzmann constant and T is the temperature of the body). The relationship between the total irradiation S and temperature T is used for surface temperature determination. The emission from a body heated up to few hundred kelvin corresponds to the IR spectral range with a wavelength roughly equal to 1–10 µm, which is a typical working wavelength of commercial IR cameras. Pyrometry is widely accepted to be a reliable tool for surface temperature diagnostics in both thermal and non-thermal plasmas [210–212]. Recently it was applied for in situ target heating studies in DCMS [213] and HiPIMS [214] discharges. Apart from being a completely non-intrusive technique, pyrometry allows 2D surface temperature mapping, which might also be useful for plasma applications. Among the drawbacks of this method one can mention that (i) the radiation from plasma and reactor walls need to be taken into account, (ii) surface emissivity ε should be known precisely for reliable temperature determination [211, 213], (iii) the time resolution of this technique is not high, being typically in the sub-second range. For a detailed understanding, we refer the reader to the appropriate literature [211, 215].
3. Experimental characterization of HiPIMS discharges
3.1. Non-reactive HiPIMS discharges
Non-reactive HiPIMS discharges were chronologically the first ones to be studied by means of plasma diagnostics from the fundamental point of view, which is primarily because of their relatively low complexity. Indeed, the addition of molecular gases adds chemical reactions that can occur in the gas phase, as well as on the surfaces in contact with the plasma, complicating considerably the plasma–surface interaction. Regarding this, the present section deals only with the plasma characterization and plasma–surface interaction aspects during non-reactive HiPIMS discharges, and should be considered as an introductory part to the more complex processes involved in the reactive discharges, which are overviewed in the following section.
3.1.1. Cathode vicinity. Electrons dynamics and electrical potential.
Based on the electrical probe diagnostics, it is obvious that the EEDF in HiPIMS is a space- and time-dependent characteristic, evolving during the plasma on- and off-times. It is known that the plasma density reaches its maximum in the target vicinity, i.e. inside the strongly magnetized region of the discharge, where electron confinement occurs, and where the magnetic field lines are parallel to the target surface [35]. Then, the plasma expands towards the substrate and the electrons diffuse across the magnetic trap, filling the inter-electrode space. Early measurements at the substrate position revealed the presence of electron densities peaking to values as high as 1011–1013 cm−3 [70], which is a few orders of magnitude higher than what is commonly observed in DCMS cases (see figure 12). The increased electron density (and also temperature) implies an enhanced ionization rate, drastically affecting that of the sputtered (usually metal) atoms, through direct electron impact ionization. The increased ionization of the film precursors is the fingerprint of any IPVD process, so HiPIMS is certainly one of them, as mentioned above.

Figure 12. Spatial distribution of the electron density measured by Langmuir probe at several time delays (Δt = 40, 160, 280 and 640 µs) in a HiPIMS discharge. The pressure is 15 Pa. tON = 100 µs. A circular 150 mm diameter Ti target is used (located at the bottom). z denotes the distance from the target. Reproduced with permission from [70]. Copyright 2005 IEEE Publishing.
Download figure:
Standard image High-resolution imageThe time evolution of the EEDF in HiPIMS is deduced from the numerous time-resolved probe measurements. The works published so far highlight the presence of a distribution made up of several groups of electrons having rather different energies at the beginning of the plasma pulse. The EEDFs found are characterized by the presence of cold, hot, and sometimes also superthermal electrons [216, 217]. The latter may affect the floating potential, which becomes very negative at the beginning of the plasma on-time. This phenomenon should play a role in accelerating the positive ions reaching the floating surface and/or in the transport of the charged particles towards the substrate. The bombardment of the substrate by such superthermal electrons might also directly affect the film growth mechanism, e.g. by enhancing the mobility of the adatoms on the surface to finally induce the formation of denser coatings and nanocrystals, as previously assumed in [218].
As the plasma pulse progresses, these groups of electrons merge and form a single distribution characterized by unique (low) electron temperature. The interaction of the electrons with the sputtered material via electron impact ionization reactions is the origin of this cooling. The EEDF during this process undergoes so-called Maxwellization, as shown by Pajdarová et al [216]. The typical time evolution of both electron temperature and plasma density measured by the time-resolved Langmuir probe technique [216] is illustrated in figure 13. The electron heating and the increase of the plasma density during the on-time, as well as the electron cooling accompanied by the plasma density drop, are clearly visible. Towards the pulse end, the plasma is enriched by metal atoms, as highlighted in numerous research studies [218–222]. Electrostatic Coulomb collisions between the electrons present inside this dense plasma are also responsible for thermalization of the electrons towards the pulse end. The frequency of these collisions increases with increasing plasma density.

Figure 13. (a) Time evolution of the kinetic temperature of electrons (including hot electrons) in HiPIMS at average pulse currents Ida = 5 and 50 A. (b) Time evolutions of the electron density (Ne) and the ion density (Ni) at the same average currents. tON = 200 µs. The pressure is 1 Pa. Reproduced with permission from [216]. Copyright 2009 IOP Publishing.
Download figure:
Standard image High-resolution imageDetailed time-resolved analysis of the electrical potentials by Langmuir and emissive probes also highlighted the time-dependent evolution of the plasma potential in the non-reactive HiPIMS discharges. In particular, the plasma potential passes through a minimum. This situation leads to the development of a strong electric field inside the magnetic trap at the beginning of the plasma on-time [158, 217, 223], as illustrated in figure 14. This behaviour may impede the ionized metal atoms produced in the magnetized glow, close to the cathode and having a too low kinetic energy, crossing the electrostatic barrier that builds up and reaching the substrate surface, ultimately reducing the film growth rate. As argued in the work of Mishra et al [224], this steep potential barrier builds up at the early beginning of the plasma pulse, when the discharge current is not yet fully developed, and therefore when only a few metal ions are generated. At this moment, metal ions produced inside the magnetized zone would need kinetic energies above 190 eV. However, the potential barrier subsists for a long period and, towards the end of the pulse, the amplitude of the barrier is reduced (∼100 V). Most of the metal ions reach the substrate with a kinetic energy of about 20 eV, which could be either their ejection kinetic energy or an indication of their creation in the transitory region (located between the ionization and diffusion ones). According to figure 14, the electric field is weaker outside the magnetized discharge region and ions having lower kinetic energies would be able to move towards the substrate.
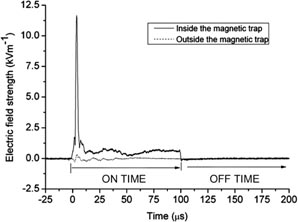
Figure 14. A plot of the temporal evolution of the mean axial electric field strength (Ez) inside the magnetic trap (z = 5 mm), shown by the solid line, and outside the magnetic trap (z = 65 mm), shown by the dotted line. tON = 100 µs. z denotes the distance from the target. Reproduced with permission from [224]. Copyright 2010 IOP Publishing.
Download figure:
Standard image High-resolution image3.1.2. Transport of film forming species.
As a result of electron transport in the direction away from the magnetron cathode, the interaction between the substrate (and the film surface) with the electrons, as well as with the sputtered (metal) ions, takes place. Metal ion transport has been extensively studied by dePoucques with co-workers, who performed time-resolved Langmuir probe and absorption spectroscopy measurements on sputtered Ti+, during the HiPIMS off-time. As a result of this analysis, the low-temperature electrons were detected synchronously with the metal ions [225]. The dynamics of the Ti ions found in this work is shown in figure 15.

Figure 15. Spatial and temporal distributions of the Ti+ ground state density (a) and the electron density measured by a time-resolved Langmuir probe (b) as a function of distance from the magnetron target (z), determined during the off-time in a short-pulse HiPIMS discharge. tON ≈ 10 µs. The Ar pressure is 4 Pa. Pulse energy EP = 0.5 J. Reproduced with permission from [225]. Copyright 2006 IOP Publishing.
Download figure:
Standard image High-resolution imageMore detailed ROAS study dealing with sputtering species in both ground and metastable states (Ti, Ti+, ArM, TiM) has been undertaken in a short-pulse HiPIMS discharge during both the on- and off-time by Britun et al [226]. The results clearly show the differences in time evolutions for various species in HiPIMS discharge, as illustrated in figure 16. As one can observe, after a certain depletion of the metallic species ground state density (Ti and Ti+), the waves of sputtered neutrals and ions are presented in the off-time. Sputtered Ti neutrals have a peak at Δt ≈ 100 µs, accounting for about 5 × 1011 cm−3 of the absolute number density. Furthermore, since the formation of Ti ions after the plasma pulse corresponds to a decrease of the measured Ar metastable (ArM) density, the contribution of ArM to Penning ionization of Ti (Ti + ArM → Ti+ + Ar + e) at the beginning of the plasma off-time is strong. Among the drawbacks of such a data representation, the assumption of a constant plasma temperature during the entire HiPIMS period, which is normally not the case during the on-time [39], should be mentioned. In spite of rather weak dependence of the number density on plasma temperature in the ROAS method (coming from equation (8)), appropriate corrections taking into account the particle VDF along the line of sight may need to be introduced.
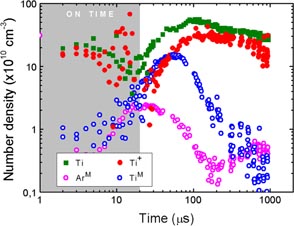
Figure 16. Temporal evolution of the absolute densities measured by ROAS during the on- and off-times in a short-pulse HiPIMS discharge. tON = 20 µs. tOFF = 980 µs. The pressure is 15 Pa. Pulse energy EP ≈ 0.3 J. Adapted from [226].
Download figure:
Standard image High-resolution imageThe diagnostic data available so far demonstrate that the metal ions in a HiPIMS discharge may be subjected to ambipolar diffusion. Therefore, guiding the electrons, i.e. by shaping properly the magnetic field lines of the magnetron cathode, and increasing their temperature, are the key aspects to enhance the transport of the film forming species. The impact of modifying the magnetic field lines is important, as highlighted by Bohlmark et al [227]. Some experimental arrangements, involving the superimposition of a secondary plasma to the HiPIMS discharge, allow an increase of the electron temperature as demonstrated by Stranak et al, who have built a hybrid HiPIMS–electron cyclotron wave resonant discharge process [228], as well as by de Poucques et al using an ICP-assisted discharge [225]. In the latter case, Langmuir probe data show that metal ion transport is accelerated as a result of using ICP as the electron temperature and hence the ambipolar diffusion coefficient are augmented [229]. These data confirm the assumptions made earlier [230].
Coming back to the magnetic field issue, it should be noted that it may undergo essential changes during the HiPIMS pulse. The time-resolved magnetic probe data reported by Bohlmark et al [231] revealed that the magnetic perturbation is caused by a succession of two phenomena: an early stage perturbation, which is in phase with the axial discharge current, and a late stage, which is not in phase with the current. The second perturbation is seen as a travelling magnetic wave that moves with a velocity of about 1 km s−1. According to the mentioned work, the magnetic perturbation is a combination of E × B drifting electrons and currents driven both by the pressure gradients and the shape of the magnetic field. Actually, processing the data obtained in [231] leads to the conclusion that the ratio between the Hall, E × B drifting, current density and the discharge current density for HiPIMS discharges is too low and cannot be explained satisfactorily by the known models. One possible reason invoked in [232], where electrostatic probe arrays of various geometries were utilized to analyse the local electric field during the HiPIMS discharge, is the occurrence of the so-called modified two-stream instabilities, which result in azimuthal electric field oscillations and anomalous cross-field electron transport in the E × B field, which, in turn, accelerates the ions tangentially above the target. Such a modified ion transport was first experimentally evidenced by the proper positioning of an energy-resolved mass spectrometer in the vacuum chamber, as reported by Lundin et al [191], which was further confirmed in [233] by using a Rogowski coil allowing spatially and temporally resolved measurements of both the axial and azimuthal current components in HiPIMS.
Later on, the first photographs of the azimuthal plasma inhomogeneities along with the value of their rotation speed (≈1 cm µs−1 for a 75 mm target) were obtained by Kozyrev et al [234]. In their work the authors explain the appearance of these inhomogeneities by increasing necessity for the plasma to sustain higher current densities. As the discharge changes in shape, becoming azimuthally inhomogeneous, the azimuthal electric field, directed across the magnetic field, appears. Consequently, first the plasma drifts with a high velocity, and second the plasma electrons are progressively heated further enhancing the ionization process.
The phenomenon of radial ion ejection was later confirmed using a retarding field analyser as well as by the IEDF analysis performed by a modified Katsumata probe, as reported in [174, 235]. It can be concluded that a noticeable number of metal ions are transported radially outward from the magnetized plasma and bombard the side walls of the deposition system. This could partially explain a decrease of deposition rate in HiPIMS [37].
3.1.3. Rarefaction and particle velocity distribution.
Due to the continuous collisions resulting in the momentum transfer between the sputtered particles and the bulk gas, a sputtering wind directed outward the magnetron cathode appears, which induces the gas rarefaction. This effect is rather strong in HiPIMS discharges as compared to DCMS ones, and important considering all the HiPIMS processes [35]. Indeed, due to the fact that the instantaneous HiPIMS current values significantly exceed those of DCMS at certain moments of time, one can expect a stronger rarefaction value as well. The presence of rarefaction in HiPIMS has been detected by numerous authors. One of the first quantitative characterizations of this phenomenon is undertaken based on the OES analysis by Vlček et al [236], where Ar atom rarefaction was analysed, as well as using the laser absorption spectroscopy approach by Vitelaru et al [109] (ArM analysis). In particular, based on their results, Vlček and co-workers concluded that the Ar density drop in HiPIMS might be as high as an order of magnitude, which correlates well with the theoretical estimations of rarefaction made by Anders [237]. However, being measured by OES and ROAS techniques, these results may not characterize the rarefaction locally, since they are based on line-of-sight detection, as mentioned above.
The modelling of rarefaction phenomena in HiPIMS was performed by Kozák et al [238], where the approximation of two HiPIMS discharge zones is utilized (the high-plasma-density zone adjacent to the target racetrack, and the low-plasma-density or transport zone). Two plasma pulse durations, 200 and ∼90 µs, are examined. As a result of the simulation, the time evolution of the discharge species density (Ar, Ar+, Cu, Cu+) is obtained. In particular it is found that Ar might be rarefied to about 0.54–0.6 of its initial density value near the target during the plasma on-time. These rarefaction values are noticeably smaller than those obtained by OES in [236].
Furthermore, since the sputtering process is far from being stationary in HiPIMS, the rarefaction in HiPIMS has a pulsed nature as well, and may reach the maxima and minima depending on the moment of observation during the entire HiPIMS period. It may also be dependent on the pulse duration and be even more pronounced in the case of short pulses (tON < 50 µs), assuming comparable average power levels. According to the recent time-resolved LIF measurements made by Palmucci et al [118], where the ground state densities of sputtered Ti and Ti+ were analysed in a short-pulse (20 µs) HiPIMS discharge, a strong correlation between the VDF of Ti and Ti+ and the gas rarefaction dynamics is suggested. According to these results, the moments of most intensive rarefaction occur at the end of HiPIMS pulses, and are accompanied by a significant increase of the Ti and Ti+VDF broadening (as verified for the velocity component parallel to the target—v||). During these time intervals (called 'rarefaction windows' in [118]) the momentum transfer between the energetic particles and the bulk gas is minimal, resulting in the abrupt increase of their velocity, as shown in figure 17.
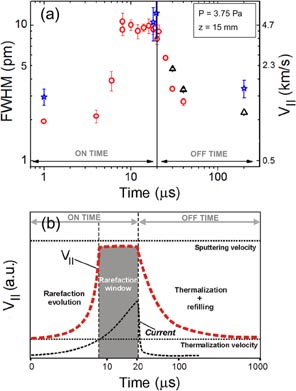
Figure 17. (a) The width (FWHM) of Ti (circles) and Ti+ (stars) VDFs determined in a short-pulse HiPIMS discharge as a function of time. The pressure is 3.75 Pa. tON = 20 µs. tOFF = 980 µs. EP ≈ 0.3 J. The FWHMs are presented after deconvolution with the laser line width. The data related to the off-time (triangles) are taken from [74]. The velocity component v|| corresponding to 1/2 FWHM is given for comparison. (b) A sketch illustrating the dynamic evolution of rarefaction in HiPIMS. Adapted with permission from [118]. Copyright 2013 AIP.
Download figure:
Standard image High-resolution imageA clear presence of density depletion for the sputtered species has been recently illustrated using the LIF imaging technique [136], as shown in figure 18. In this particular short-pulse HiPIMS case, the depletion interval (≈10 µs) and the depletion zones are clearly visible for both Ti and Ti+ at the end of the plasma on-time (20 µs). Both Ti and Ti+ densities gradually return to their initial state during the off-time, corresponding to the time delay Δt = 0 µs. As one can observe from figure 18, the main wave of the sputtered particles, both neutral and ionized, appears after the HiPIMS plasma on-time (at Δt ≈ 30 µs for Ti+ and at Δt ≈ 40 µs for Ti), clearly showing the particularities of the short-pulse HiPIMS sputtering process, where pulse duration is enough just to support the current rise stage of the discharge (see figure 19 in [35]). Besides this, the differences in location of the density maxima for Ti and Ti+ are clearly visible. In the case of neutrals the maximum is located on the magnetron axis, whereas for the ions it is located in front of the racetrack. In addition, an interesting change in the Ti+ density distribution after Δt = 100 µs should be mentioned. This effect might be related to several factors, such as the positive space charge redistribution in the absence of electric field during the off-time, electron trapping in the central part of the discharge in front of the target, since a balanced magnetron source was involved in the measurements, etc, which are the subjects of a separate forthcoming analysis.
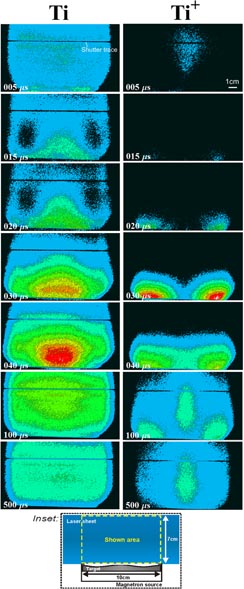
Figure 18. Two-dimensional normalized density maps of the ground state Ti and Ti+ measured by LIF imaging in an Ar–Ti HiPIMS discharge. tON = 20 µs. tOFF = 980 µs. EP ≈ 0.3 J. The pressure is 15 Pa. The time delay Δt is given at the bottom left corners. The discharge cross sections are made perpendicularly to the planar circular magnetron target (at the bottom) along its main diameter. Inset: sketch showing the geometry of the LIF imaging measurements. Adapted from [136].
Download figure:
Standard image High-resolution image
Figure 19. Top view of the racetrack of a HiPIMS target obtained by fast single-shot photography (using a PIMAX 1024 type camera). No spectral filtering is used. tON = 200 µs. The pressure is 1.7 Pa. Reproduced with permission from [241]. Copyright 2012 AIP Publishing. (b) A side-view streak image of HiPIMS discharge with tON = 80 µs, and 50 µs sweep duration. The pressure is 0.7 Pa. Reproduced with permission from [244]. Copyright 2012 AIP Publishing.
Download figure:
Standard image High-resolution imageThe shown time-resolved LIF imaging results first performed in HiPIMS [136] are generally in good agreement with the time-resolved ROAS data presented in figure 16. For example, the arrival time of the sputtered neutrals at the area studied by ROAS previously (about 5 cm above the target) is approximately equal to 100 µs, which is in total agreement with the LIF imaging results (see the 100 µs delay case in figure 18). However, in order to fully understand the observed phenomena, namely, the metallic density depletion, the timing of the sputtering particles, and spatial charge redistribution for Ti+, as well as the other effects, some additional measurements (e.g. Ar and Ar+ densities), possibly connected with corresponding modelling work, would be necessary. These studies are the subject of supplementary publications. It should be mentioned generally that the presence of the mentioned density depletion for the sputtered species in the HiPIMS discharge, following from the presented LIF-i and ROAS data, may point to the role of the (back-) accelerated bulk gas ions (and the reflected ions/neutrals) in the rarefaction process, as well as the importance of the rarefaction itself for the particle energy control. The dynamic rarefaction effects may be quite different, however, in the long-pulse (50–500 µs) HiPIMS discharges.
3.1.4. Plasma dynamics. New insights into the deposition rate issue.
In the framework of the present article, it should be noticed that further time-resolved investigations of the non-reactive HiPIMS discharge using current probes and optical spectroscopy tools actually revealed the non-uniform and complex character of the drifting plasma current above the so-called erosion 'racetrack' of metallic target, shown by Kozyrev et al in [234], as well as in [95, 159, 239–244]. The torus above the racetrack, as can be observed when looking at a circular magnetron target from the top, appears to be constituted of individual ionization zones, or 'spokes' [234], showing a high plasma density edge (see figure 19). The latter is considered as being the origin of electron emission out of the magnetized region [159, 244]. Moreover, the spokes can have different shapes depending on the second ionization potential of the cathode material with respect to the first ionization potential of Ar (15.8 eV, used as a bulk gas), as shown recently by Hecimovic et al [245] (see figure 20). Overall, these instabilities would be the source of the oscillating floating potential and plasma flares observed by electrostatic probes and fast imaging, respectively (see [95, 234, 241, 244]). Additional studies on the described HiPIMS plasma instabilities in terms of the ground state density of species would be of great importance.
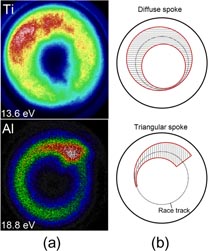
Figure 20. Images of spokes in HiPIMS for Ti and Al cases (a) and sketches of the spokes corresponding to diffuse and triangular shapes (b). The values in the bottom left corner are the second ionization potentials of the materials. The pressure is 0.2 Pa, tON = 200 µs, f = 10 Hz. The current density is 5 A cm−2. Reproduced with permission from [245]. Copyright 2014 IOP Publishing.
Download figure:
Standard image High-resolution imageThe cross-field ion transport originating from rather complex behaviour of the plasma above the racetrack might partially explain the low RD commonly encountered during HiPIMS experiments. Actually, the low-RD issue was highlighted at the early beginnings of the HiPIMS technology. Thanks to plasma diagnostic experiments carried out by time-resolved OES, the transition, during the plasma on-time, from a bulk gas-driven sputtering regime towards a metal ion-driven sputtering is indicated as being the main cause of the low-RD issue [218–220, 246, 247]. The sputtering wind would play a certain role in the evolution of the plasma–surface interaction [248, 249]. During the plasma on-time, as the current rises, an increasingly larger number of metal atoms are sputtered. These atoms enter the background gas with kinetic energies typically of the order of several electron volts. The exchange of momentum between the sputtered atoms and the background gas provokes a depletion of the bulk gas atoms in the target vicinity. In the meantime, metal atoms enter the dense magnetized region and are ionized. Finally, they are attracted back to the target and sputter the latter. The influence of sputtering wind has already been evidenced in dc magnetron sputtering experiments by Rossnagel [249], who used a local pressure probe. DCMS discharges exhibit significantly lower currents (and power) than HiPIMS discharges. In HiPIMS, laser spectroscopy methods allowed us to validate this hypothesis as well [109, 118].
Although the gas rarefaction, as induced by sputtering wind, now seems obvious, and is directly demonstrated by plasma characterization experiments, plasma modelling works emphasized that the main contribution to gas density reduction is actually ionization losses, that is, the bulk gas ions that are ionized in the target vicinity and which are attracted towards the cathode surface [250]. Therefore, so far, three factors should be invoked when discussing the reduced RD in HiPIMS discharges: (i) the propensity of the plasma–surface interaction to switch towards self-sputtering as the pulse progresses, (ii) the ejection of the metal ions radially outwards as a result of cross-field transport, and (iii) the presence of an electrostatic barrier built up during the plasma on-time and thus impeding metal ions escaping the magnetized region of the discharge.
It should be noted that the recent results in HiPIMS discharges have shown that the deposition rate RD varies in time [251] and also depends on the strength of magnetic field. Mishra et al [224] reported an up to sixfold increase of RD as a result of weakening B by 33% in pure argon. Recently, Čapek et al have performed a systematic evaluation of the effect of the magnetic field on RD with a Nb target [252]. Under their experimental conditions it was found that the weakening of B leads to a significant increase in RD by a factor of up to approximately 4.5, when compared with the high-B configurations. Nevertheless, the ionized fraction of the deposition flux onto the substrate was found to be comparable, despite a considerable difference in discharge characteristics (magnetron voltage and discharge current). They conclude on the general feature of this finding for any HiPIMS discharge and any target material.
3.1.5. At the substrate. Plasma–surface interaction during film deposition.
Let us consider the metal ions which are escaping the magnetized region and travelling towards the substrate. Numerous plasma diagnostic experiments, carried out earlier, were dedicated to the determination of the ionization rate, and thus to demonstrate the efficiency of HiPIMS operation. The question 'Is the HiPIMS technology a good candidate for ionized physical vapour deposition of thin films?' in most cases deserves an obvious positive answer. Many studies highlighted the presence of metal ions above the racetrack or at the substrate position [218, 219, 222, 253, 254]. In particular, absorption and emission spectroscopy data show that sputtered Ti could be ionized up to 70–80% or more in the plasma bulk [226]. Absorption spectroscopy measurement carried out at the substrate position clearly demonstrated the possibility to collect those metal ions [189]. Some research groups also utilized biased substrate holders or quartz microbalances in order to estimate the ionized fraction of the depositing flux [34, 255, 256]. It should be also noted that even multiply charged metal ions [257], or hard-to-produce carbon ions [258], were detected in HiPIMS using MS.
Another important issue when dealing with thin film formation, beside the metal ion production, is the kinetic energy of metal ions near the substrate. Here again, the results on energy-resolved MS highlight the clear discrepancy between HiPIMS and dc magnetron discharges. As we can see from typical time-resolved IEDF data (figure 21), a HiPIMS process is characterized by the presence of a high-energy group of particles with mean energy corresponding to about 20–30 eV, as discussed in numerous works [183, 191, 194, 195], and preliminarily explained by (i) the presence of ions that are part of the high-energy tail of the Sigmund–Thomson distribution (which originates from the collision cascade inside the target surface), (ii) metal ions that have undergone charge exchange with faster ions, (iii) back-reflected metal ions [183], and (iv) ions that are accelerated by the increased plasma potential [165]. Even though the energetic particles exist during a time comparable with the plasma on-time [195], the resulting time-averaged effect is still pronounced, creating the essential difference between the HiPIMS and DCMS discharges, as illustrated in figure 22. As one can see, the high-energy part of the IEDF is very pronounced in the HiPIMS case, especially in the target vicinity [191]. From this plot it can be understood that metal ions have much higher kinetic energy in the HiPIMS discharge, as they land on the substrate surface. Another example of the time-averaged IEDF measurements [188] shows that the metal ions (Ti+) typically have a high-energy tail in their IEDF, whereas the IEDF of the bulk gas ions (Ar+) does not reveal it (see also [183]), as shown in figure 23.
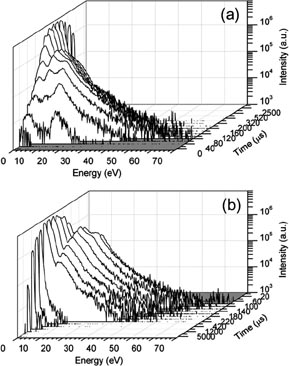
Figure 21. Time-resolved evolution of Cr+ IEDFs measured in a HiPIMS discharge for Δt = 0–2.4 ms time delay interval. (a) The start of the pulse, and (b) post-discharge interval and the decay in the IEDF intensity. tON = 70 µs. The pressure is 0.3 Pa. Reproduced with permission from [195]. Copyright 2009 IOP Publishing.
Download figure:
Standard image High-resolution image
Figure 22. Comparison between Ti+ IEDFs in HiPIMS and DCMS discharges operating at the same average power measured at the distance from target z = 1 cm. (b) Ti+ IEDFs related to HiPIMS measured at different z. The pressure is 0.80 Pa. HiPIMS tON = 90 µs. Pulse energy EP = 2.2 J. The curves are normalized. Reproduced with permission from [191]. Copyright 2008 IOP Publishing.
Download figure:
Standard image High-resolution image
Figure 23. The IEDFs of (a) Ar+ and (b) Ti+ measured in a HiPIMS discharge with tON ≈ 100 µs. The Ar pressure is 0.4 Pa. EP = 3 and 10 J. The recorded counts have been adjusted with the corresponding isotope abundance. Reproduced with permission from [221]. Copyright 2006 Elsevier Publishing.
Download figure:
Standard image High-resolution imageFrom the particle energy point of view, the plasma species bombarding the substrate during a HiPIMS process transfer some energy to a growing film, hence modifying its growth mechanisms. The energy flux in this case (induced by a variety of bombarding species such as ions, electrons, metastable atoms, photons, etc) can be determined by calorimetric probes. The first striking observation is the reduced substrate heating in HiPIMS (as compared to dc discharges at the same average power). At the same time a dramatic increase of the energy per adatom in HiPIMS discharge is registered, which is primarily due to the lower RD and thus lower deposition flux typically obtained in HiPIMS. It should be noted that other works also report the energy flux per adatom [259, 260] to be lower in HiPIMS under some particular working conditions. Angle-resolved measurements [208, 261] show that the heat flux is not homogeneously distributed around the sputter target. For a planar circular target, the radial energy flux is important and can reach a value equal to 60% of what is detected on the target-to-substrate axis. This observation is attributed to the anomalous transport described in [208]. When compared to DCMS discharges, a significant off-axis deviation of the energy flux is also observed for the measurements run on a rectangular cylindrical rotating magnetron cathode (see figure 24).
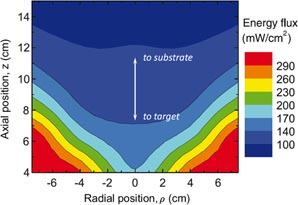
Figure 24. A two-dimensional map of the energy flux measured in a HiPIMS discharge using a thermal probe facing the magnetron surface. tON = 100 µs. The Ar pressure is 0.53 Pa. The average applied power is 500 W. Reproduced with permission from [208]. Copyright 2009 IOP Publishing.
Download figure:
Standard image High-resolution imageUsing a calorimetric probe capable of a time resolution in the millisecond range, the energy flux brought to the substrate by plasma species as well as by radiation was also studied by Cormier et al [209]. In this study it is shown that two flux components contribute mainly to the substrate heating in HiPIMS. The fast component contributes 'immediately' as soon as the discharge is switched on and is attributed to the collisional mechanisms in the discharge. The second one is much slower and increases progressively with time until saturation is reached. It was concluded that the slower contribution is related to the IR radiation from the target surface. The latter heats up gradually as a result of intense ion bombardment, until it reaches an equilibrium temperature. From the measurements made, significant differences between the DCMS and HiPIMS sputtering regimes in terms of both the heat flux to the substrate and its temporal evolution (i.e. saturation time) are highlighted (see figure 25). Additionally, data processing gave an insight into target equilibrium temperatures in the DCMS, pulsed-DCMS, and HiPIMS discharge cases run under balanced and unbalanced magnetic fields. Although the discharges were driven under the same working conditions, the target surface temperature appeared to be highest (870 °C) in the case of a HiPIMS-driven balanced source. It is suggested that in the case of the balanced magnetic field, the ion trapping in the cathode vicinity is enhanced, along with the discharge current and ion bombardment of the target surface. As a consequence, the IR radiation from the (hot) target is considerable, and it becomes an important contribution to the resulting heat flux in this case. The direct target temperature measurements made in HiPIMS by Tesař et al [214] shows its increase with the average discharge pulse current. In the case of a hot, non-cooled target, the dependence on discharge current is non-linear and would reveal, according to the authors, a loss mechanism other than via IR radiation at temperatures above 1500 °C. In some particular experimental cases, such as high target peak power during the reactive HiPIMS of tungsten in an argon/oxygen ambient, it was also assumed that the observed enhanced deposition rate might be induced by the partial thermal evaporation of the target surface [262].

Figure 25. A comparison between the energy flux time evolution in (a) DCMS and (b) HiPIMS discharges operated at the same average power level (400 W). The pressure is 0.66 Pa. HiPIMS tON = 20 µs. The longer saturation time in the HiPIMS case originates from IR radiation from the gradually heated target. Reproduced with permission from [209]. Copyright 2013 Elsevier Publishing.
Download figure:
Standard image High-resolution image3.2. Reactive HiPIMS (R-HiPIMS) discharges
The diagnostic of reactive HiPIMS (or R-HiPIMS) discharges, especially the plasma bulk region, is still at an early stage in spite of the importance attached to mastering the coating properties using this technology. Most of the studies performed so far have been mainly focused on film and compound coating properties, and less have been devoted to detailed time- and space-resolved diagnostics of the reactive species during both the high-power pulse and the following afterglow, as well as at different locations in the plasma volume.
There are several review papers presenting the HiPIMS technology, and also dealing with the plasma properties, with only a couple of them touching on reactive HiPIMS [35, 37, 263]. We intend here to update and extend the focus in the previous works by highlighting the recent advances made in studying the kinetics and densities of the reactive species as well as their interaction with the surfaces (such as target and substrate) in R-HiPIMS discharges.
As generally known, the reactive sputtering process consists of mixing a reactive gas (often O2 or N2) with the noble working gas (normally Ar), leading to the deposition of compound thin films (e.g. oxides or nitrides). The high power delivered during the pulse (>10 kW cm−2) generates high electron density and more energetic electrons as compared to the DCMS case [169]. Hence, in the presence of molecular gases the dissociation processes and thus the volume and surface reactivity are enhanced as well.
Below, the specificities of the target, plasma, and substrate related phenomena are presented and discussed as they emerge from the various diagnostic techniques.
3.2.1. Cathode poisoning in R-HiPIMS. Hysteresis effect.
Operating in the reactive mode, conventional DCMS discharges typically exhibit hysteresis (non-linearity of the discharge parameters and even the instabilities), as a function of the amount of reactive gas in the mixture. It is known that on increasing the amount of the reactive gas cathode 'poisoning' occurs, and the discharge switches to the so-called 'oxide' ('nitride' ...) mode, which is characterized by an almost complete oxidation (nitriding ...) of all the surfaces, including the surface of the cathode [264]. Generally, the operation in the oxide mode gives stoichiometric compound films [15, 263, 265].
In line with dc measurements, several works report that the shape of the hysteresis loop changes in HiPIMS discharges as well. Very different observations have been made, starting from situations corresponding to 'hysteresis-free' and smooth transition between metallic and reactive modes [266] and ending with the clear presence of hysteresis [267].
The suppression of the hysteresis effect (when the HiPIMS discharge runs under the same conditions as the DCMS one) was announced by Wallin and Helmersson [266]. This was a very promising result, opening new pathways for compound thin-film processing (figure 26), which was explained by very effective target surface cleaning during the high-power pulses avoiding, or at least limiting, the target oxidation to higher flows in the regions bombarded by energetic ions (racetrack). Target poisoning was assumed to occur between pulses (during the afterglow). However, the arcing observed in reactive mode forced the end of the measurements before reaching the very high oxygen fluxes. In spite of this fact, the deposition process stabilization (hysteresis-free case) has only been reported for a narrow range of the experimental HiPIMS parameters [266, 268]. Sproul et al [269] underlined the need for a feedback control of the reactive gas partial pressure. Both the arcing and the control of the process operation point have been mentioned by Audronis et al [270] as two of the most important issues limiting reactive HiPIMS applicability. An optical measurement regulation using the metal line emission (i.e. PEM) has been proposed, and it was claimed that there is no clear evidence to support the hysteresis elimination/suppression in HiPIMS, as observed for a variety of target–gas combinations. Another regulation system was proposed by Vlček et al [271], allowing a significant improvement of the deposition rate.
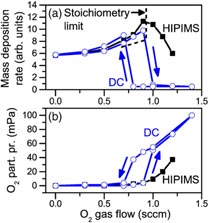
Figure 26. Rate of deposited mass (a) and O2 partial pressure (b) as a function of O2 gas flow for HiPIMS and DCMS. The approximate limit for deposition of stoichiometric alumina (Al2O3) is shown in (a) by a dashed line. Measurements for higher O2 flows than those indicated for HiPIMS were unreliable due to target arcing. Reproduced with permission from [266]. Copyright 2008 Elsevier Publishing.
Download figure:
Standard image High-resolution imageAt the moment, the situation is far from a compromise and research is still ongoing in order to clarify the mechanisms responsible for hysteresis in R-HiPIMS. Sarakinos et al have advanced the hypothesis of gas rarefaction [272], as have Kubart et al [267]. It was also suggested that the sputtering yield changes as a result of the increased target discharge voltage during the HiPIMS process [268]. Audronis et al [273] suggest the effect of oxygen implantation into the target, more pronounced in HiPIMS than in DCMS due to its higher operation voltages. Others assumed that the implantation of metal ions would reduce the target oxidation state and that the dissociation of the metal-oxide compound sputtered from the target might also contribute in damping the hysteresis curve [274]. One of the main difficulties in explaining this phenomenon may come from the lack of time-resolved diagnostics, allowing for the detection of the reactive species during the hysteresis. Indeed, the latter explanations aim to relate the different time-dependent phenomena (on- versus off-time) to the observed time-averaged overall effect of the reactivity on macroscopic discharge parameters (e.g. voltage, peak current, O2/N2 partial pressure, etc) as a function of the reactive gas flux.
Several HiPIMS parameters were examined while working with a Ce target in an Ar/O2 mixture by Aiempanakit et al [275]. They conclude on the possibility of suppressing the hysteresis observed in DCMS finally controlling the process and the possibility of achieving a smoother transition from metallic to compound sputtering mode. In the used deposition system, optimal behaviour with respect to the hysteresis width has been obtained in the repetition frequency range f = 2–4 kHz, as shown in figure 27. The Ar/O2 mixtures using a Ti target were studied by Kubart et al [267], aiming to find the optimal conditions which would allow them to maintain the highest RD of a stoichiometric compound. The pulse duration (50 µs) and the average power (400 W) have been kept constant, to compare the repetition rate effect on the hysteresis. In addition, the effect of target erosion on hysteresis width is described.
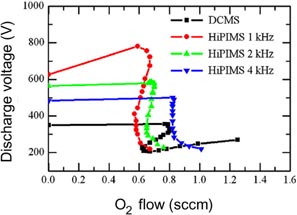
Figure 27. Comparison of the discharge voltage variation as a function of the O2 flow between reactive DCMS and HiPIMS discharges using a Ce target. For the HiPIMS process the repetition frequencies of 1–4 kHz are shown. The average discharge power is 70 W. The Ar partial pressure is 0.65 Pa at a pumping speed of 25 l s−1. Reproduced with permission from [275]. Copyright 2011 Elsevier Publishing.
Download figure:
Standard image High-resolution imageThe main conclusion from the abovementioned data is the possibility to obtain the right compound stoichiometry in spite of the rather limited R-HiPIMS experimental windows (see figure 26(a)). This could be related to higher ability for the HiPIMS discharge to dissociate the molecular gases, which would enhance the plasma reactivity and lead to full stoichiometry at a lower amount of reactive gas in the mixture as compared to the DCMS case [276].
In order to tackle the microscopic reactivity, Lundin et al [263] have considered the limited activation of the reactive species during the plasma off-time because of the absence of plasma, as suggested by Depla et al [15] due to the short expected lifetime of O metastable atoms (OM), estimated to be roughly 2 ms for helicon discharges in [277].
Recent time-resolved results obtained by Vitelaru et al [110] have shown that the OM may be present in the discharge volume up to 30 s after the stop of the O2 flux (see figure 28). The oxygen atoms originate from the surfaces (target and walls) and are excited leading to the OM state, most efficiently in the afterglow ∼400 µs after the end of the pulse. OM can be detected at Δt = 1 ms after the pulse, which is consistent with the previous OM lifetime estimations [277]. Also, the long time required to remove the oxygen from the walls is consistent with a deeper implantation due to the HiPIMS higher operation voltage, higher ion oxygen bombarding flux onto the target (Ti), and both neutrals and ions reaching the walls, as discussed in the following section.

Figure 28. Time traces of OM absorbance at maximum absorption wavelength for 4 Pa of pressure, and z = 2 and 5 cm, at different time points after the O2 flow stop (trem). tON = 50 µs. All curves are drawn on the same scale. Reproduced with permission from [110]. Copyright 2013 AIP Publishing.
Download figure:
Standard image High-resolution image3.2.2. Target-vicinity phenomena (sputtering versus self-sputtering).
Generally, the erosion rate of a compound target is lower than that of a pure metal, which is normally due to the higher sputtering yield of metals. Also, the secondary electron emission yield of metals is most of the time lower than that of the compounds formed on the target. This situation leads to a decrease of the discharge voltage during the pulse slightly affecting the discharge current [35, 278]. Hence, for some materials current rises, whereas it decreases for others, when the transition to the reactive mode occurs. Two cases considered below are related to use of the R-HiPIMS with or without pre-ionization before the high-power pulse.
Current and voltage waveforms in R-HiPIMS with pre-ionization. The pre-ionization stage in HiPIMS is used to generate a low-density plasma prior switching on a high-power pulse. This way of generating the HiPIMS discharge is especially required in the short-pulse (tON < 20 µs, low-duty-cycle) HiPIMS cases, or if the off-time is considerably higher than the lifetime of the ions in the discharge (see, e.g., [37] and references therein).
The change of the current pulse shape in reactive HiPIMS has been reported by Benzeggouta et al [279] in an R-HiPIMS with pre-ionization [280] operating in an Ar/O2 mixture with a Ru target. Similar results are reported by Nouvellon et al [274] for Ti in the Ar/O2 gas mixture and by Hemberg et al [262] during sputtering of W in the same mixture. In [274] the authors assumed that the increase of target current is a consequence of dissociation and subsequent ionization of O2 molecules, hence ultimately providing two atomic oxygen ions per introduced oxygen molecule. As can be deduced from figure 29, the transition from metallic to oxide mode occurs for O2 flow rates
 ranging between 1 and 2 sccm, which is confirmed by OES measurements. The same triangular form of the current is observed by Leroy et al [261] for a short-pulse (5 µs) HiPIMS process involving a rotating cylindrical magnetron. Some distinctive differences of current waveforms in the metallic and oxide modes were found, namely a slower current growth at the beginning and a rapid increase at the end of the on-time in the oxide mode, as compared to a nearly triangular current shape corresponding to the metallic mode (figure 30). Similar differences in the discharge current waveforms were also found in [281] later (see the next section).

Figure 29. Time variations of the magnetron current for two pressures, (a) 0.5 and (b) 5 Pa, and for various O2 flow rates
. f = 250 Hz, tON = 10 µs; the maximum voltage is 1 kV. Reproduced with permission from [279]. Copyright 2009 IOP Publishing.
Download figure:
Standard image High-resolution image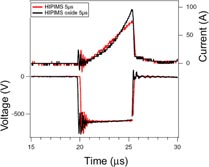
Figure 30. Current and voltage waveforms during sputtering of a rotating cylindrical magnetron target in the HiPIMS mode (tON = 5 µs), in metallic and reactive modes. Reproduced with permission from [261]. Copyright 2011 IOP Publishing.
Download figure:
Standard image High-resolution imageChanging the repetition rate f, the discharge current integrated over the pulse duration changes as well, independent of the pressure (0.5 versus 5 Pa; see figure 31). At low pressure (0.5 Pa) and f = 500 Hz the transition from metallic to reactive mode occurs at an O2 flow rate ∼1.5 sccm, while at lower frequency (100 Hz) this rate is below 1 sccm. At high pressure (5 Pa), the transition seems to appear at slightly higher O2 flow rates. These results would support the increased target cleaning efficiency at higher frequencies, which is assumed to explain damping of the hysteresis curve [267].

Figure 31. Variations of the discharge integrated current as a function of O2 flow rate at two total pressures of (a) 0.5 Pa and (b) 5 Pa. Other parameters are as in figure 29. Reproduced with permission from [279]. Copyright 2009 IOP Publishing.
Download figure:
Standard image High-resolution imageCurrent and voltage waveforms in R-HiPIMS without pre-ionization. The current shape in the HiPIMS pulse differs from the case when a power supply without pre-ionization is used, generally operating with longer pulses. Hála et al have explored both HiPIMS and MPPMS discharges in reactive Ar/O2 mixtures while sputtering a niobium target. They have compared the two mentioned IPVD discharges with a standard DCMS one [282]. Let us note that the MPPMS power supply generates a sequence of short-duration voltage micro-pulses (with a duration of typically several microseconds to several tens of microseconds), comparable in duration with the pre-ionized systems.
Under an increase of the O2flow rate (figures 32(a) and (b)), the current waveforms for the HiPIMS (200 µs) discharge reveal a significant elevation, whereas in the MPPMS case (1500 µs) they behave differently: the current increases only at the beginning of the high-power pulse segment when the amplitude oscillations start to develop. The observed current rise in both techniques can be related to either target surface phenomena or gas-phase phenomena. The recorded current waveforms for different frequencies f, while keeping the gas composition fixed (Ar/O2 flow rate = 44/5 sccm), are shown in figures 32(c) and (d). Both the peak current values in HiPIMS, and the number of periods and the duration of large-amplitude current oscillations in MPPMS, increase with decreasing f (i.e. at longer plasma off-time) in a similar way as with rising Ar flow rate. It was concluded that the modifications of the pulse current waveform with varying f cannot be fully ascribed to the gas rarefaction–refill phenomena illustrated in [237, 267]. Indeed, the estimated gas refill time in HiPIMS is typically 50–100 µs [283], whereas tOFF in the present experiments is of the order of tens of microseconds. Hence, the observation of a similar pulse current evolution due to the variation in the O2 flow rate and frequency excludes the gas-phase 'volume' processes as a primary origin of the observed current growth, as will be discussed in section 3.2.3.

Figure 32. Effects of the O2 flow rate (a), (b) in Ar/O2 mixture (f = 50 Hz) and of the repetition frequency f(c), (d) (O2 flow = 5 sccm) on the pulse current waveforms of the HiPIMS (a), (c) and MPPMS (b), (d) discharges. Reproduced with permission from [282]. Copyright 2012 IOP Publishing.
Download figure:
Standard image High-resolution imageA high instantaneous value of cathode voltage is identified as the main parameter enhancing the target cleaning in HiPIMS, primarily via (i) higher secondary electron emission from the oxidized target surface and increased ion energy [284] leading to higher density plasma and (ii) higher sputtering yield of the bombarded metallic or oxidized surface scales with the energy of the impacting ions [285, 286]. Consequently, the simultaneous effect of the elevated ion fluxes (due to the high plasma density) and the increased sputtering yield (due to the higher impacting ion energy) results in an efficient sputter-erosion of niobium oxide compounds in both types of high-power pulsed discharge.
A detailed analysis of the discharge current waveforms using the examples of both long- and short-pulse HiPIMS discharges is undertaken by Aiempanakit et al [281] using Ti and Al as the target materials. Clear differences in the current time evolution between the metallic and oxide HiPIMS modes are obtained in this work. It is demonstrated that the discharge current in the oxide mode grows more slowly at the beginning of the pulse (than in metallic mode), but significantly overtakes the current values typical of the metallic mode at the end (see figure 33). The authors suggested that the elevation of the discharge current found in the oxide mode (by a factor of two or more) is related to the secondary electron emission induced by the Ar+ ions. The longer current build-up time in the case of Ti (as compared to Al) at the beginning of the pulse is explained by the lower secondary electron emission during Ti sputtering, whereas the current rise at the end is suggested to be due to the ionic current, as a result of preferential sputtering of O, and formation of O+ ions in the target vicinity.
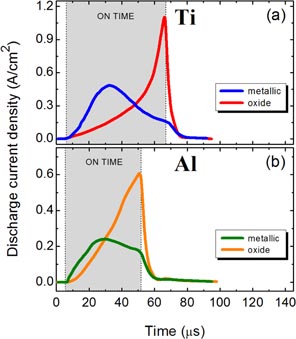
Figure 33. Discharge current evolution measured in short-pulse HiPIMS discharges in metallic and oxide sputtering modes. Working pressure = 0.8 Pa, f = 500 Hz. (a) Ti sputtering: tON = 70 µs, averaged power = 100 W. (b) Al sputtering: tON = 50 µs, averaged power = 50 W. Reproduced with permission from [281]. Copyright 2013 AIP Publishing.
Download figure:
Standard image High-resolution imageGas rarefaction and self-sputtering. In the other experiments, in contrast to those used in [282], Magnus et al [287] utilized a Ti target in a reactive Ar/N2 HiPIMS discharge. The significant increase of the current at low frequency has been attributed to an increase in the secondary electron emission yield as the self-sputtering regime is ignited while the target surface is nitrided. The authors observed a significant reduction of the secondary electron emission yield when the self-sputtering starts to play a role (induced by a single ionized metal), i.e. when the discharge is driven by metal sputtering (the target surface is mainly metallic), in opposition to the situation dominated by N+ bombardment (compound mode). Here it should be noted that the RD in compound mode at low frequency should increase. However, in the case of compound deposition, RD decreases due to the low sputtering yield of the compounds. This occurs for various reactive sputtering conditions with HiPIMS (TiOx, AlOx, CrNx), where RD differing by a factor of three or more in the reactive sputtering case was found compared to pulsed-DCMS operating at the same average power (see [35] and references therein). In addition, the effect of the pulse width on RD, reported recently by Brenning et al [288], should be taken into account.
The rarefaction process has been analysed by Kubart et al [267] involving the refill phenomenon proposed by Lundin et al [283] for non-reactive HiPIMS. The longest refill time estimated from a series of experiments with different off-times is found to be about 5 ms. Hence, if the off-time between two pulses is shorter than the refill time, the oxygen flux to the target surface will be reduced, leading to lower poisoning. This idea is illustrated in figure 34 by the measured change in the peak current for a fixed discharge voltage. According to this figure, the amplitude of the peak current in reactive mode versus the total peak current exhibits a reduction. If the area under the pulse current waveform is assumed to be proportional to the gas density, the amplitude of the current waveform will be an indication of the rarefaction. Based on this assumption, it was found that for higher peak currents the rarefaction is somewhat stronger, as reflected by the lower amplitude. However, such a current reduction may also be explained by a reduction of metallic species sputtered in the reactive mode and consequently a decrease of the wind effect [109, 193].

Figure 34. Reduction of the peak current amplitude as a function of the peak current itself, for metallic (solid line) and reactive (dashed line) modes for a Ti target with tOFF = 150 µs. f = 4 kHz. Reproduced with permission from [267]. Copyright 2011 Elsevier Publishing.
Download figure:
Standard image High-resolution imageConcerning the angular distribution of sputtered particles, Leroy et al have undoubtedly demonstrated for a rotating cylindrical magnetron that the shape of the angular distribution is identical for all sputter modes [261]. As the deposition profile is the same, they conclude that not only is the emission profile the same, but also the transport of the particles from the target to the substrate. Horwat et al [289] found the same behaviour using a planar magnetron in a Cu HiPIMS discharge. The transport of the sputtered material through the plasma and the substrate related phenomena are discussed in the next sections.
3.2.3. Bulk plasma particularities in R-HiPIMS.
The volume kinetics and the species transport in reactive HiPIMS discharges have been mainly characterized by optical emission and laser-based techniques resolved in time and space, as well as by MS or RD measurements. The major research directions along with the corresponding results are summarized below.
Emission analysis. For the current waveforms presented in figure 32, the selected emission lines of Nb, Nb+, Ar, Ar+, and O during the pulse (200 µs) in both HiPIMS and MPPMS were monitored by Hála and co-workers [282]. The same OES approach for studying the dynamics of another HiPIMS plasma (Ar : N2 = 1 : 1) with a Cr target was studied before by the same authors [290], as presented below. According to the results, almost all the densities reach their maxima together with the discharge current, i.e. at Δt ≈ 35 µs, except the neutral Nb, which is slightly delayed, and Ar, which is found in advance (≈10 µs). The faster rise of Ar, which has been already observed by laser absorption [109], must be explained here by the absence of the loss paths for Ar at the beginning of the plasma pulse.
After the initial line intensity maximum, all the emission signals decrease significantly for 25 µs < Δt < 50 µs, despite little variation in discharge current during this time interval. The authors explained their observation by invoking the growing amount of sputtered metal, that leads to working gas rarefaction in front of the target. Then, for the rest of the pulse (Δt > 50 µs), the emission intensities of all the excited species diminish, following the current behaviour. As O and Nb are synchronized, either O atoms are sputtered from the target, as in the case of Nb, or they are excited as a result of a two-step process, where O2 is first dissociated and then excited by electron impact. In this study it was finally concluded that the high currents observed in the HiPIMS discharges above a partially poisoned target cannot be solely attributed to self-sputtering, but also to gas sputtering.
Time evolution of the light emission from an Ar/O2 HiPIMS discharge with pre-ionization using a Ru target have been studied by Benzeggouta et al [291]. Typical time dependences of characteristic emission lines observed in the plasma with the discharge current shape are reported in figure 35 for low (0.5 Pa) and high (3 Pa) pressure respectively. The time delay between the pulse beginning and the discharge current establishment decreases when increasing the pressure, as discussed in section 3.2.1. Independently of pressure, the transition from metallic to reactive mode occurs for O2 flow rates <4 sccm, for the experimental conditions used (compared to 1–2 sccm in [279]). The general behaviour of the emission lines in a pure Ar HiPIMS is similar to those studied by Vašina et al [292]. In the presence of oxygen, however, apart from the growth of the discharge current, a drastic decrease in the Ru and Ru+ emission intensity is observed in [291], consistent with other observations of the transition from the metallic to reactive mode leading to an essential decrease of the sputtering yield. However, the Ru line appears with a systematic delay with respect to the discharge current. This is due to the finite Ru transport time to the magnetized plasma region where its excitation occurs. A similar effect is observed for the Ru ions. It should be also noted that nearly identical trends were observed in non-reactive HiPIMS discharges, as reported in [218, 219].
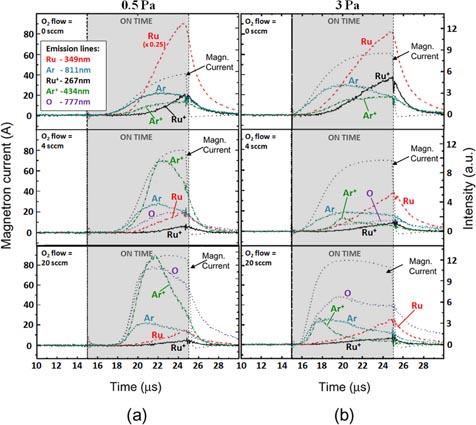
Figure 35. (a) Time evolution of the magnetron current and emission intensities of typical Ar, O and Ru lines in pure Ar (O2 flow rate = 0) and in Ar/O2 gas mixtures for two different O2 flow rates (4 and 20 sccm). The Ar pressure is 0.5 Pa, the Ar flow rate is 15 sccm, tON = 10 µs, f = 250 Hz. The voltage is 1 kV. (b) The same, for 3 Pa of the Ar pressure and 30 sccm of the Ar flow rate. Reproduced with permission from [291]. Copyright 2009 IOP Publishing.
Download figure:
Standard image High-resolution imageAt very high oxygen flow rate (20 sccm), that is, in the oxide mode, and for all pressure values, the emission line intensities of Ar, Ar+, and O increase simultaneously, meaning that all the excitation is by direct electron impact excitation, including the dissociative excitation of O2 resulting in the O 777 nm line. This effect is supported by the results presented in [293], being at the same time different from the observation made for HiPIMS without pre-ionization, as mentioned above [282]. For a power supply with pre-ionization, the plasma is initiated in a short time (0.5–2 µs), and the ion current to the target reaches its maximum very fast (typically in 2 µs, independently of the pressure). It produces a fast and intense sputtering in this case. The transport of the sputtered species towards the substrate and the walls occurs on hydrodynamic time scales (a few milliseconds, which is consistent with [197]), meaning that the sputtered species continue travelling in the gas phase during the plasma off-time. This situation is drastically different in the conventional reactive DCMS process, for which volume and surface processes at the target, substrate, and walls occur simultaneously.
Time-resolved rotational OES analysis also allows one to follow the gas heating dynamics during the HiPIMS on-time, as studied by Britun et al [39]. The time-resolved rotational temperature obtained from the molecular nitrogen ion (
first negative band) is found to increase linearly during the plasma pulse, being roughly independent of the nitrogen content in the gas mixture. Such an increase of Trot is attributed to the bulk gas heating via collisions with the sputtered species, and it occurs for both studied target materials, Ti and W. The obtained temperature data are compared to the LIF results on ArM VDF. It is shown that the structure of the bulk gas (ArM) VDF seems to be more complex, containing both thermal and non-thermal parts, as suggested in [39]. Hence, besides a good agreement between the gas temperatures obtained by OES and LIF, deduced from the FWHMs of the spectral lines assuming Doppler broadening, LIF brings evidence of the co-existence of thermal and non-thermal Ar in the discharge during the on-time.
Owing to the power of the OES technique, PEM control can be realized in R-HiPIMS [294]. The PEM approach is applicable to HiPIMS even though it was initially developed for the DCMS and dc pulsed magnetron cases [295]. As a result, a precise control and stable operation of R-HiPIMS discharge anywhere within the hysteresis loop is possible. Other works have been devoted to studying the HiPIMS plasma by OES, probing mostly the metal and Ar+ species [296].
Time- and space-resolved laser-based analysis. Recently, the detailed space and time kinetics of Ar/O2 reactive HiPIMS has been reported, analysing the absorption intensity of the O metastable states, corresponding to the emission line at 777.194 nm, using the TD-LAS technique [110]. For this experiment, a dc pre-ionization bias generating a low-density plasma was used before applying the high-power pulse [280]. The TD-LAS implementation details can be found elsewhere [40, 109]. This technique allows probing of OM at different locations between the target and the substrate, during both the on- and off-times.
Figure 36 illustrates three representative curves of the time evolution of the relative OM density as evaluated in the interval between 1 and 5 cm from the target surface, in the oxide mode. In this experiment, the time trace at z = 2 cm (z—distance to the target) represents the ionization region and the one at z = 4.5 cm corresponds to the diffusion region, while the one around z = 3.5 cm indicates the transition between the ionization and diffusion regions (vertical dashed lines corresponds to the beginning of the pulse (t0), the maximum discharge current (t1) and the pulse end (t2)).

Figure 36. Time traces of OM absorbance at maximum absorption wavelength at z = 2, 3.5, and 4.5 cm respectively, along with the HiPIMS discharge current (black solid line). tON = 50 µs. The pressure is 4 Pa, the Ar flow rate is 45 sccm, the O2 flow rate is 5 sccm. Reproduced with permission from [110]. Copyright 2013 AIP Publishing.
Download figure:
Standard image High-resolution imageAt the first glance, the direct comparison of the OES and TD-LAS intensities indicates a very complex space and time OM kinetics initiated during the pulse and continuing in the afterglow. In particular, the OM density evolves in phase with the discharge current in the diffusion region (point A'', at t1), while inside the ionization region the density of OM exhibits a maximum (point B) much closer to the end of the pulse (t2). Furthermore, in the ionization region, OM density begins to increase abruptly (t2), and reaches its absolute maximum (point C) during the afterglow (at Δt > t2). At the same time the fast, but time-shifted, rise of OM in the diffusion region indicates the local excitation of the neutral oxygen atoms by the plasma electrons, since their diffusion from the ionization to the diffusion region would take about 30 µs. In the ionization region, the production of OM starts simultaneously with the current rise, but the different slopes indicates a multistep process, which are not observed by OES in figures 35(a) and (b) [291]. This could come from better space resolution of the laser technique compared to OES. To explain the OM signal measured in the afterglow, a significant contribution of the negative ions is suggested by Vitelaru et al [110]. The kinetic scheme of OM formation is briefly described in the following paragraph.
Reactive gas kinetics and temporal dependences via O metastables. Based on the time- and space-resolved measurements in reactive HiPIMS mode, a scenario of the atomic oxygen kinetics is proposed in [110] (see figure 37), with the main reaction paths summarized in table 2. During the plasma on-time, the OM involves volume and target related processes, direct or stepwise, due to electron or heavy species collisions. It should be stressed that the direct sputtering of OM (reaction (8)) seems less probable than the negative ion sputtering (reaction (9)). Even if (9) has to be followed by (10) to produce O, and further OM via other reaction channels, (4) or (6), this is the only way to explain the absence of delay between the current and the OM signal in the diffusion region (see figure 36), since the negative ions travel across the ionization region in less than 1 µs. This is consistent with the kinetic scheme proposed for the afterglow, when the other oxidized surfaces (substrate, chamber walls) start to play a role, releasing (reactions 11 and 12) or capturing (reaction 13) oxygen. However, the plasma electrons cool down very fast (<50 µs) after the plasma pulse (t2), and the electron attachment probability increases significantly (reaction (14)), especially with an effective dissociation during the pulse [217]. This process is much more efficient in the case of three body collisions, generically expressed by reaction 14, but the role of the third body can be played either by another electron (which is very probable immediately after the end of the pulse), or by an oxygen atom in the case of dissociative attachment of molecular oxygen. Hence, OM can be created via an ion–ion recombination process (reaction (15)), especially when the OM density is about two orders of magnitude lower than the O− one [297].

Figure 37. A scenario for OM kinetics in HiPIMS proposed based on the laser absorption measurements (TD-LAS). Red O and O− symbols denote the high-energy particles. Reproduced with permission from [110]. Copyright 2013 AIP Publishing.
Download figure:
Standard image High-resolution imageTable 2. Compilation of the reaction paths contributing to OM kinetics in HiPIMS. Adapted from [110].
| No | Elementary process | Type |
|---|---|---|
| On-time (figure 37, left-hand side) | ||
| 1 | e + O2 → OM + O + e | Direct volume production |
| 2 | e + O2 → O + O + e | Volume production |
| 3 | e + O → OM + e | Two stepwise (2 and 3) |
| 4 | e + OM → O+ + 2e | Direct loss |
| 5 | e + OM → O + e | Direct de-excitation |
| 6 | ArM + O → Ar + OM | Direct excitation transfer |
| 7 | X+ + TiOy (target) → O + Ti with X+ = Ar+, O+,
 , Ti+, etc , Ti+, etc |
Volume/target production |
| Multi-stepwise | ||
| Followed by reaction (3) or (5) | ||
| 8 | X+ + TiOy (target) → OM with X+ = Ar+, O+,
, Ti+, etc |
Target production |
| Direct sputtering | ||
| 9 | X+ + TiOy (target) → O−(energetic) | Target negative ions production |
| 10 | Ar /e + O−(energetic) → Ar /e + O (energetic) + e | Multi-stepwise |
| Followed by reaction (3) or (5) | ||
| Off-time (afterglow) (figure 37, right-hand side) | ||
| 11 | ArM + wall → Ar + OM | Direct surface production |
| 12 | ArM + wall → Ar + O | Surface production |
| Followed by reaction (3) or (5) | Multi-stepwise | |
| 13 | OM + wall → O (wall/volume) | Surface loss |
| 14 | e + O + X → O− + X | Volume e attachment |
| Stepwise | ||
| 15 | O+ + O− → OM + O | Direct volume mutual ion recombination |
Following these considerations, it is possible to explain all the phenomena observed in figures 28 and 36. Negative ions can drastically affect the film properties, as will be discussed in section 3.2.4. Also, if OES indicates a decoupling of the plasma volume emission and the surface processes taking place on the substrate and chamber wall surfaces [291], the laser diagnostics is capable to catch more complex processes, namely where the target plays a major role during the pulse while the other walls as well as the bulk reactions involving heavy species become important in the afterglow.
Ion transport and ion energy distribution. As mentioned above, OES does not provide a possibility to quantify the density of the detected emitting ionized species, which in this case can only be studied qualitatively.
The qualitative approach is used by Hála et al for a Cr target in Ar/N2 mixture [290]. The HiPIMS pulses of 200 µs have been used with a peak power density on the target ranged from 2.2 to 6 kW cm−2. During the discharge ignition (which corresponds to the current rise), the changes in the light emission from the excited gas atoms are reported. It changes from a conical shape, propagating at a speed of 24 km s−1 at 1.3 Pa in pure Ar, to an emissive blob, traveling at a much lower speed of 7.5 km s−1 at the same pressure but in a pure reactive gas mixture (N2 in this case). In the metal-dominated phase (after ∼30 µs in this study), the dense plasma region generated close to the target diffuses towards the substrate. Plasma expansion is found to be constant with time and its speed increases with decreasing gas pressure (see table 3). The speed of the metal plasma wave front is estimated by recording the Cr+ emission intensity resolved in time at different target–probe distances in pure Ar, in pure N2, and in the Ar : N2 mixture (1 : 1).These values are close to the speeds of ion-acoustic waves reported for HiPIMS discharges in Ar at 2.66 Pa using a Ta cathode
 [298] or at 1.3 Pa using a Ti cathode
 [230].
Table 3. Speed
 of metal plasma wave front calculated from the advancing Cr+ line emission wave front for nine different working conditions. Reproduced with permission from [290]. Copyright 2010 AIP Publishing.
| Pressure (Pa) | 0.7 | 1.3 | 2.66 | |
|---|---|---|---|---|
| Ar | 1.3 | 1.1 | 0.7 | |
|
(km s−1) |
Ar : N2 (1 : 1) | 2.0 | 1.4 | 1.1 |
| N2 | 3.5 | 1.9 | 1.7 |
Table 3 illustrates that the Cr ion propagation speed increases with the augmentation of the nitrogen content. It is suggested [290] that the rise of the ion speed with the amount of reactive gas could be due to a higher plasma density, which may facilitate the transport of charged particles, as if an additional plasma is used [230], because the current grows with the introduction of nitrogen and the plasma density also predictably increases. Interestingly, similar velocities associated with the density waves have been reported in pulsed (non-HiPIMS) discharges by Bradley et al [22] and Seo et al [299].
The transport of ions composing the reactive HiPIMS plasma was extensively analysed by MS. The time-resolved energy spectra in an Ar/N2 gas mixture were measured by Greczynski et al [197]. The cathode was operated in the frequency range between 100 and 300 Hz at an average power of 500–4500 W, and tON = 200 µs. Reactive ions (N+ and
), metal ions (Cr+ and Cr2+), and noble gas ions (Ar+, Ar2+) are analysed. As a result of thorough comparison between the non-reactive and reactive HiPIMS regimes the following is concluded.
- Increasing the pulse energy EP in the metallic mode leads to a rapid (linear) increase of the number of Cr2+ ions (by a factor of eight when going from 3 to 30 J), while the intensity of the Cr+ signal increases by a factor of 2.5.
- The composition (and energy) of the ion flux can be significantly altered by varying the pulse energy.
- Low-energy
and energetic N+ ions are present while sputtering in reactive mode. The N+ ions constitute the primary source of nitrogen ions detected for N2/Ar flow ratio > 0.3.
- The initial pulse phase is always dominated by relatively low-energy Ar+
ions. Next, intense emission from energetic metallic species occurs (Cr+ or Cr+ and N+) with a simultaneous decrease in the intensity of Ar+
signal due to the gas rarefaction and Te lowering. Finally, the thermalized Ar ions dominate.
- The properties (composition and energy) of the ion flux incident on the substrate can be controllably adjusted by varying not only EP (peak current) but also the composition of the ion flux.

Similar but time-integrated IEDF analyses have been reported in Ar/N2 R-HiPIMS by Jouan et al [300] and Ehiasarian et al [192]. In these works both IEDFs of metal (Al+ in [300] and Ti+ in [192]) and gas (N+) ions present the same slope spreading up to 70 eV, while the two other IEDFs of Ar+ and
are similar, but much less energetic, up to 20 eV, for a pressure of 0.4 Pa. Less energetic (<20 eV) are also Ti+ and N+ in DCMS and mid-frequency pulsed-dc (triangle shaped voltage). In HiPIMS not only is their energy enhanced, but also an increase in number by a factor of ∼5 for metal ions and ∼4 for reactive nitrogen ions compared to conventional sputtering is found [192]. The time evolution of each type of ion is also reported in [300], where only one time-peak (≈50 µs) for all of four types of ion is found (figure 38). However, a pulse duration of 28 µs is used, which is shorter than the time of flight of the ions from the target to the substrate, and much shorter than the pulse duration used by Greczynski et al (200 µs) [197].
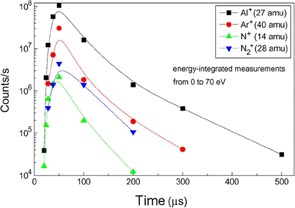
Figure 38. Relative composition of the detected species (Al, Ar, N and N2single ions) in the HiPIMS plasma as a function of time. tON = 28 µs. Reproduced with permission from [300]. Copyright 2010 IEEE Publishing.
Download figure:
Standard image High-resolution imageThe effect of an additional electron cyclotron wave resonance (ECWR) plasma coupled to HiPIMS was recently investigated by MS and retarding field analyser by Stranak et al in Ar/O2 mixture for TiO2 film preparation [301]. The authors followed mainly the positive ions (Ti+, Ti2+, O+, Ar+, Ar2+), averaged in time, but the time-resolved estimation of the overall ion energy distribution function arriving at the substrate was performed using the retarding field analyser. It was concluded that the high energy of the deposited species gained during HiPIMS pulses is most probably responsible for the formation of the rutile phase with the (101) preferred orientation.
The repetition rate effect in Ar/O2 R-HiPIMS with Ti target has been analysed and compared to DCMS by Aiempanakit et al [302]. The average sputtering power was kept constant at 100 W (as in DCMS mode), the pulse duration was 35 µs, and frequency f ranged from 0.5 to 4 kHz. Changing f while keeping the average power constant leads to essential variations of the peak power during the pulse, which increases from 0.1 kW for DCMS to 39 kW for 0.5 kHz, and consequently the discharge voltage increases as well, from about 400 V to about 650 V, respectively. Note that changing the O2 flow rates at a fixed frequency leads to a discharge voltage increase, related to changes of the secondary electron yield of the oxide covered surface [303]. As a result of the study, all the measured Ti+ and O+ IEDFs show the main low-energy peak and a shoulder extending in a high-energy tail (figure 39). Whereas the low-energy peak corresponds to the thermalized ions [221], the second peak (shoulder) represents the energy distribution of the sputtered compound material, as explained above [197, 300]. For both Ti+ and O+ there is a systematic increase of the maximum energy of the tail with decreasing excitation frequency (i.e. with increase of the peak power), which might be related to an additional acceleration that might occur in the plasma [191]. Particle modelling indicates that, increasing the peak power, the plasma potential in the diffusion region facing the substrate increases as well, so this could lead to a different acceleration of positive ions in the substrate sheath [304]. However, if both ion species obey the same scenario, first sputtering from the target as neutrals, following by ionization when crossing the high-density plasma, and finally acceleration in the substrate sheath, it becomes impossible to explain the prominent difference observed for the high-energy tail of Ti+ and O+. The energy tails extend to higher values in the case of O+ as compared to Ti+ (up to 100 eV compared to 60 eV for 39 kW peak power, respectively).

Figure 39. Ti+ (a) and O+ (b) IEDFs measured in DCMS and HiPIMS discharges, working at the same (100 W) average power, but at different pulse frequencies. HiPIMS tON = 35 µs. Reproduced with permission from [302]. Copyright 2011 Elsevier Publishing.
Download figure:
Standard image High-resolution imageA possible explanation of this phenomenon might be an additional pathway for O+ formation involving negative ions (O−), either formed during the sputtering and released from the target as O− and further accelerated, or formed in the pre-sheath (ionization region) and pushed towards the substrate with reduced energy (compared to the discharge voltage). Anyhow, one of the following processes should occur: (i) direct double ionization,
 , (ii) a two-step ionization process,
 and
and
 (the subscript 'energ.' stands for the particles with significantly higher kinetic energy than the thermal ones). The discussion on the negative ions is presented in the following section.
Negative ions in reactive HiPIMS. Negative ions have been identified as the minority species in reactive magnetrons since the early 2000s, but with strong impact on the deposited thin-film properties, as summarized by Ellmer et al for dc and RF discharge excitation [305]. Recently, the negative ion energy distribution function (NI-EDF) has been reported for HiPIMS by Gonzalvo et al [306]. Their results (see figure 40) represented for an Ar/air mixture (lying between 45 : 1 and 45 : 10) cover both metallic and poisoned operation modes at 1 Pa of working pressure. The HiPIMS average power and pulse duration were kept constant (0.6 kW and 200 µs, respectively). The mass spectra of the O− ions looks very similar to the typical ones recorded in conventional reactive DCMS (figure 41). They reveal a significant fraction of energetic negative ions whose energy corresponds to the full discharge voltage, comparable to a beam or shifted Maxwellian distribution. A second fraction of ions, less populated, spreads between 100 eV and about 400 eV (the latter value corresponds to the discharge voltage). It is noticeable that most of the ions are thermalized (linear slope on semi-log graph) in reactive mode and very few in metallic mode (see figure 40).

Figure 40. The IEDFs of O− in a HiPIMS discharge at several flow rates of Ar/air mixture. The mass spectrometer is placed 50 mm away from the target, with the acquisition window (70 µs) centred at Δt = 150 µs. Reproduced with permission from [306], courtesy of Y A Gonzalvo.
Download figure:
Standard image High-resolution image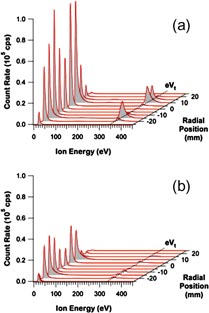
Figure 41. Radially resolved IEDFs of O− in a DCMS discharge using a Zn target. (a) New, flat target; (b) old, eroded target. Ar : O2 (1 : 1) gas mixture. The total pressure is 0.5 Pa. The discharge power is 50 W. The dotted line (eVt) marks the energy corresponding to the acceleration of ions from the target toward the substrate. Reproduced with permission from [305]. Copyright 2012 Cambridge University Press.
Download figure:
Standard image High-resolution imageEllmer et al [305] have shown that the energetic population of negative ions is highly dependent on the target erosion state, as presented in figure 41. A Zn target and an Ar : O2 = 1 : 1 gas mixture for ITO thin-film deposition was used in the magnetron system. Two important conclusions can be drawn from figure 41. First, the negative ion sputtering seems to mainly originate from the racetrack (see the peaks at eVt in figure 41(a)) since they are symmetric with respect to symmetry axis (zero radial position). Outside the racetrack, the intensity recorded by the mass spectrometer tuned on O− mass on charge is undetectable. Second, the negative ion formation is much more efficient for flat new targets than for eroded ones (figure 41(a) versus (b)). Indeed, the peaks at eVt are at the limit of detection, and there is no longer an indication of the racetrack dominance. For both states of the target, the low-energy group of negative ions spreads up to 100 eV (at the racetrack position the tail seems to be more energetic). However, the number of negative ions arriving at the substrate reduces as the target erodes, and so does their energy. The lateral distributions of negative oxygen ions are both measured and simulated by Mahieu et al [307], supporting the results from [305]. It should be noted, however, that the low-energy ion group (<50 eV) is not observed in the experiment with an Al target in Ar/O2 mixture by Andersson et al [308]. They measured an energetic population around 100 eV 17 cm away from the racetrack, and the number of O− ions increases with the partial O2 pressure in the mixture (see figure 42).
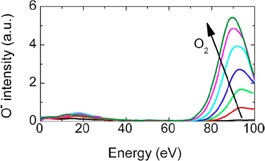
Figure 42. Energy distributions of O− for seven O2 partial pressures ranging from 13 to 227 µPa, with the arrow indicating the increase of O2 pressure. The total pressure is 0.33 Pa. Reproduced with permission from [308]. Copyright 2006 AIP Publishing.
Download figure:
Standard image High-resolution imageLet us underline that all the previously presented results are qualitative, since a non-calibrated mass spectrometer was involved. Absolute measurements of the number of negative ions in a magnetron are made by You et al [297]. They used Langmuir probe-assisted laser photo-detachment, and followed the temporal evolution of the O− density in the plasma bulk of a unipolar pulsed-dc magnetron. The source was operated in reactive mode, at a fixed nominal on-time power of 100 W, sputtering Ti in Ar/O2 mixtures at 1.3 Pa, but over a variation of duty cycles from 5 to 50% and O2 partial pressures of 10 and 50% of the total pressure. In the plasma on-time, for all duty cycles the negative ion density (O−) rises marginally, reaching values typically less than 2 × 109 cm−3. However, immediately after the transition from plasma on- to off-time, the negative ion density falls by about 20–30% as fast O− species created at the cathode exit the system. You et al concluded that in the on-time the negative ions represent about 10% of the electron density into the plasma, while in the off-time the negative ion density increases sharply as a function of time, at rates which increase on reducing the duty cycles. Hence, in the afterglow, the plasma is highly electronegative and the negative ions dominate over free electrons; the negative ion to electron ratio ranges from 4 to 14 when the O2 partial pressure changes from 10 to 50%, respectively. For longer off-times, the negative ion density begins to fall after 500 and 200 µs (for 10 and 50% of O2 content), with characteristic decay times of several hundred microseconds, shortening with increased O2 content. This is consistent with the kinetic scheme proposed for the R-HiPIMS (see table 2 and figure 37) [110].
To conclude this section, we can follow the statement of Amin et al [309] on the clear evidence that energetic ion bombardment plays a dominant role in thin-film structure formation in reactive sputtering. The detailed knowledge of the ion species assisting the film growth further contributes to a comprehensive understanding of the correlation between the film structure and the process parameters. The next section presents the plasma and gas phase particle characteristics in the substrate vicinity, which are directly related to the film growth.
3.2.4. Substrate vicinity phenomena.
Substrate collected current and floating potential. Most of the ions reaching the substrate are positive, but the most energetic ions are the negative ones (see above). Note that in terms of the total energy flux both particle density and energy (velocity) are critical.
Let us give here an estimation of the particle flux of negative ions reaching the substrate (Γ−) with respect to the positive ion flux (Γ+). Even for the most electronegative magnetron plasmas, the energy ratio between the energetic negative ions (characterized by energy E−) and positive ions (E+) is about 10, leading to a velocity ratio (denoted as ε) proportional to the square root of the energy ratio (∼3), in favor of negative ions. The most energetic negative ions, which recover the entire voltage drop over the discharge, represent only a fraction (denoted here as f) of the total number of negative ions (see the respective area of energetic ions at ∼450 eV, figure 40) with respect to the low-energy ones (typically f < 0.5, or much less). It is important to underline that only the energetic negative ions can escape the plasma region, since the plasma potential is positive: Vp > 0 (see figure 43), whereas the low-energy negative ions are efficiently trapped. Therefore, the negative ion flux reaching the substrate (Γ−) is defined only by the fraction f of their total amount: Γ− = fn−v−; with n_ and v_ being the density and velocity of negative ions, respectively. Introducing α as the electronegativity coefficient, defined as the density ratio of negative ions over the free electrons (n− = αne), the plasma neutrality condition can be written as follows:

(where ne and n+ stand for the electron and positive ion densities, respectively). Hence, the energetic negative ion flux onto the substrate Γ− is proportional to the positive ion flux n+ (M denotes ion mass):
An estimation of the term
 gives a value smaller than unity for highly electronegative plasmas (e.g. f ∼ 0.5, ε ∼ 3, α ∼ 0.5), and much smaller than unity otherwise (e.g. f ∼ 0.1, ε ∼ 3, α ∼ 0.01). Consequently, the ion flux to the substrate is mainly defined by the positive ions, even in compound mode, but if a few negative ions are released from the target this effect can drastically change the film properties, in spite of their small number in the discharge [305, 309].

Figure 43. Plasma and floating potentials along with the ion saturation current measured during and after the plasma on-time. The target voltage is also shown by the bold line. Reproduced with permission from [296]. Copyright 2009 IOP Publishing.
Download figure:
Standard image High-resolution imageLet us discuss the total current collected at the substrate, given by positive ions. The corresponding Langmuir probe measurements were made by Alami et al [296] 70 mm away from a Cr target, in Ar/N2 gas mixtures. High-power 50 µs unipolar pulses of a few hundred W cm−2 were used, resulting in peak target currents from 6 to 180 A. The plasma (Vp) and floating (Vf) potential waveforms in HiPIMS are shown in figure 43. Vf ≈ −18 V; it is relatively flat during the pulse current rise-up phase, as well as during the plasma on-time, but it decreases to almost zero in the off-time. The plasma potential, on the other hand, is found close to the substrate to be nearly constant and slightly positive (1–2 V), as expected. Note that neither the plasma nor floating potential could be measured in the first 10 µs of the pulse, since the plasma is unstable at the early stages, which is typical for R-HiPIMS, especially when the pre-ionization is absent. Based on these measurements, the time-dependent mean electron energy was calculated, and it is found to decrease from ∼4 eV at 20 µs after the pulse initiation to ∼2 eV at the end of the plasma on-time, and to 0.5 eV a few tens of microseconds after the pulse is off. This behaviour indicates a thermalization of the plasma species as they arrive in the substrate's vicinity. The peak ion flux estimated from the ion saturation current density measurements (Isatd in figure 43) is two to three orders of magnitude higher than that in DCMS. However, because of the large distance between the target and the substrate (70 mm), a significant number of ions reach the substrate tens of microseconds after the pulse is off.
The case of the Ar/N2 R-HiPIMS discharge with pre-ionization studied in [300] was discussed earlier. Let us focus here on the floating potential waveforms found in R-HiPIMS. In figure 44, Vf is compared to the typical current and voltage cathode waveforms. The discharge voltage does not drop from 0 to −1000 V at Δt = 0 because of the pre-ionization voltage (−300 V) established before the plasma on-time [280]. The discharge current rises at Δt = 7 µs, which is typically twice as fast as in the case of the HiPIMS power supply without pre-ionization (figure 43). The substrate floating potential Vf (solid red line in figure 44(a)) decreases to −120 V, in advance of phase with respect to the discharge current. When the discharge current rises by 80% of Ipeak, Vf starts to decrease, reaching −70 V. Afterwards, Vf sharply changes, and stabilizes at ∼22 V, while the discharge current continues to increase, reaches its maximum and slightly decreases. Note that the considerable reduction of the unstable transitory phase at the beginning of the pulse (∼2 µs, current spikes, blue line in figure 44) in the case of pre-ionization HiPIMS has to be compared with the 20 µs interval observed with the other type of power supply (see figure 43 and [296]). Another difference concerns the afterglow evolution of the Vf, that slightly decays over ∼50 µs (figure 43), while it goes to zero together with the pulse voltage and current in the case of pre-ionization HiPIMS (figure 44). This behaviour of Vf is certainly related to the current waveform in the afterglow.

Figure 44. (a) Waveforms of the cathode voltage and current in HiPIMS taken at 0.4 Pa pressure. The floating potential recorded on the substrate at 30 mm is also shown. (b) Floating potential of the substrate in pure Ar and in the Ar : N2 0.7 : 0.3 mixture. Reproduced with permission from [300]. Copyright 2010 IEEE Publishing.
Download figure:
Standard image High-resolution imageTo investigate the effect of the reactive gas on the Vf curve shape, the floating potential was recorded for a HiPIMS discharge operated in pure Ar and compared to the case with 30% N2 in the gas mixture (figure 44(b)). The first peak minimum is associated with the primary electrons generated at the beginning of the discharge. Indeed, mainly electrons are reaching the substrate, giving a transitory very negative floating potential. The stronger Vf decrease in the reactive case (−120 V compared to −100 V in pure Ar) can be explained by the secondary electron emission yield variation with the state of the target. AlN target releases 0.3 electron/ion while the pure Al target only 0.08 electron/ion [310], and so the compound formation on the target surface may lead to a more intense peak. An interesting experiment was performed by Jouan et al [300]. They integrated the collected current over a time interval much longer than the pulse duration (including the off-time between two successive pulses). In this case, for both the integrated and time-resolved measurements, the floating potential is mainly around zero, as observed in figure 43 after 150 µs. Note that this average value gives the mean effect of ions assisting the film growth.
The time behaviour of the current collected on the substrate was also studied by Benzeggouta et al [279] for short pulses (10 µs) with pre-ionization and by Čada et al [169] for long pulses (100 µs), both in Ar/O2 gas mixture, but using Ru and Ti targets, respectively. It is found that by reducing the on-time the current collected on the substrate has a similar wave shape to the floating potential, up to its shoulder (comparing figures 45 and 44). Figure 45 represents the current collected on the substrate for different bias voltages (Vs) applied to the substrate holder. As found by Jouan et al [300], they conclude that the floating potential is about −20 V, since for the bias the recorded current changes its sign after about 5 µs (figure 45). The fact that the substrate holder can be considered as a plane probe can be used to get some insight into the EEDF in the plasma region adjacent to the substrate. Hence, they concluded that for Vs > −25 V the electron contribution to the substrate current is not completely suppressed, meaning that energetic electrons are still present in the plasma surrounding the substrate. Therefore, even in front of the substrate, the electrons are energetic enough to effectively ionize Ar, O and also the sputtered species. Similar results were obtained by Richter in a reactive pulsed magnetron (non-HiPIMS) operated at low power [153].
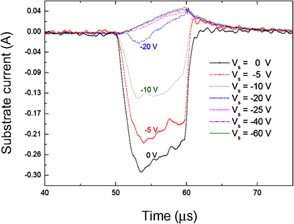
Figure 45. Time variations of the net current collected on the substrate holder for various bias voltages applied to the substrate (Vs): f = 1 kHz, tON = 10 µs, target voltage = 1 kV, O2 flow rate = 4 sccm. The pressure is 5 Pa. Reproduced with permission from [279]. Copyright 2009 IOP Publishing.
Download figure:
Standard image High-resolution imageSimilar measurements were made by Čada et al [169] in an Ar/O2 mixture while biasing the substrate. Their results clearly demonstrate higher ion flux with increasing mean discharge current (not shown). On the other hand, the ion flux decreases with increasing working gas pressure. For lower pressure, the ion flux increases practically linearly during the active plasma pulse. The substrate current density exhibits two peaks during the plasma pulse at low pressure (see figure 46). The first one occurs around 20 µs and second at the end of the pulse. Increasing the pressure, the first peak disappeared. The authors suggested the presence of ions of different origin in the vicinity of the negatively biased substrate, which is in agreement with [197]. The working gas ions would reach the substrate first, being followed by the sputtered particle ions arriving at the substrate later and substantially increasing the ion flux. Furthermore, the ion flux decreases during the off-time for the first 100 µs during the near afterglow, but this decrease continues with a very minor slope, reaching an asymptotic value between 1000 and 2000 µs (figure 46). It is concluded that at the beginning of the next plasma pulse there are still some seed electrons available to facilitate the ignition of the next pulse. A similar substrate current time evolution is reported by Magnus et al [287]. Combining the conclusions related to both the mean ion energy the over long times and the ion flux collected on the substrate, it appears that only a few ions with very low energy survive between the long HiPIMS pulses. This is, however, seems not to be the case for the shorter pulses, where the described effect is normally achieved by pre-ionization.
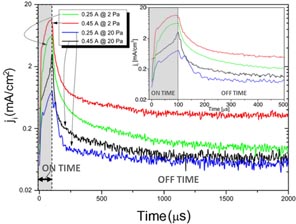
Figure 46. Temporal evolution of the ion density current on a negatively biased substrate in a HiPIMS discharge. tON = 100 µs. Inset: the time evolution during the first 500 µs. Reproduced with permission from [169]. Copyright 2011 Elsevier Publishing.
Download figure:
Standard image High-resolution imageEnergy balance and particle deposition on the substrate. Among the major issues of reactive sputtering, excepting the well-known target poisoning effect, the deposition rate should be mentioned, first of all because it is directly related to the practical use of the HiPIMS technology. Most of the works reported a rapid decrease of RD, generally associated with the increase in the secondary electron yield. Emmerlich et al have shown that the apparently low RD can be understood based on the non-linear energy dependence of the sputtering yields [311], while Brenning et al have stated that finding the way to reduce the back-attraction of ionized sputtered material will certainly increase the deposition rates. Even if these arguments were found for the non-reactive HiPIMS, they still hold for the reactive case. For instance, Greczynski et al reported a reduction of RD in reactive HiPIMS up to a factor of three for growing CrNx films, compared to pulsed-DCMS at the same average power [312].
However, particularly in R-HiPIMS, it is possible to overcome this limitation, and RD values higher than in DCMS have been reported, together with the stabilization of the deposition process (reduced hysteresis), by Sarakinos et al [268, 272]. They used two HiPIMS configurations with tON = 50 µs and tOFF = 450 and 1950 µs [272]. The change in the pulse configuration and the O2 flow are found to affect RD drastically. Figure 47 shows that RD increases with the discharge peak current during the on-time, up to a value of 14 A, and decreases for higher currents. Note that in all cases RD is higher, by up to 40%, than the corresponding values achieved in DCMS (horizontal dashed line in figure 47). The inset in figure 47 shows the RD values of the TiOx films that were deposited under target current IT = 0.3 A in the 50/950 µs case as a function of the O2 flow. RD exhibited a smooth decrease upon increasing the O2 flow from 0.3 nm s−1 in pure Ar down to 0.05 nm s−1at 3 sccm of the O2 flow. The explanation of this phenomenon is given based on the study of ZrO deposition [268]. Before, the same authors had advanced the hypothesis that both the change in surface composition of the target and the increased sputtering yield resulted in a higher RD for the HiPIMS grown films [272]. From the results reported in figure 48 they clearly demonstrate that the normalized RD (per unit of power) is dominated by the DCMS in metallic mode (solid symbols), but it drastically drops (by a factor of three) in reactive mode, while RD in HiPIMS decreases much more smoothly (open squares compared to open circles) on passing from metallic to reactive mode. Hence, the higher RD values in reactive mode should be understood as a reduction of the sputtering efficiency in DCMS due to the compound formation onto the target surface. This compound contamination is highly reduced in HiPIMS mode, at least in the racetrack region, and so the discharge continues to accurately operate, although it corresponds in this case to the unstable region of DCMS. Moreover, the higher power during the pulse helps the reactive gas dissociation and the stoichiometric films can be obtained for lower reactive gas concentration in the mixture. The same effect of enhanced RD is reported by Guillaumot et al [313] in an Ar/N2 R-HiPIMS discharge. Another effect that impacts RD is the very strong gas rarefaction, especially for long pulses [314]. Stronger rarefaction reduces the flux of reactive gas to the target, hence less target poisoning is found.

Figure 47. Deposition rate of TiOx films deposited by HiPIMS as a function of the target peak current and the duty cycle. The horizontal dashed line stands for the RD of DCMS. Inset: RD as a function of O2 flow for the tON/tOFF = 50/950 µs HiPIMS case. Reproduced with permission from [272]. Copyright 2007 IOP Publishing.
Download figure:
Standard image High-resolution image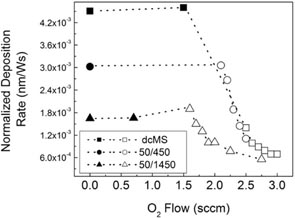
Figure 48. Deposition rate normalized to the average power applied to the target for films deposited by DCMS (squares) and tON/tOFF = 50/450 µs (circles) and 50/1450 µs (triangles) HiPIMS cases, as a function of the O2 flow. The closed and open symbols indicate the non-transparent and transparent films respectively. Reproduced with permission from [268]. Copyright 2008 Elsevier Publishing.
Download figure:
Standard image High-resolution imageThe RD values versus the angular position of the magnets with respect to the substrate measured by Leroy et al [261] are reported in figure 49(a). The normalized ratios of RD with respect to the DCMS case are shown in the legend in figure 49(b). The RD drop found while increasing the rotation angle of the substrate in the dc case is in good agreement with SIMTRA simulations. Compared with DCMS, RD drops significantly (twice) when using HiPIMS with tON = 5 µs and f = 5700 Hz. For longer pulses, RD seems to stabilize, decreasing to a smaller extent, similar to the non-reactive mode results [230]. The situation is very different in the reactive mode, where RDvalues in DCMS and 5 µs HiPIMS cases are very close each other. The RD values are drastically reduced as compared to the non-reactive dc case, corresponding to about 6% of the latter values (figure 49, open squares and crosses). Beyond this reduction of RD, the most important conclusion from this result is the same relative angular dependency of RD, either in HiPIMS or in DCMS, in both the reactive and the non-reactive modes. There is a certain disagreement with the data reported in [268, 272], which may be explained by the shorter pulses used in [261].
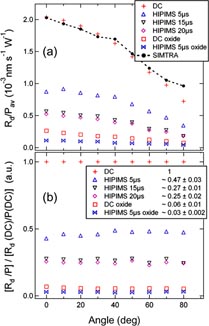
Figure 49. (a) RD measured by a quartz microbalance, as a function of angle around the rotating cylindrical magnetron, for different sputtering modes. (b) The deposition rates are given relative to the RD in the dc mode, as a function of the angle around the rotating cylindrical magnetron. Reproduced with permission from [261]. Copyright 2011 IOP Publishing.
Download figure:
Standard image High-resolution imageAnother significant effect in R-HiPIMS is the film bombardment with ions, and especially reactive gas ions, in the off-time (see figures 46 and 38), that can play an essential role in reaching the right stoichiometry or in acting at the interface [315]. However, the same phenomenon can have a negative effect in the case of ultrapure metal deposition, where the residual gas, generally reactive, can lead to negative ion formation (see earlier) followed by their incorporation into a film. The effect of negative ions on RD by sputtering and densification of the growing films is usually negligible, whereas the other effects on the film structuring are noticeable, especially when the substrate is not moved relative to the target [314, 316]. The energetic balance of deposited species on the substrate is a critical parameter for the film growth, since it directly influences the growth mechanism [16] and can even damage temperature-sensitive substrates. Sarakinos et al claimed that the enhancement of the film properties can be achieved at moderate peak target current values, where the RD values are significantly higher than the corresponding DCMS rates [272]. The total energy flux seems to be a valuable parameter, and it was investigated by Leroy et al for the rotating cylindrical magnetron for different deposition modes [261].
Figure 50(a) shows the angular dependence of the total energy flux for the different operating modes. The values for the arriving energy flux (Eflux) have been normalized to the average power (Pav) of the deposition mode used. Globally, the angular dependence is similar for all operating modes, with the highest arriving total energy flux in the DCMS case. All sputter modes exhibit a maximum energy flux around 40°, resulting in a heart shape of the angular distribution in the non-reactive mode, whereas it is more cosine-like in the reactive one. Figure 50(b) shows the HiPIMS energy flux normalized with respect to the one measured in the DCMS, plotted as a function of the pulse duration [261]. These data are compared to the results of Lundin et al [208] and West et al [259]. In spite of the different working conditions utilized in these studies (such as power supply, frequency, target configuration, and magnetic field configuration), there is a good coherence between these works. A decrease of the total energy flux is found in all the HiPIMS modes, as compared to DCMS, even though the differences found are about 20% for the short pulses.
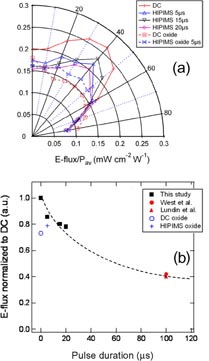
Figure 50. (a) Polar plot of the total arriving energy flux for different sputtering modes, as a function of angle of rotation around the rotating cylindrical magnetron, normalized to the average sputtering power. (b) Ratio of the total energy flux for HiPIMS to DCMS mode, plotted as a function of tON. The data are compared with those of West [259] and Lundin [208]. Reproduced with permission from [261]. Copyright 2011 IOP Publishing.
Download figure:
Standard image High-resolution image
The observed dependence on the pulse duration could originate from the different numbers of energetic particles (Ar fast neutrals and ions, sputtered metal neutrals and ions, electrons, etc) depositing their energy at the thermal probe. Indeed, it has been shown that both the ionization and RD depend on the pulse duration (at constant discharge voltage) [230]. The larger the pulse duration, the larger the ionization rate but the lower RD. As a result, it is concluded in [261] that the valuable comparison parameter is the energy corresponding to an average arriving particle rate, i.e. the energy flux divided by the total number of incoming adparticles. Hence, it was found that the lowest values for the energy flux per adparticle are obtained in DCMS (<3 × 10⁻¹⁴ mW s−1), and the HiPIMS operation increases this energy by a factor of two for 5 µs pulse width, and by a factor of four for pulses longer than 15 µs, in pure Ar. The higher values have been obtained for the reactive mode, being typically twice as high in HiPIMS as in DCMS. This prominent increase in the overall energy per adparticle when the discharge switches in the reactive mode is attributed to the significant number of energetic negative ions such as O− reaching the probe surface (see figure 40). Overall, the energy flux per adparticle is always found to be higher in HiPIMS than in DCMS for the same operation regime, either metallic or reactive.
4. Concluding remarks and perspectives
High-power impulse magnetron discharges, due to their intrinsic dynamic behaviour, require in-depth characterization by the correspondingly adapted plasma diagnostic methods. As follows from the diagnostic data reviewed in this article, the time-averaged analysis only allows for a partial, sometimes superficial, understanding of the physics of HiPIMS discharges, while the time-resolved diagnostic capabilities ensure a significantly better level of understanding. Plasma diagnostic measurements generally allow us to elucidate rather complicated physical phenomena which define the distinctive features of both non-reactive and reactive HiPIMS discharges. However, in addition to the the existing plasma diagnostic approaches, definite methods of analysis, methods of data acquisition, detection schemes, etc still may need to be improved in order to increase the precision of the discharge characterization, first of all in terms of hardly detectable species (e.g. O in the ground and metastable states) and also in terms of signal-to-noise ratio, time and space resolution, particle selectivity, sensitivity,etc.
The global picture of a high-power pulsed magnetron discharge obtained based on several preceding reviews, as well as on the experimental discharge diagnostics data reviewed in this article, points to the fact that this discharge is not just an upgraded version of the conventional dc or pulsed-dc discharge achieved by increasing and redistributing the power applied to the sputtering cathode. Although the implementation of the HiPIMS discharge in a deposition chamber may be relatively straightforward, implying 'only' replacement of a power supply, the whole plasma features together with the plasma–surface interaction processes are essentially different. It should be noted that the physics of the HiPIMS discharge allows us to study the new dynamic sputtering phenomena, which have been partially hidden so far, primarily as a result of the low instantaneous power used in the dc magnetron discharges, which is apparently not enough to observe the effects inherent in HiPIMS. The crucial role of the time-resolved, sometimes rather sophisticated, plasma diagnostic methods in the systematic investigations of these phenomena is evident. It is likely that some of the phenomena observed in HiPIMS plasmas could also improve our understanding of the conventional dc magnetron sputtering processes.
Owing to the well-established discharge characterization approaches, particularly the optical methods, it is now also possible to devise more carefully the thin-film synthesis strategies in order to take advantage of the useful HiPIMS discharge characteristics. For example, one could think of optimized substrate bias strategies with a bias pulse pattern synchronized with the metal ion transport, or of a similar optimization in terms of the HiPIMS pulse duration. The role of the optical discharge diagnostic techniques able to analyse the ground state density of the plasma species (such as LIF, ROAS, calibrated OES, etc), as well as the role of the time-resolved MS analysis supporting such optimizations, should be especially acknowledged in this case. In addition, various challenging questions defining the future diagnostics research directions in this domain may appear. Some of them are the following. How will the instabilities observed over the racetrack area in a non-reactive HiPIMS discharge behave in reactive HiPIMS regimes under increasing chemical complexity of the discharge? How valuable they are in terms of distribution of the ground state densities of the sputtered species? Do the superthermal electrons detected by time-resolved probe measurements influence the film properties, and to what extent? Does the intense IR flux emitted by the hot target play a role in the film growth mechanism? As we can see, there is still a lot of room for further plasma diagnostic research work in the high-power pulsed sputtering field.
Talking about reactive HiPIMS discharges, we should note that the plasma characterization in these discharges is still at an early stage. Nevertheless, it can already provide much better comprehension of the involved phenomena and open the way towards process control and optimization, very useful for thin-film deposition applications. In this regard, a synergistic approach involving the diagnostic data and simulation codes would be of great interest.
Among the major issues to clarify in reactive HiPIMS is the hysteresis phenomenon. The magnetron operation in the transition region between metal and compound modes is much more stable in HiPIMS compared to DCMS, and the hysteresis is at least shifted, if not totally suppressed, under certain conditions. Thus, the right stoichiometry of the compounds can be generally achieved, which is primarily due to the higher dissociation rate of the reactive gas in HiPIMS,as compared to DCMS. Nevertheless, the example of deep characterization of the reactive oxygen species reviewed in this work has shown that the plasma reactivity is very different during the high-power pulse (on-time) and in the afterglow (off-time). During the pulse, it is dominated by the volume- (electron-) driven processes and effective sputtering from the target, including compound sputtering. In contrast, during the afterglow the diffusion towards the walls/substrate dominates and the oxygen consumption on the surfaces is continuing, feeding the growing film with high-reactivity species in the absence of ion bombardment and target material.
One could also wonder what the dynamics and the absolute oxygen (nitrogen) ground state densities are in reactive HiPIMS. What is the role of these reactive atoms in the film growth process? What if, according to the affinity of the sputtered metal atoms, the heat of formation of the metal–reactive atom bond is significant? How will such an 'excess' energy input (with respect to the other PVD processes) be chanellized during film formation?
On the other hand, the ion characterization studies in R-HiPIMS have demonstrated that the compound formed onto the target, mainly during the afterglow phase, led to a simultaneous sputtering of metal and atomic reactive species from the target, that their energy distribution has a broader tail, and that they survive further in the afterglow compared to plasma ion species. This enhances the reactive HiPIMS operation at low pressures. As mentioned above, special attention should be devoted to the negative ions in the HiPIMS discharges, as well as to their role in thin-film growth mechanisms, when oxygen is used as a reactive gas.
Concerning the overall energy balance of the deposited particles, HiPIMS seems to be very similar to DCMS, which at the first glance could be explained by the same average power of the process. At the same time, the amount of energy delivered per deposited atom is noticeably higher in the HiPIMS case, as the deposition rate is lowered compared to the conventional DCMS process. Along with this fact, rather complicated evolution of the floating potential recorded at the substrate proves that the time dependence of the energy flux is very specific in the reactive HiPIMS case. Further plasma diagnostic research, possibly coupled with the corresponding plasma modelling, would be highly desirable in order to find the right matching between the pieces of a sparse plasma–surface interaction puzzle related to the high-power pulsed sputtering discharges running in both non-reactive and reactive regimes.
Acknowledgments
This work is supported by the Belgian Government through the 'Pôle d'Attraction Interuniversitaire' (PAI, P7/34, 'Plasma–surface interaction'). NB is a post-doctoral researcher, and SK is a research associate of the Fonds National de la Recherche Scientifique (FNRS), Belgium. NB appreciates the contribution of Dr M Palmucci during conduction of the optical measurements, and would also like to thank Dr T Kubart for valuable comments. Part of this work was done in the frame of COST Action 'HIPP' MP0804—European action. TM warmly acknowledges C Vitelaru, L dePoucques, J Bretagne, D Lundin and N Brenning for valuable discussions on HiPIMS.