Abstract
The special mechanical properties of nanoparticles allow for novel applications in many fields, e.g., surface engineering, tribology and nanomanufacturing/nanofabrication. In this review, the basic physics of the relevant interfacial forces to nanoparticles and the main measuring techniques are briefly introduced first. Then, the theories and important results of the mechanical properties between nanoparticles or the nanoparticles acting on a surface, e.g., hardness, elastic modulus, adhesion and friction, as well as movement laws are surveyed. Afterwards, several of the main applications of nanoparticles as a result of their special mechanical properties, including lubricant additives, nanoparticles in nanomanufacturing and nanoparticle reinforced composite coating, are introduced. A brief summary and the future outlook are also given in the final part.
Export citation and abstract BibTeX RIS

Content from this work may be used under the terms of the Creative Commons Attribution 3.0 licence. Any further distribution of this work must maintain attribution to the author(s) and the title of the work, journal citation and DOI.
This article was made open access on 19 November 2014.
1. Introduction
Nanoparticles, microscopic objects with at least one dimension less than 100 nm [1], have attracted intensive scientific attention. Distinctive size-dependent properties of nanoparticles often exist, which are mainly due to their relatively large surface area [2]. Moreover, when the size of a particle approaches nanoscale with the characteristic length scale close to or smaller than the de Broglie wavelength of the charge carrier (electrons and holes) or the wavelength of light, the periodic boundary conditions of the crystalline particle are destroyed, or the atomic density on the amorphous particle surface is changed [3]. Due to these, a lot of the physical properties of nanoparticles are quite different from bulk materials, yielding a wide variety of new applications. For example, nanoparticles encapsulated or adsorbed in matrix materials have been used as carriers for delivering drug molecules [1, 4, 5]. Stability, self-assembly behaviour and mutual interactions of nanoparticles at fluid interfaces are very relevant to many colloid applications [6]. Special optical properties due to the excitation of surface plasmons in metallic nanoparticles can be used in biomedicine, energy and environment protection technologies [7]. Magnetic nanoparticles could become superparamagnetic and respond to external magnetic fields very fast with almost zero remanence [8]; these properties lay bases for applications such as biomedical imaging and information storage technology [9, 10]. Some of the basic functions of nanoparticles, e.g., a catalysis of electrochemical reactions and the enhancement of electron transfer, make them very useful in designing novel electrochemical sensing systems [11].
As such, research topics on the mechanical properties of nanoparticles have become increasingly hot in recent years; the number of relevant publications has increased dramatically, as shown in figure 1. Nanoparticles show different mechanical properties relative to microparticles and bulk materials, providing more effective options for the surface modification of many devices in the mechanical strength, or to improve the quality of nanomanufacturing/nanofabrication, etc. To be more specific, on the one hand, the mechanical effects of nanoparticles can affect the tribological properties of lubricants with nanoparticles [12] as well as reinforce composite coatings [13]. In a lubricated contact, the comparison in the hardness between nanoparticles and the contacting surface determines whether particles are deformed or indented into the surface when the contact pressure is sufficiently large [14]. This information could reveal how the particles behave in the contact. On the other hand, nanoparticles are usually used as abrasives in the nanopolish of ultra-smooth surfaces by chemical mechanical polishing (CMP), which is the most effective planarization tool in the manufacture of an integrated circuit (IC), till now. Good controls over the mechanical properties of particles and their interactions with the polished surface etc are important for improving the surface quality and enhancing material removal [15, 16]. Successful applications in these fields usually need a deep understanding of the basics of the nanoparticles' mechanical properties, such as hardness and elastic modulus, interfacial adhesion and friction, movement law, as well as their size-dependent effects. In order to acquire more of this information, different testing methods have been developed, e.g., nanoindentation with atomic force microscopy (AFM) [17, 18], in situ compression by a force probing holder based on the observation with transmission electron microscopy (TEM) [19, 20]. However, the obtained results are still inadequate and some are controversial. For instance, there is still no definite conclusion as to whether the elastic modulus of nanoparticles measured with AFM is affected by the particle size and the indentation depth [21–24]. Furthermore, the contact mechanics, especially the frictional and mechanical behaviours related to nanoparticles, have not been fully understood. The applicability of classic theories, e.g., the Hertzian theory, for describing the contact behaviours in the case of particle sizes down to the nanoscale, is still in discussion [23, 24].
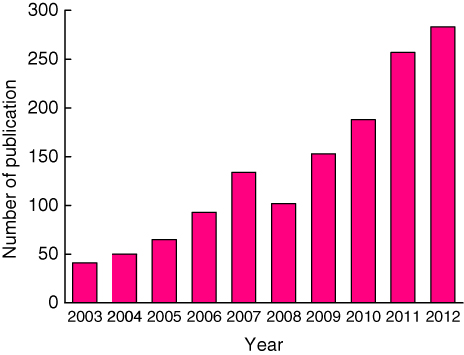
Figure 1. The number of publications related with the topic on the mechanical properties of nanoparticles in the past decade.
Download figure:
Standard image High-resolution imageThis work aims at giving a review of the important recent advances in the mechanical properties of nanoparticles, from the basics to their application. The review is organized into four sections: section 1 discusses the mechanical models and theories between nanoparticles or the nanoparticles acting on a surface. In this part, the basic concepts of the relevant interfacial forces and theories of nanoparticles, e.g., the van der Waals force, electrostatic force, capillary force, DLVO theory, contact and adhesion theories etc are also introduced. Section 2 briefly describes some of the typical measurement techniques currently used for studying the mechanical properties of nanoparticles. Section 3 summarizes the important results on some of the mechanical properties of nanoparticles, such as hardness, elastic modulus, adhesion and friction, as well as movement. Section 4 introduces the main applications of nanoparticles that result from their special mechanical properties; these applications include a lubricant with nanoparticles as additives, nanoparticles in nanomanufacturing and nanoparticle reinforced composite coating. The general framework of this review is schematically given in figure 2.
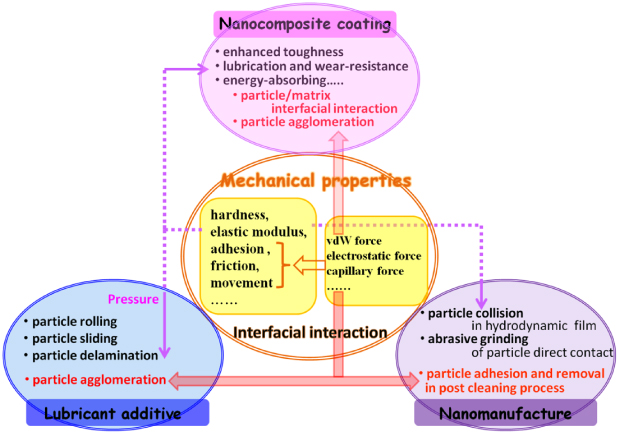
Figure 2. Schematic diagram of the framework of this review.
Download figure:
Standard image High-resolution image2. Interaction forces and basic theories relevant to the mechanical properties of nanoparticles
'As we go down in size, there are a number of interesting problems that arise.'—Feynman [25]. The first problem is the diverse interaction forces between the nanoparticles themselves, or between them and the surface.
2.1. Van der Waals (vdW) forces
VdW forces are the weak interaction between all molecules and particles, which play important roles in the particles' mechanical properties. This kind of force includes three parts: one is the orientation force (the Keesom force) [26], resulting from the interaction between the permanent dipole moment of polar molecules. The second is the induction force (the Debye force) [27], which comes from the interaction between the permanent dipole moment of the polar molecule and the induced dipole moment. The third is the dispersion force (the London force) [28], which exists in a wide variety of polar and nonpolar molecules, coming from the induced instantaneous dipole polarization. VdW energies are usually from several to dozens of thousands of Joules per mole, one or two orders of magnitude smaller than the chemical bond energy. The vdW forces are long-range forces and can be effective in a large range of distances, varying from long distances greater than 10 nm down to atomic scale distance (about 0.2 nm) [29]. The methods for calculating the vdW interaction forces or energies between small molecules or large macroscopic bodies have been well established [29]. Several of the common vdW forces and energies are given in table 1. The vdW forces of objects with any shape can be transformed with the Derjaguin approximation to those between two planes per unit area [30]. Based on the quantum electrodynamics theory, Lifshitz deduced the expression for calculating Hamaker constants, which can be used to solve problems with media involved [32]. Typically, the Hamaker constants for interactions in a medium are an order of magnitude lower than those in a vacuum [33]. The vdW force is always attractive between identical materials, but it may be repulsive between dissimilar materials in a third medium (usually liquid) [29].
Table 1. Several of the common vdW energies and forces.
| Types | vdW energies | vdW forces |
|---|---|---|
| Molecular-plane |
 |
 |
| Sphere–sphere |
 |
 |
| Sphere–plane |
 |
 |
| Plane–plane |
 |
 |
Note: Cvdw is a coefficient related to the atomic pair potential, R is the sphere radius, R1 and R2 are the radii of two spheres, respectively, D is the distance between two surfaces, A = π2CvdWρ1ρ2 is the Hamaker constant [31] and ρ is the atomic density.
2.2. Electrostatic force and electrical double layer (EDL) force
For particles suspended in water or any liquid with a high dielectric constant, they are usually charged and can be prevented from coalescing due to the repulsive electrostatic force. The charging of a surface in a liquid has three main sources [29]: (1) the ionization or dissociation of surface groups; (2) the adsorption or binding of ions from the solution onto a previously uncharged surface; (3) when two dissimilar surfaces are very close, charges can hop across from one surface to the other. The surface charges are balanced by an oppositely charged ion layer in the solution at some distance away from the surface, forming the EDL. The idea of the EDL was first formally proposed by Helmholtz, who derived the charge distribution in the solution based on the simple molecular capacitor model [34]. In reality, the thermal motion of ions in the solution introduces a certain degree of chaos causing the ions to be spread out in the region of the charged surface, forming a 'diffuse' double layer. In that case, the analysis of the electronic environment near the surface is more complex and requires more detailed analyses [33]. Gouy [35], Chapman [36] and Stern [37] put forward more accurate models for analysing the surface and electrolyte interfaces, making great contributions to the development of EDL theories. Gouy [35] and Chapman [36] independently developed theories of a so called 'diffuse double layer', in which the change in the concentration of the counter ions near a charged surface follows the Boltzmann distribution. The Gouy–Chapman theory provides a better approximation of the real system than the Helmholtz theory, but it still has limited quantitative applications. It assumes that ions behave as point charges and that there is no physical limit for the ions in their approach to the surface. Then, the Gouy–Chapman diffuse double layer was modified by Stern [37] so that ions have a finite size and cannot approach the surface closer than a few nanometres: the first layer of ions in the Gouy–Chapman diffuse double layer are not at the surface, but at some distance away from the surface. As a result, the potential and concentration of the diffuse part of the layer is low enough to justify treating the ions as point charges. Stern also assumed that some ions are probably adsorbed by the surface in a plane; this layer is known as the 'Stern layer' [37]. Within this layer, thermal diffusion is not strong enough to overcome the electrostatic forces. In the diffusive outer layer, the ions are far enough from the solid surface and are subjected to weak electrostatic forces from the surface only, hence they remain mobile.
A double layer is formed to neutralize the charged surface, which in turn causes an electrokinetic potential between the surface and any point in the mass of the suspending liquid. This voltage difference is of the order of millivolts and is referred to as the surface potential. The magnitude of the surface potential is influenced by the surface charge and the thickness of the double layer. Starting from the surface, the potential drops off roughly linearly in the Stern layer and then exponentially through the diffuse layer, approaching zero at the imaginary boundary of the double layer. The potential curve is useful because it can suggest the electrical force strength between particles and the critical distance within which this force comes into play. A charged particle's mobility is related to the dielectric constant and the viscosity of the suspending liquid, as well as the zeta potential, which is a potential at the boundary between the moving particle and the liquid. The boundary is called the slip plane and usually defined as the point where the Stern layer and the diffuse layer meet [38, 39]. The common EDL model is shown in figure 3. The EDL interaction energy and the force between the bodies of different geometries can be referred to [40].

Figure 3. Schematic model of EDL.
Download figure:
Standard image High-resolution image2.3. Capillary force
Capillary force is mainly due to the formation of liquid menisci (also termed the meniscus force), the significance of which was realized by Haines [41] and Fisher [42]. Capillary force can be classified into two types: normal capillary force and lateral capillary force [43]. A comprehensive review of the normal capillary force was given by Butt and Kappl [44]. Denkov et al [45] and Kralchevsky and Nagayama [46] contributed a lot to the study of the structure of colloid nanoparticles due to the lateral capillary force. Capillary forces should be considered in the studies on powders, soils and granular materials [47–50], the adhesion between particles or particles to surfaces [51, 52] and the stiction in micro/nano-electromechanical systems [53]. It is also relevant to nanoparticle assembling or living cells self-assemble technologies [54, 55].
The normal capillary force arises from the Laplace pressure within the curved meniscus formed by liquid condensation or vapour bridges around two adhering solid surfaces [43, 44]. It can be attractive or repulsive depending on whether the capillary bridge is concave or convex. Two equations are important to understand the capillary forces, i.e. the Young–Laplace equation and the Kelvin equation. The Young–Laplace equation relates the curvature of a liquid interface to the pressure difference, while the Kelvin equation describes capillary condensation, which is the physical basis for many adhesion phenomena [46]. Capillary condensation is the condensation of vapour into capillaries or fine pores even for vapour pressures below the saturation vapour pressure. The Kelvin equation relates the actual vapour pressure to the surface curvature of the condensed liquid. The normal capillary force is owing to two actions: one is the pressure difference across the curved interface and the other is the action of the surface tension force exerted around the annulus of the meniscus. Butt and Kappl [44] gave the usual derivations and expressions for capillary forces between different geometries.
The origin of the lateral capillary forces is the overlap of the perturbations in the shape of a liquid surface due to the presence of attached particles [46]. The larger the interfacial deformation created by the particles, the stronger the capillary interaction between them. The theories and expressions of lateral capillary forces for particles bound to interfaces, liquid films and biomembranes were included in a good review by Kralchevsky and Nagayama [46]. The lateral capillary forces are effective in controlling small colloidal particles and protein macromolecules confined in liquid films to form fine microstructures.
2.4. Other forces—solvation, structural and hydration forces
Apart from vdW forces and EDL forces, some other forces, i.e. solvation, structural or hydration forces, come into play when two surfaces or particles approach very close (separation less than a few nanometres) in the liquid. These forces can be monotonically repulsive, monotonically attractive or oscillatory and they can be much stronger than either the vdW forces or EDL forces at small separations. Solvation, structural or hydration forces (in water) arise between two particles or surfaces if the solvent or water molecules become ordered by the surfaces [56]. When the ordering occurs, an exponentially decaying oscillatory force with a periodicity equal to the size of the confined liquid molecules, micelles or nanoparticles appears [56–58]. Solvation forces depend not only on the properties of the liquid medium but also on the surface physicochemical properties, such as hydrophilicity, roughness, crystalline state, homogeneity, rigidity and surface micro-texture. These factors affect the structure of the confined liquids between two surfaces, which in turn affects the solvation force [29]. The hydration force is a strong short-range repulsive force between the polar surfaces separated by a thin polar liquid layer (thickness <3 nm); the force magnitude decays exponentially with the liquid layer thickness [58–62]. The physical mechanisms underlying the hydration force are still in discussion. A well known interpretation of hydration force is that the solvent molecules are bound strongly and are restructured by polar surfaces. An ordered-solvent layer was formed at the surface-solution interface, which exponentially decays away from the surface; the overlap of the ordered-solvent layers near the two mutually approaching surfaces creates a force [59–61]. The hydration force could determine the behaviours of many diverse systems, e.g., the colloidal dispersion stability, the swelling of clays and the interactions of biological membranes.
2.5. DLVO theory
The DLVO (Derjaguin–Landau–Verwey–Overbeek) theory was introduced by Derjaguin and Landau [63] in 1941 and Verwey and Overbeek [64] in 1948 for describing the stability of colloidal dispersions. The theory combines the effects of the vdW attraction and the electrostatic repulsion. It can explain many phenomena quantitatively in colloidal science, e.g., the adsorption and the aggregation of nanoparticles in aqueous systems, and describe the force between charged surfaces interacting through a liquid medium [65–69]. Figure 4 shows the schematic plot of the DLVO interaction potential energy E of model nanoparticles (diameter: 100 nm and surface potential: 20–40 mV) which are dispersed in aqueous salt solutions.

Figure 4. Schematic plots of the DLVO interaction potential energy E (the Hamaker constant A is 1.5 × 10⁻²⁰ J).
Download figure:
Standard image High-resolution imageIt can be seen that a strong long-range repulsion with a high energy barrier is present for highly charged surfaces in dilute electrolyte (i.e. long Debye length). When the surface charges are reduced or the concentration of the electrolyte solutions are increased, a small secondary minimum in the potential energy curve appears. Colloid particles may undergo a reversible flocculation due to the secondary minimum because of its weak energy barrier [33], resulting in slow particle aggregation for the surface with a low charge density. Below a certain surface charge or above a certain electrolyte concentration (known as the critical coagulation concentration), the energy barrier falls below the zero axis and particles then coagulate rapidly. Consequently, the colloid system becomes unstable.
Although the DLVO theory is the basis for understanding colloid stability and has a considerable amount of experimental support, it is inadequate for the colloid properties in the aggregated state. This is because short-range interactions are dominant in this state and the specific properties of ions should be taken into account rather than regarded as point particles. Most deviations of experimentally measured forces from those expected from the DLVO theory are due to the existence of a Stern-layer or non-DLVO forces, e.g., ion-correlation, solvation, hydrophobic and steric forces [70–72].
2.6. Contact, adhesion and deformation theories of nanoparticles
In traditional contact theories for two objects in contact with each other under external forces, for instance, the simplest case of two interacting elastic spheres deduced by Hertz in 1882 [73], surface forces were not included. In these models, the displacement and the contact area are equal to zero when no external force is applied. However, as the size of the object is decreased to the nanoscale, the surface forces play a major role in their adhesion, contact and deformation behaviours. Modern theories of the adhesion mechanics of two contacting solid surfaces are based on the Johnson–Kendall–Roberts (JKR) theory [74] or the Derjaguin–Muller–Toporov (DMT) theory [75]. The JKR theory is applicable to easily deformable, large bodies with high surface energies. Strong, short-range adhesion forces dominate the surface interaction; the effect of adhesion is included within the contact zone. In contrast, the DMT theory better describes very small and hard bodies with low surface energies [76]. In this case, the adhesion is caused by the presence of weak, long-range attractive forces outside the contact zone. Tabor [76] introduced a nondimensional physical parameter, often referred to as Tabor's parameter, to quantify the limits of JKR, DMT and the cases between them. The intermediate regime between the JKR and the DMT theories has also been described by Maugis [77] using the Dugdale model [78]; a 'transition parameter' roughly equivalent to Tabor's parameter was defined [77]. A summary of the different conventions used for defining the 'transition parameter' was given by Greenwood [79]. Carpick et al [80] provided a simple analytic equation to determine the value of the 'transition parameter'; it could closely approximate Maugis' solution. The expansion of the JKR theory by Maugis and Pollock [81] leads to the additional description of plastic deformation. Table 2 summarizes the relations between the contact radius, deformation and the adhesion force for two spheres contacting each other according to the three mostly used theories.
Table 2. Relations between the contact radius a, the contact radius a0 due to adhesion force without an external load, the deformation δ and the adhesion force for two spheres contacting each other according to the Hertz, JKR and DMT theories.
| Hertz | JKR | DMT | |
|---|---|---|---|
| a |
 |
![$\bigg\{\dsty\frac{R^{\ast }}{E^{\ast }}[P+3\pi R^{\ast }\gamma+\,(6\pi R^{\ast }\gamma P+\,(3\pi R^{\ast }\gamma )^{2})^{1/2}]\bigg\}^{1/3}$](https://content.cld.iop.org/journals/0022-3727/47/1/013001/revision1/jphysd457907ieqn010.gif) |
![$\left[{\dsty\frac{R^{\ast}}{E^{\ast}}(P+2\pi R^{\ast}\gamma )} \right]^{1/3}$](https://content.cld.iop.org/journals/0022-3727/47/1/013001/revision1/jphysd457907ieqn011.gif) |
| δ |
 |
|
 |
| a0 | 0 |
 |
 |
| Pad | 0 | 2πR*γ |
 |
Note: R* is the reduced radius defined as 1/R* = (1/R1) + (1/R2), γ is the adhesion work per unit area. P is the external force and E* is the reduced Young's modulus defined as
![$({1}/{E^{\ast}})=\case{3}{4}[{({(1-v_{1}^{2} )}/{E_{1}})+({(1-v_{2}^{2} )}/{E_{2}})}]$](https://content.cld.iop.org/journals/0022-3727/47/1/013001/revision1/jphysd457907ieqn017.gif) , E1, E2, and ν1, ν2 are Young's moduli and Poisson's ratios of the two spheres, respectively.
, E1, E2, and ν1, ν2 are Young's moduli and Poisson's ratios of the two spheres, respectively.
Although the Hertz, JKR and DMT theories have been widely used to study the mechanical properties of nanoparticles [21, 22, 82, 83], whether or not the continuum mechanics can be used to describe a particle at the nanometre scale is still in discussion. The molecular dynamics (MD) simulation method provides an opportunity to understand the atomistic processes in the contact region. Luan and Robbins [84] researched the contact between two nanocylinders by MD simulations and found that the atomic-scale surface roughness produced by discrete atoms led to dramatic deviations from the continuum theory. Contact areas and stresses may be changed by a factor of two, whereas friction and lateral contact stiffness by an order of magnitude. Also Miesbauer et al [85] analysed the contact between two NaCl nanocrystals with MD simulations. It was found that the Hertzian theory was a suitable description of the studied system when the system size was larger than 50 Å; the discrepancy became more obvious as the particle was even smaller. Cheng and Robbin [86] investigated the nanoscale contact with MD simulations to test the adaptability of continuum contact mechanics at the nanoscale; the results suggested that the continuum contact models could be applied to the case where the forces averaged over the areas containing many atoms. Nonetheless, the continuum theory, because of its concise expression, is still widely applied in the mechanical analysis at the nanoscale, such as designing micro/nano-devices [87], creating nanostructured materials with optimized mechanical properties [88] and understanding the molecular origins of friction and adhesion [89–91].
3. Main techniques for studying nanoparticles
The research methods frequently used in studying the mechanical properties of nanoparticles will be briefly introduced as follows:
3.1. AFM techniques
AFM is a powerful technique that can be used to obtain both high-resolution images on many kinds of solid surfaces and the vertical force as well as lateral force between a sharp tip and the surface [92–94]. The schematic diagram of the basic working principle of AFM is shown in figure 5, including a cantilever with a sharp tip on its end, piezotube scanner, scanning and feedback systems, a four quadrant photoelectric detector and the computer. Briefly, the sharp tip scans over the sample and the deflection of the cantilever is quantified through a laser beam reflected off the backside of the cantilever and received by the photoelectric detector. If a constant force is kept between the tip and sample during scanning, the topographic image of the sample surface can be obtained by plotting the height of a sample stage on the piezoscanner, which is controlled by a feedback system. Alternatively, the interaction force between the tip and sample can be obtained with the cantilever's vertical deflection using the force-versus-distance curves, briefly called force curves, together with Hooke's law [95, 96]. These curves can provide valuable information on some of the important properties of nanoparticles, such as hardness, elastic modulus and the adhesion between nanoparticle and substrate. The lateral force is closely related to the torsional deflection of the cantilever; an accurate value can be obtained after careful calibration of the cantilever's torsional coefficient [97]. More details about the basics of AFM can be seen in [93, 96].
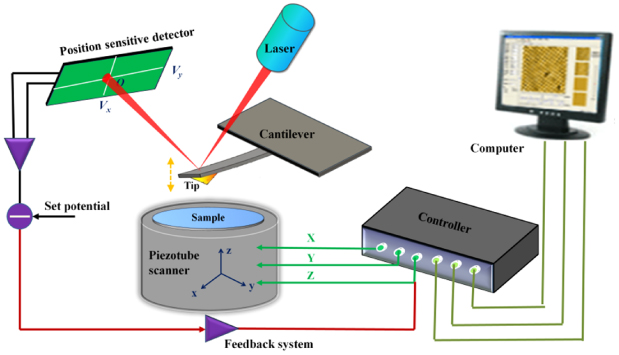
Figure 5. Schematic diagram of the basic working principle of AFM.
Download figure:
Standard image High-resolution image3.2. Particle tracking velocimetry (PTV)
PTV is an image-based velocimetry method of measuring the velocity field and tracking individual particles in fluidic systems [98, 99]. Fluorescent particles are usually used as tracers within a defined area where those particles are illuminated; then pictures of these particles are taken. The motion trajectories of the particles can be reconstructed by locating them in those pictures and the velocities of the particles can be calculated correspondingly. Based on these, deep insight into some of the complex and low-velocity flows in a region can be acquired. It is a technique that is slightly different from particle image velocimetry (PIV) where the particles' displacements within a segment of an image are averaged [100]. Currently, there are mainly two different PTV methods, i.e. two-dimensional particle tracking velocimetry (2D-PTV) [101] and three-dimensional particle tracking velocimetry (3D-PTV) [102]. The defined area is a thin light sheet for 2D-PTV while it is an illuminated volume for 3D-PTV, which is usually based on a multiple-camera-system.
3.3. In situ TEM
TEM could provide images with a significantly higher resolution than a light microscope by using electrons as 'light source' which have a much lower wavelength [103, 104]. The basic principle is that a beam of electrons passes through a very thin sample and, after interacting with the atoms in the sample, some unscattered electrons reach a fluorescent screen to form an image. The image is shown in varied darkness indicating the material density in different parts of the specimen. The image is magnified and can be studied directly from the screen or recorded with a camera for post-analysis. In situ TEM offers the capability of real-time observation of the responses of the microstructural evolution of nanostructures to external active stimuli and their relationship with properties [19, 105]. Active stimuli applied to the sample examined in the microscope during simultaneous imaging include mechanical [19], thermal [106] and electrical [107] ones, etc.
3.4. MD simulation
Computational simulations are usually considered as very useful complementary tools to experimental studies on the mechanical properties of nanoparticles [108]. Among many different kinds of computation methods, MD simulation is an important aspect which could model the time evolution of the physical motions of interacting atoms or molecules [109, 110]. It is a computation method that is based on statistical mechanics; statistical ensemble averages are normally hypothesized to be equal to the time averages of the system. Mostly, in MD simulation, Newton's equations of motion for the atoms or molecules in a system are numerically solved to get their positions and velocities and finally to describe the thermodynamic behaviours of the system. The interactions and potential energy between atoms or molecules are defined by a molecular mechanics force field.
4. Basic mechanical properties of nanoparticles
4.1. Hardness and elastic modulus of nanoparticles
Understanding some basic mechanical properties of nanoparticles, such as the hardness and the elastic modulus, will aid a lot in the proper design of particles in specific applications, as well as evaluating their roles and action mechanisms. To the authors' knowledge, the measurement of the mechanical properties of microparticles has been developed for decades. The microindentation technique was used by Steinitz in 1943 to test the hardness of microparticles with indented areas of larger than 100 µm2 and a minimum indenter size of 20 µm2 [111]. About ten years ago, nanoindentation was employed by Shorey et al to measure the elastic properties of particles (average size: 5 µm) used for magnetorheological finishing [112]. Their methods were aimed at measuring the film of particles rather than individual particles. The deformation behaviours of polystyrene microspheres (diameter: 20 µm) by using AFM against a mica surface was firstly investigated by Biggs and Spinks in 1998 [82]. Since then, protocols of calculating the mechanical characteristics (e.g., the elastic modulus) of nanoparticles have developed rapidly, primarily by measuring the particles' deformation with AFM. Typically, quantitative computation of the elastic modulus of nanoparticles requires the measurement of indentation h by converting AFM force-displacement curves into force-indentation curves instead of measuring the contact area radius [21]. The latter is hard to obtain directly. The external load P applied through the cantilever (its spring constant denoted as k) to the tip can be described with the Hooke law,

where δc is the cantilever deformation. The indentation depth h of the tip into the sample surface is:

where z is the piezo displacement. The relative displacements and deformations of the particle-AFM tip system in the indentation process are shown in figure 6. Since there is often system thermal drift, the deflection offset, δc0 should be considered. In this case, equation (1) can be rewritten as

Also, if the position for the tip initially touching the sample surface is considered, resulting in another height offset z0, equation (2) becomes

In this way, the force–indentation curves can be obtained for the calculation of the particles' elastic modulus by evaluating the slope of the loading region on the curves with contact theories. More details about the calculation of the elastic modulus of compressed nanoparticles can be seen in [22, 83, 113]. Mostly based on the previous method, the elastic modulus of a variety of nanoparticles have been measured by compressing or bending particles primarily with AFM, as summarized in table 3; the hardness of some nanoparticles is also given. As shown, the nanoparticles' hardness and elastic modulus often deviate from their bulk materials' and some show obvious size-dependent behaviours. Typical related results and the underlying mechanisms can be divided as the following three categories.
- (1)In the case of spherical polymer nanoparticles, there are yet no uniform size-dependent behaviours of the mechanical properties. For instance, the compressive moduli of the polystyrene nanoparticles (diameter: 200 nm) were found to be slightly less than those of the corresponding bulk materials due to the presence of hydrated ionic functional groups [21]. In contrast, the work conducted by Paik et al [22] showed that the elastic modulus of polypropylene (PP) nanoparticles was higher than that of the bulk material. It was thought that the glass transition temperature (Tg), the crystalline phase and crystallinity etc could affect the deformation of the polymer chain inside and thereby result in the change of the particle's elastic modulus.
- (2)For crystalline metal nanoparticles, dislocations inside the particles have been demonstrated as one of the factors contributing to the change in the mechanical behaviour of nanoparticles, which is in contrast to the traditional view that no dislocation is present in crystalline nanoparticles. The experimental work done by Ramos et al [120] indicated that the hardness and elastic modulus of six-fold symmetry gold nanoparticles were higher than the bulk phase due to the formation of stacking faults and dislocations in specific crystallographic directions. Mordehai and Nix et al [139, 140] performed nanoindentation and compression tests combined with theoretical simulation to reveal the deformation behaviours of single-crystal gold nanoparticles on sapphire substrates. The particle strength under indentation increased with the lateral dimension of the particle due to the competition between the generation of dislocations beneath the indenter and their drainage from the particle [139]. Under compression with a flat diamond punch, the compressive stress of the particle increased with the decrease of the particle size since the nucleated dislocations resulted in the stress gradient along the slip planes [140]. In situ TEM nanoindentation experiments showed the direct evidence of the presence of dislocations in metal nanoparticles during deformation but they disappeared during the unloading process, as shown in figure 7 [105]. Wang et al [141] recently demonstrated a new kind of stacking fault related with dislocations in gold nanocrystals, which could nucleate, migrate and annihilate under mechanical loading with in situ TEM and MD simulation.For silicon nanoparticles, similar behaviours were observed by Gerberich et al [125] that their hardness (particle diameter: 40 nm) was four times greater than the value of bulk silicon. They proposed that the dislocations or line defects inside the particle are the main factors resisting high pressures. Furthermore, atomistic simulation conducted by Zhang et al [124] confirmed that the superhard silicon nanoparticles resulted from the nucleation and movement of dislocations. Apart from dislocations or defects, the changes of the lattice strain and the bond energies of nanoparticles to the compressive stress were proposed as another cause for the strengthening and weakening of the mechanical properties of nanoparticles [142]. Furthermore, first-principles electronic-structure calculations made by Cherian et al [143] suggested the size dependence of the bulk moduli of several semiconductor nanoclusters correlated with the strong interaction with the passivant.
- (3)For nanowires or nanotubes, it has been typically found by Jing et al [127] and Cuenot et al [128] that the elastic moduli of silver and lead nanowires decreased with the increasing radial diameter. They proposed that the increase in the modulus was attributed to the effects of the surface stress, the oxidation layer and the surface roughness [127], or the surface tension effect [128]. MD simulations conducted by Yang et al [144] showed the bulk modulus of Ni/Ni3Al nanowires increased but the surface energy decreased with the increasing wire perimeter size. However, only the fracture properties rather than the elastic behaviour of ZnO nanowires were affected by the surface effects due to the presence of surface cracks and defects [129].Worth mentioning is the fact that measuring the mechanical properties of individual nanoparticles is very complex; many influencing factors could affect the finally measured results. These factors include the uniform dispersion of nanoparticles on an ideally hard substrate, the precise locating of particles and the proper application of loads onto the particles, as well as the measurement of the minimum particle deformation, etc. In addition, many uncertainties during measuring and calculating the mechanical properties of nanoparticles with AFM, e.g., uncertainties associated with the instrument calibration and the calculation models, should be considered [138].
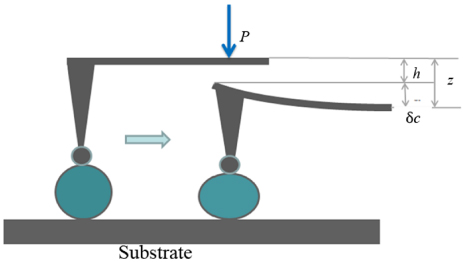
Figure 6. Relative displacements and deformations of the particle-AFM tip system during the indentation process. Left: the AFM tip just touches the particle without deformation of the particle. Right: the particles' deformation occurs due to the applied force by the AFM tip.
Download figure:
Standard image High-resolution image
Figure 7. High-resolution TEM images of a silver nanoparticle before and after compression: (a) before compression (twin highlighted); (b) at the initial stage of compression (an edge dislocation highlighted); (c) at a stage of further compression (two additional dislocations shown in the inset); (d) after the removal of the compression (no dislocation observed) [105].
Download figure:
Standard image High-resolution imageTable 3. Summary of the hardness and elastic modulus of different particles with the size of several hundreds of nanometres or smaller.
| Particle material | Diameter/size | Hardness/(bulk value) | Elastic modulus/(bulk value) | Indentation depth | Notes | ||
|---|---|---|---|---|---|---|---|
| Organic nanospheres | Polystyrene(PS) [21, 114] | 58–194 nm [21]; | 8.0–4.1 GPa [21]; | 3–6 nm [21] | Modulus increases with the decrease of particle size [21] | ||
| 180–250 nm [114] | 1–2 GPa [114]/(3–3.6 GPa) [115] | 5–6 nm [114] | Vinylbenzyl(trimethyl) ammonium chloride units inside [114] | ||||
| Polypropylene(PP) [22] | 200–500 nm | 1.3–2.8 GPa/(1.5–2 GPa) | 1.5 nm | ||||
| Polyesters [116] | 2–3 nm | 0.1–0.3 GPa | Hyperbranched, molecular weight = 3000–7000 | ||||
| Polyethylenimine (PEI) [117] | 15 nm | 5–160 MPa | up to 10 nm | Bigger pressure resulted in larger modulus | |||
| Poly-(methylmethacrylate) (PMMA) [118] | 350 nm | 4.3 GPa/(4 GPa) [115] | up to 60 nm | 6.6 GPa (200 °C heat treatment) | |||
| Liquid crystal [119] | 95–150 nm | 0.1–0.6 GPa | 10 nm | 4-pentyl-4-cyanobiphenyl (5CB) (main component) | |||
| Core/shell | PS/CeO2 [113] | 130–260 nm | 5–15 GPa | 20–30 nm | Modulus increases with particle size | ||
| PMMA/silica [113, 118] | 450 nm [118]; 350 nm [113] | 10.3 GPa [118]; 9–11 GPa [113] | up to 80 nm | PMMA-based terpolymer [113] | |||
| Metal nanoparticle | Gold [120] | 22 nm | 1.72 GPa/(Vickers hardness 216 MPa) | 100 GPa/(79 GPa) | 3–5 nm | Six-fold symmetry gold nanoparticles | |
| Gold modified with proteins [121] | 10 and 20 nm | 0.12 and 0.08 GPa (a); 0.22 and 0.13 GPa(b) | 1.3 GPa(a); 9.5 and 1.0 GPa(b) | Protein: (a) bovine serum albumin; (b) streptavidin pure gold particle: hardness = 0.4 GPa; modulus = 5.2 GPa | |||
| Silver [122] | 13 nm | 3.12 GPa/(Vickers hardness 251 MPa) | 103.9 GPa/(83 GPa) | ||||
| Silicon nanoparticle | 40–140 nm [123]; 5–40 nm [124]; 40–100 nm [125] | 25–34 GPa [124]; 20–50 GPa/(12 GPa) [125] | 600–180 GPa [123]/(around 150 GPa) | 13–36 nm [123] 3–24 nm [125] | Modulus increases with decrease of particle size [123]; simulation result [124] | ||
| Nanowire, nanotube, etc. | Gold nanowire [126] | 40–250 nm | 70 ± 11 GPa | 400 nm (displacement) | |||
| Silver nanowire [127, 128] | 20–140 nm | 75–160 GPa | |||||
| lead nanowire [128] | 30–280 nm | 14–30 GPa/(16 GPa) | |||||
| ZnO nanowires [129] | 70, 99 nm | 120, 83 GPa/(140 GPa) | |||||
| WS2 nanotube [130] | 20 nm | 171 GPa/(150 GPa [131]) | |||||
| Boron nitride (BN) nanotubes [132] | 0.58–2.38 nm | 40.78–1.85 GPa/(30–40 or 74 GPa) | Single-walled, modulus decreases with diameter increases | ||||
| Carbon nanotubes [133] | 0.92–1.91 nm | 57–9 GPa/(36.5 GPa, bulk graphite [134]) | |||||
| Carbon nanotubes [135] | ∼9 nm | ∼16 GPa | Multi-walled | ||||
| Silicon nitride nanobelts [136] | 20–50 nm (thickness) | 570 GPa (bending modulus)/(120–330 GPa) | 150 nm (displacement) | ||||
| Cellulose nanocrystals [137] | 4.2 nm (wood), 5.9 nm (cotton) [137] 8–20 nm [138] | 24.8, 17.7 GPa [137]; 8.1 GPa(mean value) [138] | Cellulose nanocrystals are crystalline, rod-like shaped particles | ||||
4.2. Adhesion and friction of nanoparticles
The adhesion and the friction of nanoparticles play important roles in nanofabrication, lubrication, the design of micro/nano devices, colloidal stabilization and drug delivery. In this case, characterizing the adhesion and friction behaviours of nanoparticles has attracted significant research interest over the past decade [84, 145–157]. So far, AFM has been proved to be a powerful tool to measure the adhesion and friction between a nanoparticle and a solid surface. The AFM tip itself can also be thought of as a nanoparticle; then the adhesion force as well as the friction force can be easily obtained by the cantilever's deflection [151, 154]. However, the use of AFM is practically limited by the tip material and its geometric shape. By attaching the particle to the force sensor in the microscope, the force between a surface and a colloid particle was directly measured with AFM by Ducker et al in 1991 [70]. Since the properties of the attached particle, such as the size, the shape and the material were controllable, the uncertainties in the force measurement caused by the irregular shape of the AFM tip etc could be avoided. Hence, the colloidal probe technique is more effective for studying the adhesion and friction of micro/nanoparticles [96, 158]. Nevertheless, it is actually very difficult to attach a single nanoparticle with the size of less than 1 µm on the AFM force sensor; the colloid probes in most references have sizes larger than 1 µm [158]. A chemical method was used by Vakarelski et al to place individual gold nanoparticles (20–40 nm) on the tip of an AFM cantilever to measure the adhesion force between nanoparticles and mica [159]. Ceria nanoparticles (50 nm in diameter) were attached on the AFM tip with epoxy glue by Ong and Sokolov [160] to measure the adhesion force between nanoparticles and a flat silica surface. Other various methods include measuring the adhesion force of the tip against a film of nanoparticles [153, 161–163] and manufacturing a tip with a certain curvature by thermal oxidation, etc [164, 165].
Besides the direct adhesion measurement by the vertical deflection of the AFM cantilever, nanoparticle movement manipulation by the cantilever's torsional deflection was firstly used to push C60 islands grown on a NaCl surface in 1994 [156]. Since then, this method has been increasingly popular to characterize the intriguing nanoadhesion/friction behaviours of nanoparticles [91]. For instance, the frictional anisotropies for molybdenum oxide (MoO) nanoparticles were investigated by Sheehan and Lieber [166]. The maximum sliding friction force between polymer latex spheres (radius between 50 and 100 nm) and a highly oriented pyrolytic graphite (HOPG) surface was obtained by Ritter et al [23]. More recently, the interfacial friction between antimony (Sb) nanoparticles and a HOPG surface was successfully measured through pushing nanoparticles with the AFM tip by Dietzel et al [167]. In addition, the adhesion forces between nanoparticles with different sizes and the surface were measured by Guo et al [24].
In the most general case, the adhesion force is a combination of electrostatic force, vdW force, meniscus or capillary force, solvation force and structure force, etc. The adhesive contact between elastic surfaces is usually described by single-asperity theories such as JKR, DMT or M-D (Maugis-Dugdale) theories, as mentioned previously. The adhesion force of micro/nanoparticles has been extensively studied and most of the equations for the continuum contact theories can be applied extremely well, even at the submicron scale [82, 85, 168–170]. A linear dependence of the adhesion force on the reduced radius was found by Heim et al [170] for the adhesion between silica spheres, proving that the DMT theory was also valid for the particle with dimensions below 1 µm. The simulation of the adhesion between a nickel AFM tip and a gold surface by Landman et al [168] showed good agreements with the JKR theory for both the mean positions of atoms and the stress distribution. Individual nanoparticles with varying size from about 50 to 500 nm were manipulated on a silicon surface using AFM by Guo et al [24]. The results showed that the friction forces between the particles and the substrate were proportional to the two third power of the radius, which was in agreement with the Hertzian theory, as shown in figure 8. The situations where the continuum contact theories are no longer applicable involve changing surface energy with time [171–173], viscoelastic materials [174, 175] and rough surfaces [176, 177]. All of these factors could give rise to hysteresis and time-dependent effects.

Figure 8. AFM images of a nanoparticle on the substrate (a) before and (b) after manipulation; (c) the dependence of the friction force of polystyrene particles on the silicon surface on the particle radius (R) [24].
Download figure:
Standard image High-resolution imageUnder ambient conditions, the capillary force (meniscus force) was demonstrated to make the largest contribution to the adhesive force [178]. The capillary force between a plate and a sphere was calculated by O'Brien and Hermann [179], proving the meniscus dimension was of 1 nm [180, 181]. The adhesion between particles in aqueous media was found to be mainly influenced by the electrostatic force [182, 183], solvent force and structure force [184–186]. For small particles of nanoscale size, more subtle effects beyond continuum theories have been observed. Specifically, the surface molecular structure, the distribution of terminal groups on the particles' surfaces and the surface energy variation due to particle deformation could influence and even dominate the adhesion behaviours [84, 153, 158, 187, 188].
In Amontons and Coulomb's friction theories for describing macroscopic dry sliding friction, the friction is proportional to the normal force, but independent of the contact area as well as the sliding velocity. However, the tribological properties at the micro/nano scale cannot be explained with these empirical theories. Ever since 1987 when the frictional forces were detected with AFM by Mate et al [154] for the first time, the friction at the micro/nano scale has been observed by many researchers to deviate considerably from the predictions based on established macroscopic laws. The nanoscopic friction is proportional to the true contact area, which is not necessarily proportional to the loading force [189–191]. Furthermore, the friction in a nanoscale contact increases logarithmically with the sliding velocity [192], being in sharp contrast to empirical theories. The friction between the AFM tip and the substrate has been measured as a function of many parameters, such as the externally applied load [189–191, 193, 194], the sliding velocity [192, 195, 196], the tip radius and shape [189, 191], the relative orientation between the scan direction and the substrate lattice [197–200], the temperature [201, 202] and the chemical nature of the sample [203–205]. The method using the AFM tip to control the lateral manipulation of nanoparticles provides a powerful tool to measure the interfacial friction of nanoparticles with arbitrary materials and sizes. Polymer latex spheres (50–100 nm in radius) were manufactured by Ritter et al [23] on a HOPG surface; the threshold force needed to overcome the static friction of a single latex sphere was found to depend on the sphere size, being in accordance with the JKR and DMT theories. Similarly, Sb nanoparticles on a HOPG surface were pushed by Dietzel et al [157] with an AFM tip and two coexisting frictional states were observed: some particles showed finite friction and increased linearly with the interfacial areas, while other particles experienced a state of frictionless sliding. The transition from static to kinetic friction was also investigated in another of their work and a hysteretic character in the force domain was found [167]. Polystyrene nanospheres with radii varying from about 30 to 200 nm on the polished nanosmooth silicon surface were manipulated by Guo et al [24] with the contact mode of AFM; the typical results are shown in figure 9. The results indicated that the ratios between the kinetic friction Ff-kinetic and the static friction force Ff-kinetic were in the range of 0.3–0.6. Moreover, the ratio did not change whether the particles were located in different areas of the surface, the tip normal force was varied or even the surface was modified [24].

Figure 9. Static and kinetic frictions and their ratios for particles with radii of 71.85 nm and 228.2 nm on a non-hydroxylated surface and a hydroxylated surface, respectively. The normal load is 348 nN. The columns with solid fill and horizontal stripes represent Ff-kinetic and Ff-kinetic on the non-hydroxylated surface, respectively. The columns with vertical and oblique stripes repesent those on the hydroxylated surface, respectively. The square and the circle represent the ratio of Ff-kinetic and Ff-kinetic for particles with R of 71.85 nm on the non-hydroxylated and the hydroxylated surface, respectively. The triangle and the rhombus represent those for particles with (R = 228.20 nm) on the non-hydroxylated surface and the hydroxylated surface, respectively [24].
Download figure:
Standard image High-resolution imageGold particles with a mean diameter of 25 nm were manufactured by Mougin et al [206] on silicon substrates; it was found that the adhesion of the particles to the substrate was strongly reduced by the presence of hydrophobic interfaces. The friction and wear of spherical gold nanoparticles under dry conditions and submerged in water were studied by Maharaj and Bhushan [207]; the results indicated that the addition of gold nanoparticles reduced friction and wear. Sitti and Hashimoto [208, 209] proposed an AFM-based force-controlled pushing system for the manipulation and assembly of nanoparticles. Interaction forces among the AFM probe tip, the nanoparticle and the substrate, including the vdW force, capillary force, electrostatic force, repulsive contact force and frictional force were analysed [208]; several modes of particle motion including sliding, rolling and rotation were observed [209].
4.3. Movement of nanoparticles
Various forces such as gravitational (buoyancy) forces, surface forces, viscous flow forces and the forces due to Brownian motion result in the movement of nanoparticles in the media in different ways [210–220]. However, the experiments for the direct observation of nanoparticles' movement are limited primarily due to the small particle size preventing the application of the most commonly used imaging techniques. Fortunately, the rapid development of measurement technology provides opportunities for tracking individual nanoparticles or even single molecules. Up to now, several methods have been used for making high-resolution measurements of the motion of single nanoparticles. Among these methods, two groups can be classified: one is to passively track the particle motion without applying significant external stimuli and the other is to measure the particles' motions under external mechanical forces [221]. To be more specific, studies based on two typical methods will be emphasized in the following parts.
The first method is particle tracking with the fluorescence technique. A system for observing nanoparticles was developed by Xu et al [222] using a high-resolution fluorescence microscope and fluorescent core-shell SiO2 nanoparticles of 50–60 nm in diameter were used as the seed nanoparticles. By using this system, the velocity profile of nanoparticles in a channel flow [222], the Marangoni flow in evaporating water droplets [223] and nanoparticle–wall collision behaviours [224] were investigated. The Marangoni flow in a droplet manifested with fluorescent nanoparticles revealed a stagnation point where the directions of the surface flow, the surface tension gradient and the surface temperature gradient changed, as shown in figure 10 [223]. The nanoparticle–wall collision experiments showed the nanoparticles adsorbed on the solid surface after collision in liquid were much easier to be removed than those deposited on dry surfaces [224]. The reason for this observation was that the particles might be adsorbed at the secondary minimum of the particle–wall interaction when the collision occurred in water, rather than at the primary minimum for the particles deposited on dry surfaces, as described in the DLVO theory mentioned earlier. Another system for in situ observing nanoparticles' movement with the fluorescence technique in confined geometries where external loads and rotations could be applied was developed by Lei et al [225]. With this system, it has been found that the velocities of free particles were much larger (20 times) than the rotating speed, providing evidence that nanoparticle impacting was also one of the main surface material removal factors during the surface planarization process. More discussions on this point will be given in the latter part of this review.
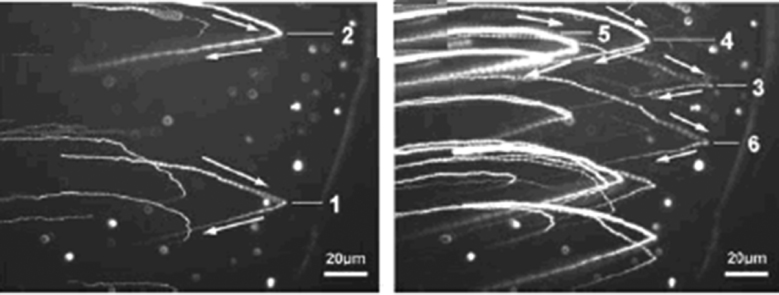
Figure 10. The particle trajectories in a water droplet during the evaporation process [223].
Download figure:
Standard image High-resolution imageThe second method is the TEM observations, which could give more delicate details of the particle movement and provide deeper understanding of the roles of particles in specific applications. The movement behaviours of a single MoS2 nanoparticle in a dynamic contact were directly observed with in situ TEM by Lahouij et al [226]; the results showed that either a rolling or a sliding process of the fullerenes could be possible during shearing. The motion of inorganic nanoparticles during fluid evaporation was observed using a TEM by Zheng et al [227]. The observation of the self-assembled process of nanoparticles in a liquid medium with the particle size comparable to the molecular dimension of the liquid was made using an environmental TEM by Dai et al [228].
The movement of nanoparticles is very complicated due to the influence of many factors, e.g., complex forces, medium and environment. In this instance, the studies on the single nanoparticle's motion in the past were mostly qualitative in nature; more precise measurement methods or instruments with a combination of functions are needed for quantitative analyses in future works.
5. Applications relevant to the mechanical properties of nanoparticles
5.1. Nanoparticles in lubrication
The mechanical properties of nanoparticles play a major role in influencing the tribological properties of lubricated systems with nanoparticles. The effects of the mechanical properties of nanoparticles as lubricant additives on the tribological properties differ in various materials. The lubricating properties of typical nanoparticle materials are summarized in table 4. From a general point of view, the combined effects of rolling, sliding and the formation of a third body layer and tribofilms are the main reasons for the increased lubricating behaviour after adding nanoparticles [12], as briefly described in the following parts.
- (1)The rolling mode of nanoparticles in the lubricated contact area could provide very low friction and wear; however, the occurrence of this effect is strongly dependent upon some properties, e.g., the shape, the size and the concentration of the nanoparticles in the lubricant [246, 250, 253, 254]. Spherically shaped and mechanically stable nanoparticles without significant agglomeration are favourable for their rolling in the contact area between tribopairs [245]. As far as the intrinsic mechanical properties of nanoparticles are concerned, whether the initial spherical shape of the nanoparticles in the contact area can be preserved or not have a close relationship with their hardness/elastic properties, which are also affected by the nanoparticle size [226].
- (2)The sliding mode of nanoparticles could also result in low friction and wear. Sliding friction usually occurs when the particle is not very spherical in shape and has low adhesion to the tribopair surfaces [265]. Besides, particle agglomeration in the contact area is another factor that could lead to sliding friction during the shearing of tribopairs [229–233]. In this case, the nanoparticles play a role as a spacer in minimizing the direct contact between the asperities of two shearing surfaces.Externally applied pressure on the nanoparticles, the rigidity of the tribopair surfaces and the interaction forces between particles are very relevant to the above two modes of particle movement in the lubricated contact area. A smaller applied load and harder tribopair surfaces readily lead to rolling friction of nanoparticles in the contact area, because these would give less of a probability for the particles to mechanically deform or indent into the surface [14, 245]. Moreover, particle agglomeration is greatly determined by the interaction force between particles, thereby inhibiting rolling while promoting the sliding of nanoparticles in the contact area [229, 231]. Another important aspect of the nanoparticle in the lubricant under a low applied pressure is that the viscosity of the lubricant could be enhanced and thereby the oil film formation properties in the lubricated contact could be improved, as shown in figures 11(a) and (c) [218]. It can also be noted from this figure that when the applied pressure increased further, the sliding effect of nanoparticles could give rise to the surface polishing effect.
- (3)When the applied pressure is sufficiently large, nanoparticles become mechanically unstable and delamination of nanoparticles could happen [245, 246]. For instance, studies suggested that when the applied pressure was ∼1 GPa and the tribopair operated in the boundary lubrication regime, exfoliation of inorganic fullerene-like (IF) nanoparticles as the lubricant additive would dominate [244–247]. In this case, material layers of the broken particles could form as the third body and adhere on the tribopair surfaces separating the counterpart. These layers likely align themselves parallel to the tribopair surfaces due to adhesion and shear. It occurs more often for metal dichalcogenide and graphite nanoparticles, which have anisotropic layered structures with weak vdW forces as the bonding interaction between layers [226, 244–249, 253–257]. In addition, valleys between asperities could be filled out by nanoparticles; then the tribopair surface could be partly smoothened out to reduce friction and wear [261].It is worth pointing out that nanoparticles as lubricant additives do not always give rise to favourable tribological properties. Increases in friction and wear, as well as lubricant starvation, were observed due to the abrasive effect of hard nanoparticles under large pressures and heavy aggregations of oils with high particle concentrations in the inlet of the contact area [264].

Figure 11. Typical results of lubrication properties of oils (polyester (PE)) with added diamond nanoparticles: (a) film thickness against ball rolling speed for PE with nanoparticles of different concentrations (applied pressure: 174 MPa); (b) physical model of nanoparticles as additive; (c) SEM image of the rubbing surface under PE lubrication (rubbing time: 30 min; applied pressure: 220 MPa); (d) SEM image of the rubbing surface under PE lubrication with nanoparticles (rubbing time: 30 min; applied pressure: 220 MPa) [218].
Download figure:
Standard image High-resolution imageTable 4. Summary of lubrication properties of nanoparticles of different materials as additives.
| Material category | Examples | Lubrication mechanism and regime | Favourable aspects | Unfavourable aspects |
|---|---|---|---|---|
| Metal nanoparticles | Au [229], Ag [229, 230] Cu [231–233], Ni [234] | (1) Formation of soft and low shear strength tribofilms | Friction and wear reduction, anti-contact fatigue, good extreme pressure | Low dispersibility in organic solvent |
| CuO, ZnO and ZrO2 [235–237], TiO2 [238] Al2O3 [239, 240] | (2) Formation of the third body layer due to mechanical compaction | |||
| Organically coated modification [233, 241, 242] | (3) Extreme pressure related to the size and the hardness of nanoparticles | More stable colloid system | Modification with chlorine and phosphorus containing compounds are not green | |
| Metallic-organic complexes [243] | (4) Effective in mixed lubrication and low-load boundary lubrication | Efficient delivery of particles to the asperity contact | ||
| Dichalcogenide MX2(M = W, Mo; X = S, Se) nanoparticle | WS2 [244–246], MoS2 [226, 247, 248], WSe2 [249] | (1) Rolling/sliding at the low normal stress and exfoliation at the high normal stress under boundary lubrication | Reducing sliding friction, by up to 50%, in the mixed lubrication regime | |
| (2) Layers in the particles can easily slide due to weak intermolecular interactions | ||||
| Carbon-based nanoparticle | Diamond nanoparticle [218, 250–252] | (1) Ball-bearing effect | Friction reduction, anti-scuffing, surface polishing | |
| (2) Viscosity-increasing effect | ||||
| (3) Increase in the surface hardness of tribopair | ||||
| Graphite nanoparticle [253, 254] | Ball-bearing spacers, reduce metal contact and increase the wettability of lubricant on surface | High temperature resistance, extreme pressure and self-lubrication ability | Water insoluble due to hydrophobicity | |
| Fullerene [255–257] | Similar to dichalcogenide MX2 | More effective for low viscosity base oil and high normal loads | ||
| Silicon nanoparticle | SiO2 [258–261], Al2O3/SiO2 composite nanoparticles [262] | Bear load, separate tribopair, prevent direct contact, and promote rolling, inhibit the expansion of the microcracks on the tribopair surface due to particle embedment | Cheap and easily available | |
| Polymer nanoparticle | PTFE nanoparticle [263, 264] | (1) Increased load bearing properties due to large adhesion between lubricant and tribosurface | Reduce friction and wear; extreme pressure | Unstable under high temperature |
| (2) Mechanical energy adsorbed by particles as its deformation occurs (shock-absorbing effect) |
5.2. Nanoparticles in nanomanufacturing
As already mentioned in the introduction, CMP is an indispensable planarization tool in nanomanufacturing ICs. Abrasive and corrosive slurry is used to physically grind and chemically remove microscopic topographic features on a wafer to obtain a flat surface [215]. In this process, abrasive nanoparticles in the slurry are a very important contributor to obtain controlled material removal without sacrificing planarity. They usually either embed in the polishing pad or remain immersed in the slurry, as schematically shown in figure 12 [265]. Among many factors that could affect the material removal rate and surface quality in CMP, the mechanical interaction between the nanoparticles and the wafer surface plays a critical role. For the material removal process, two models have been proposed to understand the mechanical behaviours of abrasive nanoparticles in CMP, i.e. the hydrodynamic model and the solid contact model [266, 267].

Figure 12. Schematic illustration of the CMP tool and the contact among wafer, pad asperity and abrasive particles during the CMP process [265].
Download figure:
Standard image High-resolution image- (1)In the hydrodynamic model, the wafer and the polishing pad are separated by a thin liquid film; the material removal is primarily due to the collision of abrasive nanoparticles onto the wafer, or the fluidic shearing. The effects of the particle size, the incidence speed and angles etc on the collision between nanoparticles and the wafer surface have been investigated [214, 224, 268, 269]. Xu et al [224] designed an experiment based on a fluorescent microscope system where fluorescent nanoparticles adsorbed on a glass surface were exposed to the vertical impact of a liquid with 15 wt% abrasive nanoparticles. The results suggested that the collision between the abrasives and the wafer surface had a negligible effect on the material removal at a liquid impact speed of 3 m s−1. When the impacting speed was increased and the nanoparticle incidence angle was changed, damage to the wafer surface could occur. For instance, there were many pits and scratches on the surface on the wafer surface under a speed of 50 m s−1 and an incidence angle of 45°; heavy and heterogeneous deformation in the surface layer was observed with the high-resolution TEM [214], as shown in figure 13. MD simulation studies on the collision process of a nanoparticle onto a silicon or silica surface suggested the damage could be increasingly reduced with the increasing incident angle [269–271]. Moreover, the critical velocity for the pileup formation on the silicon surface is affected by the incidence angle rather than the particle size [270].
- (2)In the solid contact model, part of the polishing pad is in direct contact with the wafer surface [272, 273]. The particles embedded in the pad slide against the substrate surface, in a similar way to fixed abrasive grinding (referred to as fixed particles). The particles immersed in the slurry between the pad and the wafer can be referred to as free particles. Lei et al [225] used a fluorescence based experimental system to track the movement of individual particles between the polishing pad and the solid surface. The results confirmed that some particles were fixed on the polishing pad and rotated with the pad, while the others moved freely in the slurry flow. Paul et al [274] proposed that the ratio of the number of fixed particles and that of free particles was of great importance to the material removal mode. In regard to this model, it has been widely accepted that the material removal is due to the two-body abrasion between the polishing pad and the wafer surface, as well as that between nanoparticles and the wafer surface [266, 267, 275–277]. Nevertheless, increasing evidence shows that the rolling of free nanoparticles in the slurry is not notably inferior to abrasive sliding for the material removal and surface finish on the atomic scale in the CMP process [265, 278]; a typical MD simulation result is shown in figure 14.

Figure 13. (a) AFM image of the surface after a 10 min exposure; (b) cross-section high-resolution TEM images of the specimen subsurface after exposure [214].
Download figure:
Standard image High-resolution image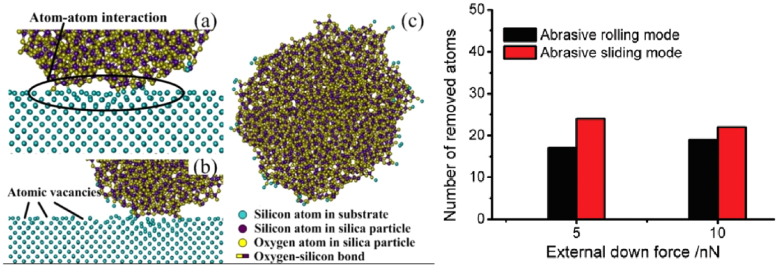
Figure 14. The rolling process of a silica particle under an external down force of 5 nN and a lateral driving force of 10 nN (left); The number of removed atoms against various external down forces with abrasive rolling and abrasive sliding (right) [265].
Download figure:
Standard image High-resolution imageAnother important aspect is understanding the adhesion and the removal of nanoparticles on the wafer surface; this is a relevant problem in the post-CMP cleaning process [279]. Interfacial forces, such as the vdW force, electrostatic force and capillary force in the vicinity of the nanoparticle and the wafer surface dominate the adhesion process [280]. Many experimental factors could influence the adhesion strength between the particle and the wafer surface, as the following list demonstrates.
- (1)The adhesion could increase with the contact time, since the contact area and then the interfacial forces increase as time progresses [281].
- (2)Large atmospheric humidity could accelerate the adhesion formation [282].
- (3)The size effect of nanoparticles on the adhesion strength has been a research focus and some contradictory results have been obtained. Heim et al [170] found that the relationship between microparticle/wafer surface adhesion and the particle radius agreed with the prediction of contact theories. On the contrary, the results obtained by Thoreson et al suggested that no size effect of the particle/wafer surface adhesion could be observed [283]. This trend was also confirmed by the experiments conducted by Lei et al [225], in which a series of heat-treated AFM probes with various curvature radii were employed to measure the particle/wafer surface adhesion. This result might be as a result of the reduction of the real contact area caused by asperities on the tip surface [284].
- (4)In addition, the influence of capillary force should be also considered, since small particles could aggregate to form larger ones [43].
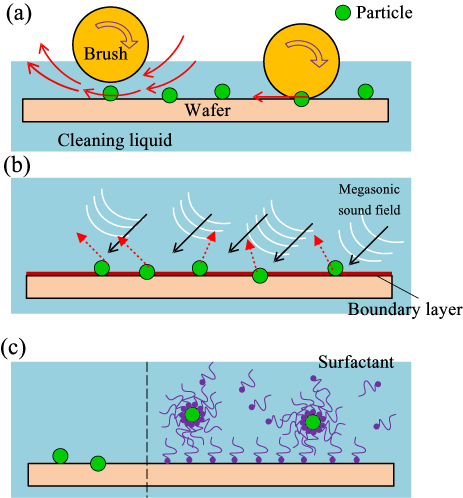
After nanoparticles are adsorbed onto the wafer surface due to the action of interfacial forces, they could be embedded in the surface by pad pressure if valleys or asperities are present on the surface [285]. In this case, the number of residue nanoparticles on the wafer surface after the CMP process could reduce when the wafer surface hardness increases [286]. These residue nanoparticles should be removed during the post-CMP cleaning process to avoid their unfavourable effects on the follow-up processes [287]. Applying external mechanical stimuli, megasonic cleaning as well as some wet chemical effects are optional ways to overcome the adhesion force and remove physisorbed (in some cases chemisorbed) or partially embedded nanoparticles, as schematically shown in figure 15.
Figure 15. Basic schematic models of typical post-CMP cleaning of nanoparticles: (a) brush–particle mechanical interaction; (b) megasonic cleaning; (c) chemical additive (surfactant).
Download figure:
Standard image High-resolution image
The mechanical removal forces are very complex, mainly including the contact elastic force, the hydrodynamic drag force and the friction between a brush and nanoparticles, etc [288, 289]. A schematic description of all the forces for a nanoparticle on the surface in the cleaning process was put forward by Huang et al [290]. Furthermore, contact models and lubrication hydrodynamic theories were employed to analyse the fluid flow field and calculate the hydrodynamic drag force, as well as the surface roughness and the characteristics of the brush nodules were considered [291].
The mechanical brush scrubbing method is very efficient for removing residue particles; however, it becomes less effective when the particle size is very small, e.g., a nanoparticle. In this case, megasonic cleaning and chemically-activated removal could be adopted. Megasonic cleaning is to utilize a sound field with a frequency of typically 0.8–2 MHz to excite controlled cavitation, which is gentler and on a much smaller scale than that produced under ultrasonic cleaning. Increases in the megasonic frequency, the cleaning period and the solution temperature etc could improve the cleaning effects [292–295]. Nevertheless, this cleaning method has some problems, e.g., the instability of the sound field for cleaning large size wafers and low cleaning efficiency. The basic idea of the chemically-activated removal, i.e. using a chemical additive, is to weaken the bonds between particles [296] or to change the charges on the wafer surface and the particles (alter the solution pH [297, 298] or add surfactants [299]) for controlling the electrostatic repulsion between the particles and the wafer surface.
5.3. Nanoparticles in coatings
Incorporating different kinds of nanoparticles within a metal or polymer matrix to produce nanocomposites can deliver improved properties, such as enhanced mechanical properties, self-lubrication, wear-resistance and energy-absorbing capabilities [300]. A few examples demonstrating the influence of nanoparticles on the mechanical (hardness, elastic modulus as well as tensile strengths etc) and tribological properties of nanocomposite coatings are shown in table 5. There are two main categories of nanocomposites, which are summarized as follows.
- (1)Due to some of the inherent properties of the matrix, for instance the high strength and modulus, wear resistance and high thermal and electrical conductivity, metal or metal alloy matrix composite coatings show distinct advantages over polymeric composites [315]. In these coatings, ceramic (Al2O3 [301, 304, 306], TiO2 [305], SiC [307, 308]) and carbon-based (graphite [316] and CNTs [317]) nanoparticles are usually added. There are three reasons why ceramic particles are used as reinforcement to enhance the hardness and the wear-resistance of composites:
- the high hardness and strength of particles [306, 308]
- migration and dislocation motion of grain boundaries can be prevented by the particles in the matrix [304]
- heterogeneous nucleation effect of particles in metal or metal alloys [308].
- (2)Modification of the physical properties of a polymer matrix can be achieved by adding inorganic or organic nanoparticles, causing some new characteristics of polymers to be obtained [318]. For example, polymer composite coatings containing some inorganic nanoparticles can provide resistance to the initiation and propagation of cracks, fill cavities and initiate crack bridging, deflection and bowing [319]. Basically, the mechanical properties of polymer based nanocomposites can be affected by many factors, among which the interface between the nanoparticle and the polymer matrix plays a dominant role due to the large specific surface area of the particle [310, 318]. Hence, a good design of a nanocomposite, by taking the complex interplay between matrix, interface and nanoparticles into consideration, could tailor the composite material system with desirable physical properties. Several underlying mechanisms responsible for the interface reinforcement are:
- (1)the interaction between nanoparticles and the polymer matrix could result in the formation of special microstructures (for instance, a finer scale lamellar structure), correspondingly the improved mechanical properties could prevent rapid crack propagation in the coating [320];
- (2)nanoparticles could enhance their interaction with the matrix through chemical bonds (for example, increase the cross-linking densities in the coatings) or increase the physical interactions between macromolecular chains of the matrix [313, 314, 321]. In this manner, effective pathways could be provided for nanoparticles to complement the poor mechanical and tribological performances of some polymer matrices, e.g., their poor resistance to surface abrasion and wear [319].
Table 5. Summary of the mechanical properties of some nanocomposite coatings.
| Nanoparticle/matrix | Increased hardness (H) or modulus (M) | Maximum tensile(T) or flexural (F) strength | Friction coefficient (COF)/wear rate(WR) | Optimum particle concentration | Particle size (nm) | |
|---|---|---|---|---|---|---|
| Metal matrix | Al2O3 [301], AlN [302], MgO [303]/Al or Al alloy | (H)68.4 HRF(115%) [301] | (T) 250 MPa (67%) [301] | 4–7 vol% [301, 303] 39 vol% [302] | 40–80 | |
| (H)1.59 GPa (50%) (M)140 GPa (56%) [302] | Compressive strength 288 MPa(164%) [303] | |||||
| Al2O3/Ni-W [304] TiO2/Ni [305] | (H)8.5 GPa (31%) [304] (H)400 HV (23%) [305] | 1460 MPa (1180%), residual stresses [304] | −(50–75)% [303]; −40% (WR) [305] | 5–7 wt% [304] 12 g l−1 [305] | 30–90 | |
| (WC, ZrO2, Al2O3, and Si3N4)/(Co or Fe) [306] | (H) increase by 5–16 HRB | bending strength increase by 54% | −(50–90)% (WR), −75% (COF) | 2–6 vol% | 10–100 | |
| SiC/Mg alloy [307, 308] | (T) 216 MPa(24%); Yield strength 384 MPa(113%) [308] | 10 vol% [307] 0.5 wt% [308] | ∼20 [307]; 50 [308] | |||
| Nanographite/Cu [309] | (H) 94 HV (31%, 5 vol%) | −23% (COF, 15 vol%), −33% (WR, 15 vol%) | 35 | |||
| Polymer matrix | SiAlON, [310] SiO2 [311]/Epoxy resin | (H) 67(Shore-D, 18%) [310] (M) 60 MPa (−40%) aggregation, 5 wt.% [311] | (T)18 MPa(-44%) aggregation, 5 wt.% [311] | −67% (WR, 3 wt%) [310] | 9–11 wt% [310] | 70 [310] |
| ZnO/polyurethane [12] | (T) 17.83 MPa (108%) | 2 wt% | 27 | |||
| nano-PTFE/Phenol resins [313] | (H)112 HRM (25.8%) | (F)110 MPa (19.6%) | −33%(COF); −61% (WR) | 2–5 wt% | 20–80 | |
| PTFE-MoS2-Al2O3/polyoxymethylene [314] | (H)123 MPa (7%) | (T)52.08 MPa (−7%) | 3 wt% | 10–30 | ||
6. Conclusion and outlook
Increasingly high requirements of the surface and interface properties of many mechanical systems demand new designs and improvements of surface modifications and manufacturing technologies. Nanoparticles exhibiting many unique mechanical properties have become one of the most attractive choices for meeting these needs in the past couple of years. The foregoing parts review basic physics and recent important results of nanoparticles from the perspectives of their mechanical properties and interfacial interactions, as well as related applications. Available fundamental research data regarding the mechanical properties of nanoparticles provide valuable guidance for their effective implementation in surface engineering, micro/nanomanufacturing and nanofabrication etc. Many of these applications with nanoparticles have already made impressive progress in practice and exhibited significant advantages in many fields.
Despite these, further works are still needed to acquire information on the mechanical properties of more kinds of nanoparticles with the advances of convenient characterization techniques and mature nanoparticle production technologies. Quantitative descriptions of the mechanical properties of nanoparticles in relation to the size dependent and material effects etc should be also made. Additionally, how to achieve a much clearer picture about the roles of nanoparticles in their specific applications is of great significance. Hence, direct visualizations of the interfacial behaviour of nanoparticles in applications on the micro-/nano- and even atomic scales would be very helpful.
Acknowledgments
The authors gratefully acknowledge the support of NSFC (Nos 51375255, 51027007 and 51105221), the International Science & Technology Cooperation Project (No 2011DFA70980) and the National Key Basic Research Program of China (Grant No 2011CB013102).