
Abstract
In this paper we present results of measurements and global modelling of low-pressure inductively coupled H2 plasma which is suitable for surface cleaning applications. The plasma is ignited at 1 Pa in a helicon-type reactor and is characterized using optical emission measurements (optical actinometry) and electrical measurements, namely Langmuir and catalytic probe. By comparing catalytic probe data obtained at the centre of the chamber with optical actinometry results, an approximate calibration of the actinometry method as a semi-quantititative measure of H density was achieved. Coefficients for conversion of actinometric ratios to H densities are tabulated and provided. The approximate validity region of the simple actinometry formula for low-pressure H2 plasma is discussed in the online supplementary data (stacks.iop.org/JPhysD/46/475206/mmedia). Best agreement with catalytic probe results was obtained for (Hβ, Ar750) and (Hβ, Ar811) actinometric line pairs. Additionally, concentrations of electrons and ions as well as plasma potential, electron temperature and ion fluxes were measured in the chamber centre at different plasma powers using a Langmuir probe. Moreover, a global model of an inductively coupled plasma was formulated using a compiled reaction set for H2/Ar gas mixture. The model results compared reasonably well with the results on H atom and charge particle densities and a sensitivity analysis of important input parameters was conducted. The influence of the surface recombination, ionization, and dissociation coefficients, and the ion–neutral collision cross-section on model results was demonstrated.
Export citation and abstract BibTeX RIS
1. Introduction
Radio-frequency plasmas in molecular gases at low pressures have been used for many technological applications such as etching [1], deposition [2, 3], microelectronics fabrication [4, 5] and many others [6, 7]. The majority of etching applications have employed plasmas as tools for anisotropic etching [8, 9]. However, recent investigations have looked into isotropic etching, since this process is important, when it comes to understanding dust formation and removal in fusion devices [10], and cleaning of different contamination layers formed on various types of optical elements [11]. The latter application is usually connected to optical elements used in synchrotrons [12] and extreme ultraviolet lithography (EUVL) tools [13], where the main threats to optics efficiency are carbon contamination and oxidation on the surfaces. As a remedy for optics efficiency degradation, cleaning in O2 plasmas was often used [14]. Although efficient, this treatment may cause oxidation and roughening of multilayer mirrors producing non-recoverable damage of the optics. Thus, several investigators have recently studied the possibility of carbon contamination removal in H2 RF plasmas [13, 15–18] or only in atomic H environment [17]. The carbon layer was removed from the surfaces almost without any change of surface properties, with H atoms playing an important role in the removal [11]. Therefore, H2 plasmas appear to be good candidates for cleaning applications.
When it comes to cleaning applications, important issues for the use of plasma process are cost, availability and safety. Since H2 plasma can be ignited in all RF plasma sources, generally used for material treatment, and since the pressure is low (up to a few Pa) these three issues can be satisfied. Nevertheless, in order to compare processes done in different reactors and understand mechanisms taking place at the surfaces, complete characterization of the plasma should be performed. Knowledge of plasma parameters becomes even more necessary when it comes to comparing surface treatments in plasmas generated in different ways, e.g. in the case of laser-induced plasmas, which can be produced inside lithography tools permitting in situ optics cleaning.
As a first step in a wider investigation of hydrogen plasmas for processing of materials, we performed here characterization of H2 plasmas in the diffusion region of a helicon reactor (Adixen Micromachining Etching Tool–MET), where samples are positioned [7]. Several experimental techniques have been used in order to characterize the discharge: (a) electron and ion density, electron temperature, plasma potential and ion flux have been measured with commercial RF compensated Langmuir probe (ESPion HIDEN). Since this is considered as one of the simplest measurement techniques, its application in various types of discharges and its theory are extensively studied and given in details by various authors [5, 8, 19–21]. (b) A combination of optical emission spectroscopy with catalytic probes provided real-time monitoring of the neutral atom density with better quantification of the results, and allowed validation of the actinometric technique for H. Indeed, reliable procedures for measuring atomic densities require the combination of two or more diagnostic methods. Mass spectrometry is applicable at low [22, 23] and nowadays even at atmospheric pressure [24] with the addition of differential pumping systems. The method based on chemical titration is reliable, but time consuming, destructive and lacks the capability for real time measurements [25, 26]. Laser-induced fluorescence (LIF), two-photon laser induced fluorescence (TALIF) [27] or cavity ring-down spectroscopy (CRDS) [28] require expensive equipment. Optical emission spectroscopy (OES) is easy to use; it requires inexpensive equipment and allows real time measurements. Nevertheless, it is still regarded semi-qualitative since quantification of the results is difficult [29]. Moreover, in the case of diatomic molecules (H2, O2, Cl2), their atomic optical emission may originate not only from direct atom excitation, but also from dissociative excitation of the parent gas, thus questioning the validity of optical actinometry as a measure of atomic density [30, 31]. Another very simple quantitative method for obtaining atom densities is the use of catalytic probes, which were so far successfully employed in various types of discharges [32–35]. Therefore, in this case, a combination of OES with catalytic probes was used.
This paper is organized as follows: first, we describe the plasma chamber and diagnostics used. After that, an overview of a compiled reaction set used in the global model is given. In continuation, a comparison between densities of hydrogen atoms obtained from optical actinometry calculations and catalytic probe measurements is presented and the validity of the actinometric method is discussed. Finally, measurements of plasma parameters obtained by Langmuir and catalytic probes are given and compared to global modelling results in order to validate the model. The critical role of surface recombination coefficient of H atoms, and other parameters is discussed in a sensitivity analysis.
2. Experimental setup
The plasma processing system investigated is a helicon-type micromachining etching tool (MET) from Adixen-Alcatel. The etcher consists of two chambers: the upper part is the plasma generation region with a quartz cylinder 26 cm high and 17.5 cm in diameter surrounded by one-turn coil-antenna. Below the plasma generation chamber is a cylindrical processing region with stainless steel walls 40 cm in diameter and a centrally located sample holder positioned 19 cm beneath the bottom of the generation chamber cylinder, as shown in figure 1. Such a large distance between the production region and the wafer is necessary in order to have a radial uniformity of the plasma in front of the substrate [4]. The plasma generation region is surrounded by an electromagnet producing a constant magnetic field of 1 mT (10 G). Power from a RF 13.56 MHz generator, shown on a power meter built-in the generator, was forwarded to the antenna through a matching box. The plasma produced in this region diffused in the water-cooled processing chamber, which was surrounded by 14 permanent magnets from the outer side with alternating orientation (NS-SN). The rows of magnets generate a magnetic configuration in which the magnetic field strength has a maximum near the magnets and decays with the distance into the chamber [8]. Hence, the measurements of the plasma parameters obtained at the centre of the processing chamber can be considered as measurements in a magnetic field-free plasma volume. Blank aluminum wafer holders (10 cm (4'') in diameter) entered the chamber through a load-lock and were mechanically clamped on the floating sample holder which was cooled with He-backside pressure (the sample holder can be biased with a separate RF source, but this was not done in these experiments). The process chamber was not vented to atmosphere for wafer transport and was kept at base pressure of approximately 5 × 10⁻⁵ mbar.
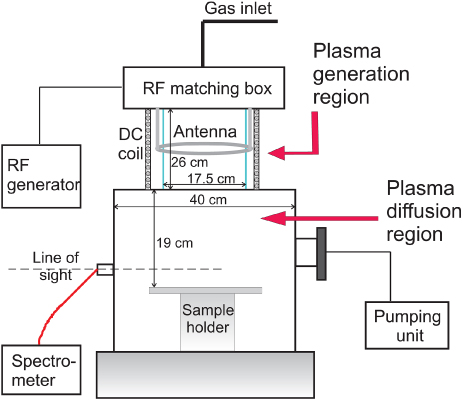
Figure 1. A schematic diagram of the experimental setup.
Download figure:
Standard image High-resolution imagePlasma emission from the processing region was guided through 1 mm thick optical fibre (Ocean Optics UV–VIS fibre 300–1100 nm) with an acceptance angle of 25.4° in air terminated with standard SMA 905 connectors. Next, the light entered an Acton Research Corporation Spectra-Pro 500 monochromator with 0.5 m focal length and a 1200 g mm−1 grating blazed at 750 nm. Light emission at the exit was detected with a thermoelectrically cooled CCD camera (SBIG ST-6I) gated up to 10 s exposure time and connected to a computer for signal detection and processing of obtained spectra. The resolution of the spectrometer used for the measurements is 0.04 nm which was enough for precise determination of different lines in visual spectra from time-integrated recordings.
A single Langmuir probe with passive RF compensation was used for measurement of plasma parameters: electron density (Ne), ion density (Ni), plasma potential (Vp), electron temperature (Te) and ion current (flux) (Ji, Iflux). The probe system consisted of a tungsten probe tip, a high-frequency compensation electrode made of hard anodized aluminum, and a stainless steel reference electrode fastened at a ceramic probe body close to the compensation electrode. It was fastened at one of the side chamber windows with a flange which provided vacuum-tight connection with the chamber.
During all measurements the probe tip was positioned in the centre of the chamber, 5 cm above the sample holder. This position for the probe was chosen so that the point of collecting data for ion and electron concentration would be as close as possible to the position where the samples are positioned during treatments, given that in our commercial system the closest to the sample set of windows is 5 cm above the sample holder. We note than in large-volume diffusion chambers, such as the one used in the experiment, a non-equilibrium plasma formed at low pressures in the source (upstream) is homogeneous enough in a down-stream region, a fact verified by almost constant etching rates at different sample height and diameter. The probe tip dimensions were 10 mm in length and 0.15 mm in diameter. Measured impedance of the probe was 6 Ω. The voltage-sampling interval was set from −40 to 90 V with a step of 0.1 V. Prior to each scan the probe was cleaned in situ by applying a voltage of −40 V for a period of 200 ms. For a particular set of plasma parameters, the current–voltage (I–V) characteristic was obtained by averaging 20 scans. Recording of the characteristics, storing and data processing was done by using the Hiden Analytical software ESPsoft. The theory of Langmuir probes and approaches for data processing have been described in detail elsewhere [5, 20].
For measurement of the concentrations of hydrogen atoms, a catalytic probe was employed. Details about probe design and operation are given elsewhere [26, 36]. Gold was used as catalytic material, since it has a high and stable recombination coefficient for the surface recombination of H atoms. Change of the thermocouple voltage versus time was monitored with a voltmeter connected to a computer. The probe was introduced into the processing chamber using a leak-proof flare-through flange on one of the side windows and positioned in such a way that the tip was at the chamber centre, a few centimeters above the bottom electrode close to the position where usually a sample is placed.
The plasma was ignited at the pressure of 1 Pa. All measurements except actinometry were done in pure H2 (5.5 purity) with a gas flow of 50 sccm (standard cubic centimeters). For actinometry measurements, 5% of Ar (purity of 5.0) was added keeping the total pressure at 1 Pa by slightly opening the chamber valve. Due to the low sensitivity of the built-in flow meters we were not able to use less than 5% of argon in the admixtures. Adding Ar to H2 plasma may result in the appearance of another dissociation channel that influences broadening of line wings, and can also lead to an increase of the overall number of excited hydrogen. However, these effects are pronounced for Ar admixtures larger than 5% [37]. Furthermore, addition of Ar leads to quenching of hydrogen states excited in plasma, but this effect is not significant at low pressures [38]. The forward powers measured at the power source used in experiments were 800–1900 W with reflected power that never exceeded 5 W. Before each measurement, reflected power was checked and adjusted to minimum value if necessary.
The data obtained in all the measurements (Langmuir probe, catalytic probe, actinometry) are time-averaged values. Moreover, the actinometry results are also spatially averaged due to the fact that the collection of data was performed along the radial axis of the discharge chamber.
Since the same reactor was used for different kinds of processes involving fluorine (e.g. silicon etching in F- and CFx-containing plasmas), special attention was devoted to clean the chamber from different impurities that may be deposited on the walls. Periodically, after several processing events involving fluorine, the chamber was cleaned in oxygen plasma, for 45 min at 1.5 Pa at high power (1800 W). In the beginning of the cleaning process, immediately after plasma ignition, pressure rose significantly and then its decrease was monitored until stabilization. Additionally, at the beginning of every hydrogen plasma measurement day, the chamber was seasoned with hydrogen plasma at a pressure of 1 Pa and power of 1000 W for 30 min. Very small pressure rise in the beginning and subsequent drop was detected during the period of 30 min cleaning. Hence, during measurements, pressure changes after plasma ignition were negligible. Moreover, spectroscopic scans performed throughout hydrogen cleaning process did not reveal the presence of typical fluorine lines in the plasma.
3. Reaction set for H2 and global model
In order to gain a first estimate on plasma parameters a global model for ICP plasma was used. Details about zero-dimensional global models, previously developed and tested with gases C4F8 and SF6, can be found in earlier publications [39, 40]. This model was supplied with sets of gas phase (homogeneous) reactions as well as surface (heterogeneous) reactions for hydrogen and argon. Based on these data sets the mass balances of charged and neutral species in the gas phase, the mass balances of the species on the surface and the power balance are formulated averaged in space and at the steady state. The equation set is complemented with the charge neutrality equation. In order to solve the aforementioned equation set, the temperature of the gas (Tg) and the ion temperature (Ti) ought to be defined. In our case we assumed that Tg is equal to 315 K, which is slightly higher than the temperature of the walls. Generally speaking, there could be an increase in the gas temperature due to elastic collisions between electrons and gas molecules [41]. At low pressures this effect would appear during prolonged plasma operation. Nevertheless, for all measurements plasma-on time did not exceed 5 min, and as a result this increase was considered small enough to be neglected. Ion temperature is calculated by the empirical equation proposed by Lee and Liebermann [42]. Other input parameters for the model are reactor dimensions, gas pressure and flow and power forwarded to the plasma. The model calculates all densities of species in the plasma and the electron temperature.
The set of gas phase (homogeneous) reactions in hydrogen and argon used in the model is given in table 1. For a particular reaction considered in the model, its threshold energy and the reference used are given as well. Reactions were compiled following already well-established models of low-temperature hydrogen plasmas [43, 44] and recommendations from the literature [45]. However, attention was also paid to taking into account only the most probable reactions in order to construct a model that will realistically describe the plasma with particular parameters, but with a reasonable number of reactions included. Test runs of the model with negative ions included proved that changes in concentrations of particles were negligible compared to the case without negative ions, since the probability for these reactions is low [46]. Therefore, channels of creation and recombination of negative ions were not included in the reaction set. Reaction rate coefficients for the model were derived assuming Maxwell distribution of electron energy using the software Bolsig+ [47] and cross-sections included therein or using other cross-sections from the literature (data sources shown in table 1). In addition, electron excitation of species to radiative states, except in the case of metastables, is treated only as an energy loss, i.e. no mass balances for excited state species are considered in the model. For the ion–neutral reactions of table 1, the rate coefficients are taken from the literature. Where a cross-section and not a coefficient is given in the literature, they are calculated by multiplying the cross-sections (data sources shown in table 1) with the velocity corresponding to the average ion energy between the bulk and the presheath. Ion temperature in the bulk is calculated to be close to 0.1 eV by the empirical relation [42] proposed by Lee and Liebermann (equation (5) in [40]), while presheath ion energy is half the electron temperature [8].
Table 1. The set of gas phase and surface reactions, threshold energies (Eth), comments (Com.) and sources of data (Ref.) for H2/Ar low-pressure plasma.
| Index | Reaction | Eth (eV) | Com. | Ref. |
|---|---|---|---|---|
| Electrons and H2 | ||||
| Electronic excitation | ||||
| (G1) |
 |
8.9 | a | [47] |
| (G2) |
 |
11.37 | [47] | |
| (G3) | H2 + e → H2(C 1Πu) + e | 12.4 | [47] | |
| (G4) | H2 + e → H2(c 3Πu) + e → 2H + e | 11.75 | a | [47] |
| Vibrational excitation | ||||
| (G5) |
 |
0.52 | [47] | |
| (G6) | H2 + e → H2(v = 2) + e | 1.0 | [47] | |
| (G7) | H2 + e → H2(v = 3) + e | 1.5 | [47] | |
| Dissociative excitation | ||||
| (G8) | H2+e → H(n = 3)+H+e | 16.6 | [51] | |
| Ionization | ||||
| (G9) |
 |
15.4 | [47] | |
| (G10) | H2 + e → H + H+ + 2e | 34.8 | [52] | |
| Elastic | ||||
| (G11) | H2 + e → H2 + e | [47] | ||
Electrons and
 |
||||
| Dissociative ionization | ||||
| (G12) |
 |
4 | b | [53] |
| (G13) |
 |
19.4 | [52] | |
| Dissociative recombination | ||||
| (G14) |
 |
0.01 | [52] | |
Electrons and
 |
||||
| Dissociative excitation | ||||
| (G15) |
 |
14.3 | [52] | |
| Dissociative recombination | ||||
| (G16) |
 |
0.01 | [52] | |
| Electrons and H | ||||
| Ionization | ||||
| (G17) | H + e → H+ + 2e | 13.6 | [52] | |
| Electrons and Ar | ||||
| Electronic excitation | ||||
| (G18) | Ar + e → Ar + e | 11.5 | c | [54] |
| (G19) | Ar + e → Ar(met) + e | 13.08 | d | [55] |
| 13.27 | ||||
| Ionization | ||||
| (G20) | Ar + e → Ar+ + 2e | 15.8 | [47] | |
| Elastic | ||||
| (G21) | Ar + e → Ar + e | [47] | ||
| Metastable quenching | ||||
| (G22) | Ar(met) + e → Ar + e | [47] | ||
| Electrons and heavyparticles | ||||
| Recombination | ||||
| (G23) | ArH+ + e → Ar + H | [54] | ||
| Heavy-particle interaction | ||||
| Proton transfer | ||||
| (G24) |
 |
[43] | ||
| H2 quenching of Ar(met) | ||||
| (G25) | Ar(met) + H2 → Ar + 2 H | [54] | ||
| Ar quenching of Ar(met) | ||||
| (G26) | Ar(met) + Ar → 2Ar | [56] | ||
| Charge transfer | ||||
| (G27) | Ar
 |
[54] | ||
| Proton transfer | ||||
| (G28) | Ar+ + H2 → ArH+ + H | [54] | ||
| Proton transfer | ||||
| (G29) | ArH
 |
[54] | ||
| Momentum transfer | ||||
| (G30) |
 |
[50] | ||
| σ = 8.5 × 10⁻¹⁵ cm2 at 0.1 eV | ||||
| σ = 2.5 × 10⁻¹⁵ cm2 at 1 eV | ||||
| Atom–surface interaction | ||||
| Stainless steel | 0.13 | [49] | ||
| Quartz | 0.003 | [48] | ||
| Realistic case—quartz and stainless steel | ||||
| (weighted by areas) | ||||
| (S1) | H → 1/2 H2 | 0.097 | ||
aExcitation to triple states leads to dissociation [43]. bThreshold for the process established from [52]. cTotal excitation. dStates 2p9 and 2p4 (in paschen notation), respectively.
The set of reactions between gas species and chamber walls (heterogeneous reactions) consists of wall surface recombination of hydrogen atoms and the recombination of hydrogen molecular and atomic ions and Ar ions in collisions with chamber walls. The probability of recombination of atoms on surfaces for the reaction H → 1/2 H2 was important for the agreement of the model results with experimental measurements (see section 4.4 on global model validation). Hence, value of the recombination probability was calculated using the values for quartz [48] and stainless steel [49] weighted by areas of the dome and the processing chamber (all coefficients for atom recombination on surfaces are shown in table 1). The rate coefficient for the loss of an ion in a surface reaction (see equation (9) in [40]) is analogous to the Bohm velocity and to a factor h; a different factor h is calculated for each wall surface of the reactor. h is the ratio of the sheath edge density to the average bulk density of the ion and depends [42] on several quantities (see equations (13) and (14) in [42]): the ratio of negative ion density to electron density, the ratio of the ion to electron temperature, the dimensions of the reactor, the Bohm velocity, the ambipolar diffusion coefficient, and the mean free path of ions. The mean free path is inversely proportional to the total ion–neutral cross-section. This total cross-section is required for the calculations of the global model and affects strongly the factor h, and as a consequence the loss of ions at the wall surfaces. For that cross-section, a value corresponding to the collision cross-section between
ions (that are dominant ions) and H2 neutrals is considered at the ion energy of 1 eV [50].
4. Results and discussion
4.1. Emission spectroscopy of a hydrogen plasma
A typical spectrum from a H2/Ar plasma recorded in a wide range of wavelengths is shown in figure 2. Some hydrogen and argon lines are designated in the plot: lines from different transitions in atomic H and Ar and Fulcher α bands of lines coming from electronic transitions in H2 molecule.
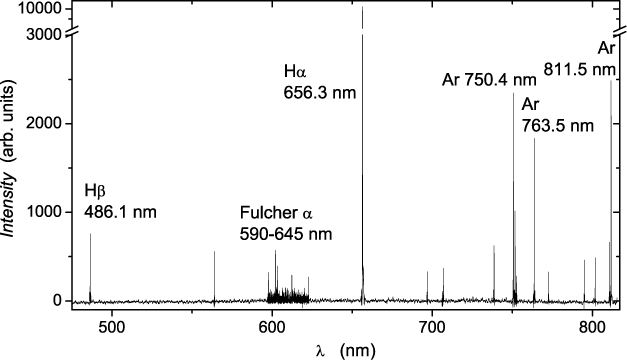
Figure 2. Spectra of a H2/Ar plasma at 1 Pa recorded at 1200 W. Line intensities are relatively scaled.
Download figure:
Standard image High-resolution imageIn figure 3 the variation of maximal intensity of four lines from optical emission spectra with power is shown. Two lines of atomic hydrogen: Hα—656.3 nm and Hβ—486.1 nm and two Ar lines: 750.4 nm and 811.5 nm all show increase in peak values with power increase. At powers higher than 1400–1600 W, when electron energies increase (see supporting data for electron temperature) Hα line exhibits larger increase in intensity compared to other lines. This is due to the fact that direct and dissociative excitation cross-section of this line is higher compared to other lines, and in addition the cross-section increases with increasing energy. The intensities of these lines were used for actinometric calculations.
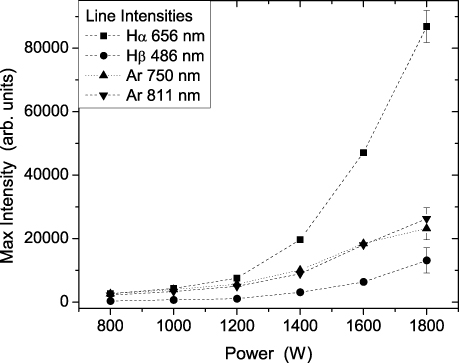
Figure 3. Maximal intensities of Hα, Hβ, Ar-750 and Ar-811 lines in H2/Ar plasma at 1 Pa versus power. Line intensities are relatively scaled so that they can be compared.
Download figure:
Standard image High-resolution image4.2. Densities and the dissociation degree of hydrogen
The degree of dissociation of molecular hydrogen is a very important parameter in H2 and H2-containing low-temperature plasmas for understanding surface processes. For hydrogen, when an initial concentration of hydrogen molecules
 dissociates into a certain concentration of hydrogen atoms NH, the dissociation degree x can be expressed as

Actinometry is one of the emission spectroscopy methods which relate the relative concentrations of two ground state atom species in the plasma with their emission intensity measurements. The method requires an addition of a small amount of noble gas (actinometer) in the feed gas and subsequent observation of lines belonging to the de-excitation transitions in atoms of both gases. The method proved to be an effective diagnostic technique to measure the densities of the various species [57–62] under conditions that fulfil the following assumptions: (i) the addition of a known small amount of an actinometer, A (Ar or other noble gas) should not affect the emissions of the feed gas atomic species G; (ii) the monitored optical emission should originate from excited states of the actinometer and the atomic species, A* and G*, which are dominantly produced through direct electron-impact excitation from ground states; (iii) the excitation cross-sections of A* and G* should have similar threshold energies and similar shapes as a function of energy; and (iv) the loss of A* and G* species should be dominated by radiative processes. Condition (iii) actually underlines that the same group of electrons in the electron energy distribution will take part in the excitation of A and G radiative states, making the method independent of the energy distribution function. Except in few cases [59, 61], these conditions prove to be over limiting since they neglect many processes such as cascading processes from higher excited states, dissociative excitation, collisions between heavy particles and quenching.
Particularly, in the case of H2 plasmas, conditions (ii) and (iv) are not fulfilled. Detailed analysis of the kinetics of hydrogen excited species [31, 37] showed that in many conditions one has to include electron-impact dissociation of hydrogen molecules as an origin of excited H atoms and, at pressures higher than 100 Pa, the quenching of excited states by other species [38]. In the case of Ar lines, apart from direct excitation from a ground level, excitation of upper levels may be achieved through a metastable state [31]. However, at the low pressures used in this work the density of Ar metastables is a few orders of magnitude lower than the density of Ar atoms, allowing one to disregard this excitation channel. All reactions taken into account for the actinometry are summarized in table 2. One should note that the reactions and corresponding cross-section data in table 2 consider electron-impact excitation to a particular level, while the reactions used in the global model (table 1) do not consider excited states. The rate coefficients used in all calculations were obtained by taking into account the cross-sections for the direct and dissociative excitation for Hα, Hβ taken from Lavrov and Pipa [63] and direct excitation for Ar lines using a set of Hayashi cross-sections [55] and calculated using Maxwell electron energy distribution function with mean electron energy obtained from Langmuir probe measurements.
Table 2. Processes occurring in H2/Ar low-pressure plasmas used for actinometry calculations. The reference data is given in the far right column.
| Process | Eth (eV) | Rate coef. at 3 eV (10−18 m3 s−1) | Ref. | |||
|---|---|---|---|---|---|---|
| 1a | H atom excitation | H(n = 1) + e → H(n = 3) + e | 12.09 |
 |
41.4 | [63] |
| 1b | H(n = 1) + e → H(n = 4) + e | 12.75 | 8.86 | |||
| 2 | H2 dissociative excitation | H2 + e → H(n = 3) + H(n = 1) + e | 16.57 |
 |
0.53 | [63] |
| H2 + e → H(n = 4) + H(n = 1) + e | 17.23 | 0.01 | ||||
| 3 | Ar direct excitation | Ar(3p) + e → Ar(4p'[1/2]0) + e | 13.48 |
 |
10.7 | [55] |
| Ar(3p) + e → Ar(4p[5/2]3) + e | 13.08 | 11.2 | ||||
| 4 | Radiative de-excitation | Aij (106 s−1) | ∑ Aij | |||
| 4a | H(n = 3) → H(n = 2) + hv (Hα − 656 nm) | 44.1 | 99.8 | [64] | ||
| H(n = 4) → H(n = 2) + hv (Hβ − 486 nm) | 8.4 | 30.2 | ||||
| 4b | Ar(4p'[1/2]0) → Ar(4s) + hv (750 nm) | 44.5 | 44.7 | [64] | ||
| Ar(4p[5/2]3) → Ar(4s) + hv (811 nm) | 33.1 | 33.1 | ||||
From the reactions in the table 2, balance equations for atomic H and Ar excited species (Hj and Arp, respectively) can be written and are detailed in the online supplementary data section S1 (stacks.iop.org/JPhysD/46/475206/mmedia). From these equations and for steady-state plasma, the density ratios of H and Ar can be calculated as:

where
and
Aji and Apq are the spontaneous emission coefficients (in s−1) between j and i states for atomic hydrogen and from p to q for Ar. λH and λAr are the emission wavelengths corresponding to these two transitions and C(λx) is the total optical detection efficiency of the spectroscopic system at λx.
Formula (2) shows a relation which links the line emission intensity ratio to the concentration ratios of atomic hydrogen and actinometer. Ds is the ratio of dissociative to direct excitation and the factor (1+Ds) modifies the 'classical' actinometry formula by adding an electron-impact dissociation contributon. Rearranging formula (2) in the way that can fit expression (1), the dissociation degree of hydrogen can be obtained

and thus the H densities.
The density of hydrogen atoms in the chamber centre was also determined using a catalytic probe, from the time dependence of temperature recorded from a thermocouple located at the probe tip and merged to catalytic material. Namely, after plasma ignition the thermocouple registers a temperature increase until it saturates at some constant value. Indeed, due to extensive recombination of hydrogen atoms at the surface of the catalyst, energy dissipation of the reaction (heating term) makes the recorded temperature above the ambient temperature. A typical temperature curve is shown in the online supplementary data (see figure S2 (stacks.iop.org/JPhysD/46/475206/mmedia)). The temperature saturates when the contribution of heating and cooling terms become equal [26]. Immediately after turning the plasma off, the catalytic material of the probe starts to cool down, the temperature drops and dT/dt describes the cooling term. The full physical formalism and precision of the method is discussed elsewhere [65, 66], while details of the calculation are described in the online supplementary data section S3 (stacks.iop.org/JPhysD/46/475206/mmedia). The result of the calculation is an equation for the density of H atoms obtained by equating the heating and the cooling terms at the dropping edge of the temperature curve:

where v is the average thermal velocity of H atoms at room temperature (2520 m s−1), WD is 7.24 × 10⁻¹⁹ J or 4.52 eV. γcat is assumed to be constant and equal to 0.18. The probe area A was 21 mm2, mass m was 0.0203 g and the specific heat capacity Cp of gold is 130 J kg−1 K−1.
In figure 4, densities of H atom in the centre of the reactor for different powers measured with the catalytic probe are shown (green diamonds). Together with probe measurements, absolute atom densities calculated from actinometry are also plotted (squares and circles). Calculations were performed using the constants shown in table 2, electron temperature of 3 eV measured with a Langmuir probe (see section 4.3) and assuming a gas temperature of Tg = 315 K. In figure 4(a) calculations were performed employing formula (3), while results in figure 4(b) are obtained using the 'classical' actinomery formula, disregarding the dissociation contribution term Ds in equation (2). The densities were calculated using four different actinometric line pairs: (Hα, Ar750), (Hα, Ar811), (Hβ, Ar750) and (Hβ, Ar811). All results show an increase of the density of atomic hydrogen with power. In the case of actinometry including Ds term, comparisons show very good agreement of probe measurements with actinometric results using (Hβ, Ar750) and (Hβ, Ar811) line pairs, while calculations with (Hα, Ar750) and (Hα, Ar811) pairs produced values which are about three times lower than probe measurements.

Figure 4. Measurements of H atom densities using a catalytic probe (diamonds) and optical actinometry employing different ratios of lines: (Hα, Ar750) (blue squares), (Hα, Ar811) (red squares), (Hβ, Ar750) (blue circles) and (Hβ, Ar811) (red circles). (a) shows results using a complete actinometry formula taking into account dissociative ionization (e.g. see equation (3)). (b) shows the results from 'classical actinometry' (i.e. neglecting the dissociation term see equation (2) with Ds neglected, i.e. Ds < 0.1). Catalytic measurements were done at hydrogen pressure of 1 Pa, and flowrate 50 sccm, while for actinometry measurements 5% of Ar (2.5 sccm) was added at constant pressure.
Download figure:
Standard image High-resolution imageSimilar results are also observed for the classical actinometry formula (with Ds = 0), with values only slightly increased at low powers (where the Ds term is larger). The accuracy of the catalytic probe is typically about 30%. The actinometric measurements have an accuracy of 15%. The discrepancy between the (Hβ, Ar750), (Hβ, Ar811) and the catalytic probe results falls within the accuracy of both techniques.
The discrepancy in actinometry results obtained with different line pair has been noticed before [67], and it may come from atomic data differences (i.e. cross-sections and/or transition constants) [37] or from the fact that the excited levels are not populated only by direct electron-impact from the ground state [67]. Moreover, when threshold energy for an excitation process lies in the tail of an electron energy distribution function, differences in threshold energies become important since different electron groups take part in the excitation processes of hydrogen and Ar. This may be the reason for better agreement of the catalytic probe data with actinometry calculations with Hβ line, since the difference in threshold energies between hydrogen and argon is smaller in this case (see table 2). Anyhow, small differences between results obtained from the formula including the dissociation term and the one without it, show that in this case the dissociation contribution can be neglected. Despite the differences between absolute values coming from the actinometry and experimental measurements, all data obtained with the actinometric method have the same tendency as the results from the catalytic probe. However, since H densities in actinometry are obtained from integrated line intensities along the full diameter of the chamber and the catalytic probe is collecting atoms from the one point, at the centre of the chamber 5 cm above the wafer holder, some disagreement could be expected.
In order to evaluate the approximate limits of validity of actinometry for all combination of line pairs used, an analysis of actinometric formula (equation (3)) was performed and is presented in the online supplementary data section S2 (stacks.iop.org/JPhysD/46/475206/mmedia). For the Hα line, the dissociation term can be neglected (i.e. Ds ⩽ 0.1) for density ratios larger than 5% (dissociation > ∼2.5%) for any electron temperature (figure S1a (stacks.iop.org/JPhysD/46/475206/mmedia)). In the case of Hβ line, neglecting the term Ds (i.e. Ds ⩽ 0.1) is justified only for electron temperatures lower than 3 eV and density ratios larger than 10% (dissociation > ∼5%) (figure S1b (stacks.iop.org/JPhysD/46/475206/mmedia)). Nevertheless, for our experiments it seems that even for Hβ line it is safe to neglect dissociative excitation except at low powers (below 1200 W see figure 4). Since Hβ lines better compare with experiments if the conditions discussed above and detailed in the online supplementary data are met, it is best to use the Hβ line.
Finally, in table 3 we present values of the actinometric conversion coefficient, i.e. the coefficient to convert intensity ratios to density ratios in the case of 'classical actinometry' for several electron temperatures. Using the conversion coefficient allows simple conversion of actinometric line intensity ratio to absolute H density, assuming that the dissociation term can be neglected. Additionally, spectrometric constants of the system used in our experiment and ratios of atomic transition probabilities are also given. Spectral efficiency constants are obtained using a standard calibration lamp. Rate coefficients entering (3) are calculated using reference data given in table 2 and assuming a Maxwellian energy distribution of electrons. It is hoped that this table can be of use to people doing H actinometry as an approximate semi-quantitative guide to convert actinometric data to densities.
Table 3. Coefficients used for actinometric calculations.
| Actinometry ratio used | λ-involved (nm) | Detector response ratio in our system | Ratio of A coefficients | γ | Actinometric conversion coefficient
 to convert intensity to concentration ratio of NH/NAr. to convert intensity to concentration ratio of NH/NAr. |
|||||
|---|---|---|---|---|---|---|---|---|---|---|
| 2 eV | 2.5 | 3 eV | 3.5 | 4 eV | 4.5 | |||||
| Hα/Ar750 | 656/750 | 0.7 | 2.2 | 1.4 | 0.25 | 0.31 | 0.36 | 0.41 | 0.44 | 0.48 |
| Hα/Ar811 | 656/811 | 0.4 | 2.3 | 0.8 | 0.19 | 0.20 | 0.22 | 0.22 | 0.23 | 0.23 |
| Hβ/Ar750 | 486/750 | 1.7 | 3.6 | 3.9 | 3.55 | 4.16 | 4.70 | 5.19 | 5.60 | 5.99 |
| Hβ/Ar811 | 486/811 | 1.1 | 3.6 | 2.2 | 2.62 | 2.71 | 2.78 | 2.83 | 2.85 | 2.87 |
4.3. Densities of electrons and ions, plasma potential and ion flux
We used a cylindrical Langmuir probe to measure the I–V characteristics of the plasma and extract the ion and electron saturation current, the plasma potential, the electron temperature and ion flux using the ESPion software [68].
In figure 5, in the left hand-side axis, the change in densities of electrons and ions for different powers forwarded to plasma is presented. Measured densities exhibit slow increase towards higher powers, with nearly parallel slopes. However, for powers higher than 1600 W electron density seems to saturate and slightly decrease, while ion density continues to increase. Measured electron densities are in the range 0.4–0.7 × 10¹⁶ m−3 and measured ion densities are 2–4 times higher ((0.9–1.7) × 1016 m−3) depending on the power forwarded to the plasma. One has to take into account the fact that determination of the ion densities by using ion saturation current can lead to errors that could easily go up to 20–30% [5].

Figure 5. Electron and ion densities (left hand-side axis) and plasma potential (right hand-side axis) in H2 plasma at 1 Pa at different powers.
Download figure:
Standard image High-resolution imageMeasurements of plasma potential are shown in figure 5, in the right hand-side axis. For powers below 1700 W, the potential in the centre of the chamber shows almost no change with power, staying around 29 V. At higher powers Vp rises up to 32 V. At the same time measured electron temperature at the centre of the chamber is almost constant (3 eV) up to 1700 W of forwarded power, when it increases and reaches 4.5 eV at the maximum power of 1900 W (see figure S3 in the supplementary data (stacks.iop.org/JPhysD/46/475206/mmedia)). At the same time, for the same powers, there is a decrease in electron density. Sudit and Chen [69] stated that mean electron energy and density of electrons are coupled (in order to have constant pressure (NekTe)). The coupling of these two values can be seen also in our case.
The increase in the mean electron energy for the higher powers is also consistent with the increase of the Hα and Hβ line intensities (figure 3) as well an increase in hydrogen atom density (figure 4).
The flux of ions at the centre of the chamber is shown in figure 6. In the right axis, values of ion current density values are presented. The flux rises with an increase in power, as expected.

Figure 6. Change of ion flux (left axis) and ion current density (right axis) with power in H2 plasma at 1 Pa.
Download figure:
Standard image High-resolution imageTherefore,it is evident that all plasma parameters presented (Ni, Vp, Iflux, NH) exhibit similar dependency changes versus RF power.
4.4. Comparison with the global model
The obtained experimental results allowed us to make a comparison with the results from a zero-dimensional (0d), global model, supplied with the gas reaction set for hydrogen and the realistically calculated surface recombination coefficient (section 3). We focus our discussion on the results for the electron temperature (Te), the electron density (Ne), and the density of H (NH).
The electron temperature is calculated 3.58 eV from the global model; it does not change versus power. It is 19% greater than the measured electron temperature for power from 800 to 1700 W.
In figure 7 the densities of charged particles coming from the model are compared to the experimental results. The calculated density for
and electron density is (2–4) × 1017 m−3 which is approximately 2 to 4 times higher than the experimental values. Electron density calculated by the model is around 6 times greater than the measured one. However, the relative increase of calculated densities with power follows the experimental results.

Figure 7. Electron (and total ion) density (full line),
ions (dash-dot line),
ions (dotted line) and H+ ions (dashed line) calculated in the model for different powers compared with Langmuir probe measurements (Ne—black squares, Ni—red dots).
Download figure:
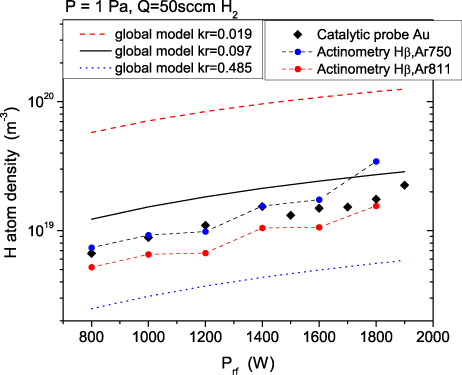
Standard image High-resolution imageIn figure 8 the density of H obtained from the model are shown together with the catalytic probe data measured at the chamber centre and actinometry results from (Hβ, Ar750) and (Hβ, Ar811) lines. The results attained with a surface recombination coefficient (kr) equal to 0.097 (black line) agree well with the experimental data: the calculated density of H is 1.2–2 times greater than the measured one. The recombination coefficients for quartz glass [48] and stainless steel [49] are weighted according to the contribution of these materials to the surface area in the reactor chamber. The obtained value of 0.097 for kr depicts a physically realistic situation, since it takes into account both materials present inside the reactor (quartz and stainless steel) with their respective areas. All density curves in figure 8 have the same slope, thus the change of H atoms is independent of the recombination coefficient. Densities of Ar neutrals, metastables and ions were also calculated in the model. Since initial Ar atom density is low, densities of produced ions and metastables are a few orders of magnitude lower.
Figure 8. Comparison of H density obtained from the global model for three different values of surface recombination coefficient and the catalytic probe and actinometry data.
Download figure:
Standard image High-resolution image
When comparing modelling with experimental results one should have in mind that modelling results are coming from a global, 0d or volume-averaged model aiming to capture the complex phenomena occurring in 3d in a plasma reactor. There are works referring to global models where the plasma generation region is treated separately from the processing (diffusion) chamber (see for example [70]). In the global model used here, there was no separate treatment of the two regions; this may be an additional source for differences between experimental and simulation results.
In order to further investigate the potential origin of differences in uncertainties of the model parameters, a sensitivity analysis was performed (see supplementary data). All model parameters (reaction rate coefficients, recombination coefficient and cross-section for ion–neutral collisions) were increased 5 times and decreased 5 times. When a model parameter changed, all others were kept constant. It should be noted that we changed the pre-exponential factor of the reaction rate coefficients. The reaction rate coefficients are functions of Te, thus a change of the pre-exponential factor, through its effect on the balances, may result into a change of Te. The sign of the change of the rate coefficient depends on the changes of both the pre-exponential factor and Te. It is not impossible that an increase of the pre-exponential factor will finally result in a decrease of the reaction rate coefficient through a decrease of Te. We focused on the effect of model parameters on Te, Ne, and NH. A parameter was identified as important if the absolute value of the % change of Te, Ne, or NH is greater than 50% or less than −33%, i.e. when the value of Te, Ne, or NH is multiplied or divided by 1.5. The results for the important parameters are summarized in table 4.
Table 4. Sensitivity analysis for the results of the model: the % change of NH, Ne, and Te when the important (see supplementary information for the full sensitivity table) model parameters are multiplied and divided by 5. When one parameter changes the rest of them remain constant. The base case conditions are 50 sccm of H2 feed, pressure of 1 Pa, and power of 1400 W. The indices of k in the first column correspond to the indices of the reactions in table 1.
| Model parameter | % ΔNH | %ΔNe | %ΔTe |
|---|---|---|---|
| k1 × 5 | 79.24 | −48.29 | −0.53 |
| k1/5 | −40.34 | 23.66 | 0.27 |
| k2 × 5 | −35.39 | −36.64 | 0.09 |
| k2/5 | 12.15 | 12.91 | −0.03 |
| k9 × 5 | −9.89 | 97.85 | −26.28 |
| k9/5 | −8.48 | −57.01 | 49.31 |
| kr × 5 | −79.61 | −3.21 | 0.41 |
| kr/5 | 352.69 | 16.36 | −1.75 |
| σion-neutral × 5 | 7.45 | 85.03 | −15.67 |
| σion-neutral/5 | −7.53 | −30.25 | 10.70 |
The important model parameters are the rate coefficients of reactions (G1) (electronic excitation leading to H2 dissociation, see table 1), (G2) (electronic excitation) and (G9) (ionization of H2), the surface recombination coefficient (reaction (S1), see table 1) and the cross-section for ion–neutral collisions in plasma (reaction (G30), see table 1); the latter parameter plays an important role to the losses of ions at the wall surfaces by affecting the parameter h (see section 3).
When the rate coefficient for the dissociation reaction (G1) (k1) increases (decreases), the density of H increases (decreases) and the electron density decreases (increases), while the electron temperature remains constant. The increase (decrease) of the rate coefficient for the electronic excitation reaction (G2) (k2) causes a decrease (small increase) of both the electron and H density; the electron temperature is not affected by the change of k2. The increase (decrease) of the rate coefficient for the ionization reaction (G9) (k9) induces an increase (decrease) of the electron density and a decrease (increase) of the electron temperature; the density of H is slightly decreased with the change of k9.
Enriching the sensitivity analysis, the effect of the surface recombination coefficient (kr) on the density of H is shown in figure 8 for the whole power range investigated. Figure 8 includes the densities of H obtained from the model for different surface recombination coefficient together with the catalytic probe data measured at the chamber centre. The results of the model obtained with kr = 0.485 (0.097 · 5) are far below the experimental data (dots in figure 8). In this case, the value of the coefficient is high, well above the value for stainless steel [49], the recombination seems to be overestimated, and the density of H is lower by a factor of 2 compared to the measured density. The model results acquired with lower recombination coefficient, kr = 0.019, yielded 3 to 4 times higher H densities compared to the base case (kr = 0.097, compare the dashed line with the black line in figure 8). Such low recombination coefficients could be present in the case of glass-type surfaces [48].
Finally, the increase (decrease) of the cross-section for ion–neutral collisions (σion-neutral) causes an increase (decrease) of the electron density and a small decrease (increase) of the electron temperature; the change of σion-neutral slightly affects the density of H.
The main discrepancy between the modelling and the experimental results is in the value of the electron density; the electron density is calculated to be 6 times greater. The sensitivity analysis shows that this discrepancy could have been reduced if k1 and/or k2 were greater. It could have been also reduced if k9 was lower; however, in the latter case the electron temperature would have been increased (see table 4).
Regarding k1 (rate coefficient for the dissociation of H2), it is rather greater than the value we used: some paths to dissociation coming from vibrational excitations [45, 71] were not taken into account. Sawada and Fujimoto [72] calculated an effective rate coefficient for the H2 dissociation which is greater than the one used in this work; in particular, for an electron temperature equal to 3.5 eV, they report an effective rate coefficient which is about 4 times greater (figure 5 of [72]) than the one we used. Indeed, the sensitivity analysis shows that a multiplication of k1 with 5 will result in an electron density 3 (and not 6) times greater than the experimental result.
Regarding k2 (rate coefficient for electronic excitation reaction), we have no evidence that it has an underestimated value. However, what the sensitivity analysis shows us is that omitted excitation reactions (even if they do not join the mass balances as reaction (G2)) potentially affect the electron density; the addition of more excitation reactions in the reaction set of table 1, will increase the energy loss rate per electron which will subsequently result in a decrease of the electron density. Regarding the reaction set of table 1, the omission of excitation reactions, e.g. vibrational excitations [45, 71] or metastable atoms [43], could result into an overestimation of the electron density. We are working on a 2d plasma model for H2 discharges, where all these potential sources of discrepancies will be further investigated in conjunction with a more detailed model. In addition, we will also check the effect of using the experimentally obtained EEDF (and not a Maxwellian EEDF) on the rate coefficients of electron-impact reactions and as a consequence on the model results.
5. Conclusions
Low-pressure hydrogen plasma characterization was performed in the helicon-type RF source in the region close to the wafer holder position using experimental measurements and a global model. Density of atomic hydrogen was determined using two independent diagnostic methods, namely catalytic probes and actinometry. We have found that in general there is a good agreement in the results, within the measurement error. In the case of (Hβ, Ar750) and (Hβ, Ar811) line pairs, the consistency was even better than in the case of (Hα, Ar750), (Hα, Ar811). The reason for this is that both the sensitivity of the method on cross-section data and the differences in threshold energies may influence the actinometric calculations.
Furthermore, we have investigated the domain of applicability of 'classical' actinometic formula by looking at the magnitude of the dissosiative excitation term (see supplementary data). We have defined the range of conditions where the dissociative excitation term can be neglected. For such conditions we have calculated and tabulated the proportionality constant for several actinometric lines, and hope that this calculation may be useful for quick real-time measurements of H densities at least in a semi-quantitative way, given the uncertainties in cross-sections and the possibility of non-Maxwellian electron energy distributions.
We have used Langmuir probe simultaneously with other diagnostics to record the plasma parameters such as Ni, Ne and ion flux for standard material processing conditions. The obtained results fall in the range of typical values for such reactor. Densities of electrons and ions in hydrogen plasma of around 1016 m−3 were slowly changing with plasma power. Ion flux was found to rise steadily with increasing power from 1.5 to 2.5 × 10²⁰ m−2 s−1. The established global model of hydrogen plasma included both gas phase reactions and surface reactions. We have shown that H atom concentration depends considerably on the surface recombination coefficient, i.e. material of the reactor walls. The best agreement with the catalytic probe results was obtained when a realistic surface recombination coefficient of stainless steel/quartz walls was used. The global model shows that there is a reasonable agreement with experimentally measured electron temperature, and the charged particle densities measured by Langmuir probe. In order to test the model and provide an explanation for the differences observed in the comparison, a detailed sensitivity analysis was performed by changing input parameters of the model. The important model parameters are the rate coefficients of electronic excitation leading to H2 dissociation and ionization of H2, the surface recombination coefficient of H, and the cross-section for ion–neutral collisions in the plasma (reaction (G30), see table 1), which plays an important role to the losses of ions at the wall surfaces.
For successful material processing in an industrial reactor like ours, detailed characterization of the discharge parameters, plasma–surface interactions and plasma behaviour needs to be employed. Even though the reactor has a relatively complex geometry, the global model provided good insight into plasma behaviour. Detailed plasma parameter measurements give a firm ground for optimization of material surface cleaning processes.
Acknowledgments
The main funding of this work (EG, NŠ) came from the EU FP7 Marie Curie Initial Training Network Surface Physics for Advanced Manufacturing—S.P.A.M, grant n° 215723. NP gratefully acknowledges the support of Ministry of Science and Technological Development, Serbia, for scholarship and projects under the contract numbers ON171037 and III41011. SL and UC acknowledge the support of ARRS, AdFutura and COST action MP1011. GK was funded by the project CORSED (PE-844) under the program 'Supporting post-doctoral researchers' of the National Strategic Reference Framework; the source of funding is the European Social Fund (ESF)-European Union and National Resources.