


ABSTRACT
We have identified a previously unassigned pair of lines between 169 and 170 Å in the coronae of cool stars. We attribute these lines to Fe xiv and show that their intensity ratio is sensitive to the electron density. Using observations taken with the Low Energy Transmission Grating Spectrometer of the Chandra X-ray Observatory we infer a density of log(ne/cm−3) = 10.2 ± 0.7 and 10.3 ± 0.8 from the newly identified line pair in the coronae of Procyon and α Cen A, respectively.
Export citation and abstract BibTeX RIS
1. INTRODUCTION
Density determinations are fundamental for inferring the structure of stellar coronae, including coronal thermal stratification, spatial extent, and variability (Mason 1991; Landi & Landini 1997; Brickhouse & Dupree 1998; Sanz-Forcada et al. 2002; Mewe et al. 2003; Testa et al. 2004; Güdel & Nazé 2009). Such determinations require high-resolution spectroscopy in order to properly resolve suitable line pairs whose relative intensities are sensitive functions of the electron density. In addition, it is important to be able to determine the electron density from line pairs of ions of a given element with different charges because each ionization state may sample a different temperature region of the corona. In order to make the most of spectral observations in a given spectral band it is thus necessary to utilize as many diagnostic line ratios as available and to expand, if possible, the list of known spectral density diagnostics.
In the following we study the 162–173 Å spectral region of three cool stars: The Sun, Procyon, and α Centauri. Procyon, or α Canis Minoris (CMi), is a late-type (F5 IV-V) star (Johnson & Morgan 1953) with a faint white dwarf companion. It is close to our own solar system (3.5 pc) and readily visible to the naked eye (Perryman et al. 1997; van Leeuwen 2007). Procyon has a cool, X-ray bright corona, similar to the solar corona (Schmitt et al. 1985; Jordan et al. 1986), with a temperature of about 1–3 MK (Ness et al. 2001, 2002; Raassen et al. 2002). α Centauri (α Cen), is a late-type binary system comprised of a G2 V primary (α Cen A) with ∼110% solar mass and a K1 V secondary (α Cen B) with ∼93% solar mass (Pourbaix et al. 2002). At a distance of 1.3 pc (Perryman et al. 1997; Söderhjelm 1999; van Leeuwen 2007), it is—along with the slightly closer M5 V red dwarf Proxima Centauri, with which it is believed to be gravitationally bound (Kamper & Wesselink 1978; Kroupa 1995; Wertheimer & Laughlin 2006)—the nearest star system to the Sun. Like Procyon, it is optically bright and readily identified with the unaided eye. α Cen A has a cool, X-ray bright corona similar to the Sun, with a temperature of about 1–2.5 MK (Jordan et al. 1986; Ness et al. 2001; Raassen et al. 2003a, 2003b). α Cen A and B are separated by about 23 AU and have an orbital period of 80 years (Pourbaix et al. 2002). Both α Cen and Procyon have been studied in the extreme ultraviolet (EUV) wavelength band with high resolution using the Low Energy Transmission Grating Spectrometer (LETGS) of the Chandra X-ray Observatory (Raassen et al. 2002, 2003b; Ayres 2009; Li et al. 2013; Beiersdorfer et al. 2014b).
The 162–173 Å spectral region contains the well known emission lines from Fe viii (near 168 Å) and Fe ix (near 171 Å), as reported by Raassen et al. (2002, 2003b), Doschek & Cowan (1984). The spectral region also contains a Ni xiii line near 164.1 Å, and a Ni xiv line near 171.4 Å, which have been seen in the Sun (Behring et al. 1972) and subsequently assigned (Fawcett 1976; Doschek & Cowan 1984). The solar spectrum was also found to contain three lines at 169.616, 169.680, and 169.915 Å (Behring et al. 1972) that initially remained unidentified. The line at 169.680 Å has since been attributed to Ni xiii (Fawcett 1976; Doschek & Cowan 1984), but the other two lines have remained unassigned to date.
In this work we show that the two solar lines at 169.616 and 169.915 Å also appear in the spectra of Procyon and α Cen. Employing the same methodology of spectroscopically accurate transition energy calculations coupled with collisional radiative modeling that we utilized to perform line identifications of the 100–140 Å spectrum of Procyon (Beiersdorfer et al. 2014b), we have identified the two lines as the  and
and  transitions in Fe xiv. We show that the ratio of these two lines is sensitive to densities in the range from approximately 109–1011 cm−3. This and the fact that the lines are very close together so that variations in the relative instrumental responses are minimized make them, in principle, ideal density diagnostics of stellar coronae. For example, the spectral closeness of the two lines means that the response function of the LETGS varies by only 4% at the two line positions, despite the fact that the lines are close to the edge of the useable effective area of this instrument.
The discovery of Fe xiv lines near 170 Å is unexpected. The well known Fe xiv lines are situated near 211, 219, and 265 Å (Lepson et al. 2008; Beiersdorfer & Lepson 2012). These represent transitions within the n = 3 shell. Lines from Fe xiv below the strong line at 211.3 Å involve transitions connecting the n = 3 shell with levels with an electron in the n ≥ 4 shell. For example, Fe xiv transitions that connect n = 3 to n = 4 levels are situated between about 60–80 Å (Doschek & Cowan 1984). The lines identified in the present work do not involve an electron with principal quantum number n = 3. They instead proceed between the n = 4 and n = 5 levels. Calculations involving levels with electrons in such excited states have traditionally either not been reported or have been too inaccurate for spectroscopic purposes. As a result, Fe xiv lines associated with transitions of the type we describe in this paper are absent in current spectral databases such as CHIANTI (Landi et al. 2012).
2. LETGS OBSERVATIONS
The co-added Procyon and co-added α Cen data are shown in Figure 1. Both spectra were binned by a factor of two in order to enhance the signal to noise. Only data from the positive grating order were included in the spectra. The negative order does not have coverage above about 165 Å and thus does not contribute flux in the relevant region.
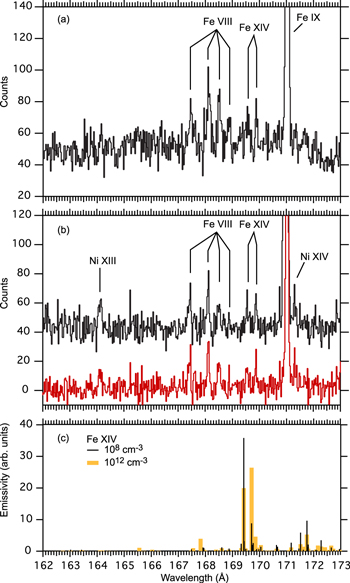
Figure 1. LETGS spectra of (a) Procyon and (b) α Cen in the region 162–173 Å. Lines are labeled by their associated charge state. The emission of Fe xiv predicted by our collisional-radiative model is shown in (c) for two different densities. The line emissivities for 108 cm−3 have been multiplied by ×104 in order to have comparable intensities to those at 1012 cm−3.
Download figure:
Standard image High-resolution imageThe Procyon spectrum in Figure 1(a) was obtained by summing obs ids 63, 1461, 10994, and 12042. In the spectrum we can identify the well known lines from Fe viii (near 168 Å) and from Fe ix (near 171 Å). We also have labeled the two lines we assign to Fe xiv.
The α Cen spectrum shown in Figure 1(b) was obtained by summing obs ids 29, 7432, and 12332. The spectra of the A and B stars of α Cen can be separated at these high wavelengths, and the spectrum represents the emission from the primary component. Inspection of the (weak) emission from α Cen B shows only prominent lines from Fe ix and Fe x (at higher wavelengths than shown in the figure), but the spectrum does not appear to comprise any noticeable contribution from Fe xiv. Figure 1(b) shows two traces. One trace represents the full data set, while the other represents the emission after subtracting the instrumental background obtained from the standard data extraction with the Chandra Interactive Analysis of Observations software CIAO v. 4.5.
In addition to the well known lines from Fe viii (near 168 Å) and from Fe ix (near 171 Å) we have identified and labeled two nickel lines in the α Cen spectrum. This identification is based on their position, their intensity, and the fact that nickel lines had already been identified by Raassen et al. (2003b) between 148 and 158 Å. In particular, we identify the  line from Ni xiii near 164.1 Å and the
  line from Ni xiv on the long-wavelength-side of the Fe ix line at 171.4 Å. The two lines from Fe xiv have also been labeled.
3. SPECTRAL CALCULATIONS AND LINE IDENTIFICATIONS
Our approach is the same as that used in the recent analysis (Beiersdorfer et al. 2014b) of LETGS data of Procyon between 100 and 140 Å. The 100 and 140 Å region did not show any lines from Fe xiv. However, in order to rule out the presence of Fe xiv lines it was necessary to calculate the Fe xiv spectral emission. Similarly, we use the spectral calculations for Fe ix, Fe x, Fe xiii, Fe xv, Fe xvi, and Fe xvii from our earlier work to ascertain that these spectra of iron do not comprise sufficiently strong lines in the 162–173 Å region that could coincide with the two newly identified Fe xiv lines. Such extensive calculations are necessary because the density of even weak iron lines can be high enough to lead to extensive blends and even a quasi-continuum, as observed, for example, on α Cen (Mewe et al. 1995) and reproduced in laboratory observations (Beiersdorfer et al. 1999).
As noted before (Beiersdorfer et al. 2014b), our transition energy calculations are based on the relativistic multireference Møller-Plesset (MRMP) perturbation theory (Ishikawa et al. 1991; Ishikawa & Vilkas 2001). This method has been used to calculate the n = 3 to n = 3 transitions in Fe xi, Fe xii, and Fe xiii (Vilkas & Ishikawa 2004a, 2004b; Ishikawa & Vilkas 2008), which mostly fall into the wavelength band above 170 Å. The method has also been used to produce accurate wavelengths for the L-shell transitions of Fe xv, Fe xvi, and Fe xvii (Ishikawa et al. 2009; Beiersdorfer et al. 2012, 2013, 2014a; Díaz et al. 2013), as ascertained by laboratory measurements.
Our MRMP calculations of Fe xiv included levels with principal quantum number n = 3, 4, and 5. From this comprehensive set of level energies, we derived the desired energies of the n = 5  n = 4 transitions. The results from our MRMP calculations were then combined with intensities derived from collisonal-radiative modeling calculations using the Flexible Atomic Code (FAC) (Gu 2008). This way we generate ab initio theoretical spectra that allow us to use both the predicted line position and the line intensities as guides for line identification.
The results of our Fe xiv spectral modeling calculations in the 162–173 Å region are shown in Figure 1(c). The Fe xiv spectrum in this region is sensitive to the electron density. This is illustrated in Figure 1(c), where we show the predicted spectrum at densities of 108 and 1012 cm−3, i.e., at the lower and upper limits of the density sensitivity. The relative intensities of the two strongest lines in this wavelength range are seen to reverse for the two densities shown in the figure.
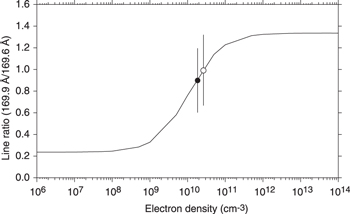
The sensitivity of the two prominent Fe xiv lines in the 162–173 Å region to the electron density is displayed in Figure 2. Here we plot the intensity ratio of the two lines over eight orders of magnitude in density. The figure shows that the ratio of the two lines can be used as a sensitive density diagnostic between about 109 and 1011 cm−3. The ratio is insensitive to the electron temperature.
Figure 2. Predicted intensity ratio of the two 
 (λλ169.9) and
  (λλ169.6) transitions in Fe xiv as a function of density. Also plotted are the ratios from the Procyon (filled circle) and α Cen (open circle) observations.
Download figure:
Standard image High-resolution image
It is interesting to note that in this wavelength band, the transition energies predicted by the MRMP method and by FAC are reasonably close to each other for Fe xiv. The two strongest lines seen in Figure 1 are the  and
and  transitions, and the wavelengths predicted for these lines with the two calculations match within 0.15 Å, as can be seen from Table 1. To put this in perspective, we note that the same calculations predict, for example, wavelengths of 219.15 Å (MRMP) and 216.87 Å (FAC) for the strong
  transition situated at 219.13 Å. In other words, the two calculations differ by 2.3 Å in this case, i.e., by more than an order of magnitude beyond the difference found for the lines of present interest. The good agreement attained for the two n = 5
  n = 4 transitions may be the result of the diminished influence of electron correlations for such high-n transitions. In fact, because of the filled K and L shells and the closed
  subshell, the
  and
and  valence electrons appear almost hydrogenic.
Table 1. Comparison of Predicted and Observed Wavelengths of the Newly Identified Fe xiv Lines
| Identification | Wavelength (Å) | |||||
|---|---|---|---|---|---|---|
| Ion | Transition | FAC | MRMP | α Cen | α CMi | Suna |
| Fe xiv |

|
169.85 | 169.71 | 169.87 | 169.89 | 169.915 |
| Fe xiv |

|
169.57 | 169.42 | 169.54 | 169.62 | 169.616 |
Note.
aFrom unidentified solar observations of Behring et al. (1972).Download table as: ASCIITypeset image
The comparison between the calculations and the observations in Figure 1 intimates that the two strongest predicted lines in the Fe xiv spectrum in this wavelength band are identical to the two lines seen in the spectra of Procyon and α Cen. Overall, the two lines are weak and close to the detection limit of the observations. As the two traces in Figure 1(b) illustrate, the lines are affected by whether or not the background is subtracted. However, the two Fe xiv lines have a comparable intensity to the neighboring Fe viii lines and cannot be dismissed as background or noise. The positions inferred from the LETGS observations are very close to the predicted values, as summarized in Table 1. Due to the weakness of the lines, the wavelength determinations are uncertain by ±0.03 Å or more.
The rocket observations of the Sun reported by Behring et al. (1972) also have seen two lines at the proper location. These observations have very high spectral resolution, and the two lines appear well resolved in their spectrum. As a result, the authors could determine the line positions with high precision. The wavelengths reported by Behring et al. (1972) for these two lines are close to the wavelengths we find for the two lines in the spectra of Procyon and α Cen, as seen from Table 1. We therefore assign these two solar lines to be the same two n = 5  n = 4 transitions in Fe xiv observed in Procyon and α Cen.
While there are no intensity data reported for the two Fe xiv lines by Behring et al. (1972), we can determine the relative intensity of the two lines from the co-added LETGS observations. We get values of 0.89 ± 0.31 and 0.98 ± 0.34 for the ratio of the intensity of the λλ169.9 line to the intensity of the λλ169.6 line in the coronae of Procyon and α Cen, respectively. We have plotted these values in Figure 2 and infer a density of log(ne/cm−3) ≈ 10.2 ± 0.7 for Procyon and log(ne/cm−3) ≈ 10.3 ± 0.8 for α Cen A.
Our collisonal-radiative modeling calculations predict several Fe xiv lines that are close to the two primary Fe xiv lines, as seen in Figure 1(c). These lines are weaker than the primary lines, but they may blend with the primary lines and thus add flux to the observed features. Whether these lines indeed blend with the two strong Fe xiv lines depends on the instrumental resolution and their spectral positions. In Table 2 we list the lines that are predicted by our MRMP calculations to be close in wavelength to the two primary Fe xiv lines. Because even our best wavelength predictions have some uncertainty—the positions of the two primary Fe xiv lines predicted by our MRMP calculations differ from the solar measurements by 0.2 Å—it is not clear whether these lines blend or are resolvable. Of course, if the lines were spectrally resolvable, the lines would likely be too weak to be detectable in the LETGS spectra. Because of these uncertainties we did not include the contribution from these lines in the density-dependent intensity ratio plotted in Figure 2. Further improvements in the spectral modeling calculations, for example, in the calculation of spectral intensities by using R-matrix collisional data or by including indirect excitation processes may be desirable when new observations become available.
Table 2. Transitions Predicted to be Spectrally Close to the Two Fe xiv Lines Identified in Table 1
| Identification | Wavelength (Å) | ||
|---|---|---|---|
| Ion | Transition | FAC | MRMP |
| Fe xiv |
|
167.70 | 169.32 |
| Fe xiv |
|
168.98 | 169.43 |
| Fe xiv |
|
169.39 | 169.49 |
| Fe xiv |
|
169.90 | 169.73 |
| Fe xiv |
|
169.90 | 169.77 |
| Fe xiv |

|
169.79 | 169.85 |
Download table as: ASCIITypeset image
3.1. Discussion
The newly assigned Fe xiv lines are the only lines from this spectrum of iron identified so far in the 100–170 Å region. The closest Fe xiv transition is the well known line at 211.32 Å, which, however, cannot be observed with Chandra or any other current satellite mission. The two lines near 169 Å thus can provide a new constraint for the differential emission measure of stellar coronae.
The two lines also provide a means for assessing the coronal density. Previous determinations have inferred a density of log(ne/cm−3) between about 9 and 11 for Procyon based on K-shell density diagnostics involving C v, N vi, O vii, and Ne ix (Ness et al. 2002). The authors found a similar range of densities for α Cen A, although the Ne ix spectrum did not provide useful data in this case. Our earlier analysis of the n = 4  n = 3 transitions of Fe xiii, which fall into the 100–120 Å region, showed that a density between log(ne/cm−3) = 9–10 provided the best fit to the Procyon spectrum (Beiersdorfer et al. 2014b). The present result we glean from the Fe xiv line ratio of log(ne/cm−3) ≈ 10.2 for Procyon, thus, is commensurate with these previous measurements. It is somewhat higher, though, than the values of log(ne/cm−3) ≈ 8.6 and 8.8 found by Liang et al. (2006) for Procyon and α Cen A, respectively, based on an analysis of the Si x line emission, but different ions may sample different temperature regions of the corona.
Unfortunately, the two  and
and  lines in Fe xiv are rather weak, which somewhat limits their utility. However, we demonstrated that the lines can be observed in three cool stars and used for diagnostic purposes. Consequently, they represent a new spectral tool for analyzing coronal data obtained with the LETGS or with future high-resolution instruments.
Work by the Lawrence Livermore National Laboratory was performed under the auspices of the Department of Energy under contract No. DE-AC52-07NA-27344. This work was supported by Chandra Guest Observer Awards GO0-11031X and GO0-15004X. P.B. acknowledges the hospitality of the University of Puerto Rico, Chemical Physics Program, while performing the MRMP and FAC calculations. N.H. acknowledges funding by the European Space Agency under contract No. 4000114313115/NL/CB.