


ABSTRACT
The X17.0 solar flare of 2005 September 7 released high-energy neutrons that were detected by the Solar Neutron Telescope (SNT) at Sierra Negra, Mexico. In three separate and independent studies of this solar neutron event, several of its unique characteristics were studied; in particular, a power-law energy spectra was estimated. In this paper, we present an alternative analysis, based on improved numerical simulations of the detector using GEANT4, and a different technique for processing the SNT data. The results indicate that the spectral index that best fits the neutron flux is around 3, in agreement with previous works. Based on the numerically calculated neutron energy deposition on the SNT, we confirm that the detected neutrons might have reached an energy of 1 GeV, which implies that 10 GeV protons were probably produced; these could not be observed at Earth, as their parent flare was an east limb event.
Export citation and abstract BibTeX RIS
INTRODUCTION
The lifetime of neutrons in free space is 885 s (Nieto et al. 2008); therefore, to be detected at the ground level, they must be very energetic and produced in a source close to the Earth. Energetic solar neutrons may be produced by nuclear reactions at the solar atmosphere (Biermann et al. 1951); they are very important for providing information on the mechanism of ion acceleration during strong flares, since they are not affected by electromagnetic fields, preserving information of the source as they travel.
On 1980 June 21, the Solar Maximum Mission (SMM) spacecraft was the first instrument to detect solar neutrons (Chupp et al. 1982). The solar flare of 1982 June 3 released neutrons, which were registered for the first time by ground-level detectors (Efimov et al. 1983 and Chupp et al. 1987).
The solar flare acceleration mechanism of electrons has been studied by X-ray and γ-ray observations, while the acceleration of ions is still not well understood. To calculate the energy spectra of neutrons and accelerated ions at the solar atmosphere, we need to have a simultaneous detection of solar neutrons at the ground level, X-rays, and γ-rays. Based on the energy of solar neutrons, we can calculate the time profile of the accelerated particles and know if the particle acceleration occurs gradually or impulsively. The observation of X-rays and γ-rays is carried out efficiently by satellites, while observing solar neutrons can be done by traditional neutron monitors (NMs) and solar neutron telescopes.
NMs have high sensitivity, but to discriminate between neutrons and charged particles and to know the energy of the incident particles, it is necessary to implement a different technique, as shown in Bieber et al. (2005a). Furthermore, the NMs cannot recognize the arrival direction of the incident particles; however, for a solar neutron event, it is possible to know the direction of the neutrons, based on determining the location of the flare on the solar disk, using the UV, optical, X-ray, or a different flare emission and the line of sight.
The Solar Neutron Telescope (SNT) has the capability to directly measure the deposited energy and arrival direction of particles, and has the ability to discriminate between neutrons and charged particles impinging the top of the detector (Valdés-Galicia et al. 2004). In this way, using the SNT data we can streamline the study and make a more direct analysis of the solar flare particle emissions.
In this paper, we will discuss observations of solar neutrons at the Earth's surface by the SNT installed in the Sierra Negra Volcano, México, as a consequence of the X17.0 event of 2005 September 7, and assess its contributions to the knowledge of the solar flare phenomenon. We start by reviewing the X-ray and γ-ray observations performed by the GEOTAIL and INTEGRAL spacecrafts, and show the data detected by the Mexico City NM in Section 1. Section 2 contains a description of the solar neutron observations at the Sierra Negra SNT. In Section 3, the data are re-evaluated based on a GEANT4 simulation. Conclusions are presented in Section 4.
1. SOLAR EMISSIONS ON 2005 SEPTEMBER 7
On 2005 September 7 a X17.0 a solar flare occurred on the east limb of the Sun, located at S06°, E89°. The GOES satellite detected an increase in soft X-ray emission at 17:17 UT; the flare peak was at 17:40 UT; no increases were observed in the counting rates of charged particles (>0.1 particles s−1 cm−2) (swpc.noaa.gov). The emitted protons are diverted by the interplanetary magnetic field lines from the Sun beyond the Earth; thus, almost four hours after the onset of the flare a very gradual solar proton event was detected at the GOES spacecraft (swpc.noaa.gov). We show the hard X-ray emission observed by the GEOTAIL spacecraft, with a significant increase ranging from 17:34 to 17:40 UT, the maximum was at 17:36:40 UT (Figure 1(a)). The gamma-ray profiles, in the range of 1–10 MeV (Figure 1(b)), also correspond to the INTEGRAL satellite.
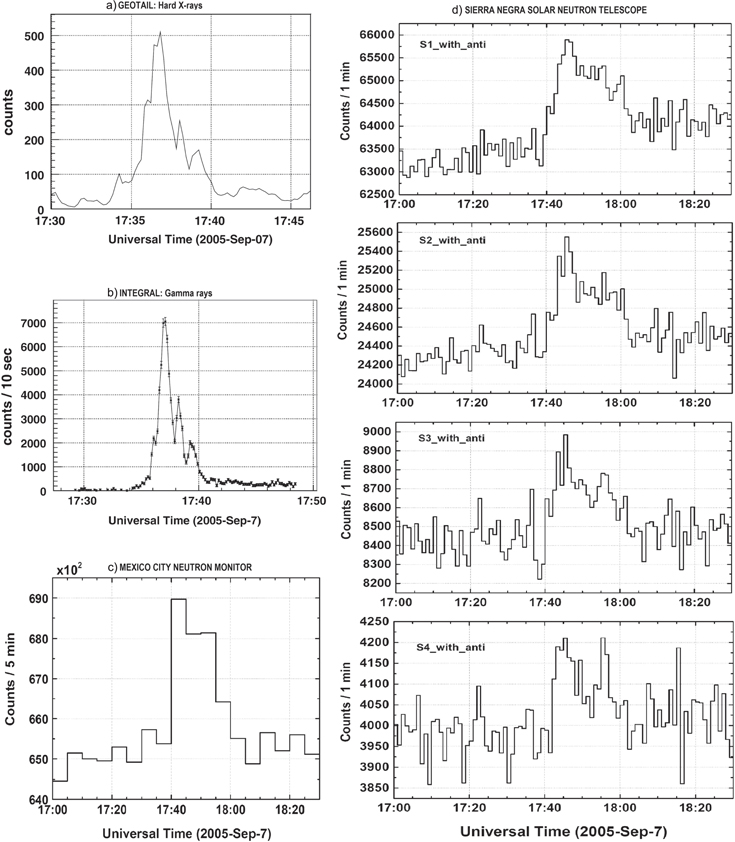
Figure 1. Different emissions of the solar flare of 2005 September 7. (a) Hard X-rays (>50 keV) observed by GEOTAIL (Watanabe et al. 2007). (b) Flux of gamma rays: 1–10 MeV, observed by the INTEGRAL satellite (Watanabe et al. 2007). (c) Time profile of the Mexico City neutron monitor with a five minute counting rate. (d) Data detected for the four neutral channels of the solar neutron telescope at Sierra Negra.
Download figure:
Standard image High-resolution imageBased on (Valdés-Galicia et al. 2009) and Figure 1(a), it is confirmed that there were soft and hard X-ray emissions during the event of 2005 September 7, confirming particle acceleration at the flare site. Figure 1(b) provides evidence that there were nuclear reactions between accelerated particles and elements in the solar atmosphere. The time profiles of gamma rays and hard X-rays emissions are similar, with a peak at 17:36:40 UT, so we may assume that a gradual production of solar neutrons occurred for a few minutes around X-ray and gamma-ray maxima. Figures 1(c) and (d) show the data of the Mexico City NM and the short time profile of the four neutral particle detection channels of the SNT at Sierra Negra, respectively, for the time of the solar flare. From Figure 1, we observe that the relative time of the solar emissions is at least around nine minutes prior to the arrival of particles.
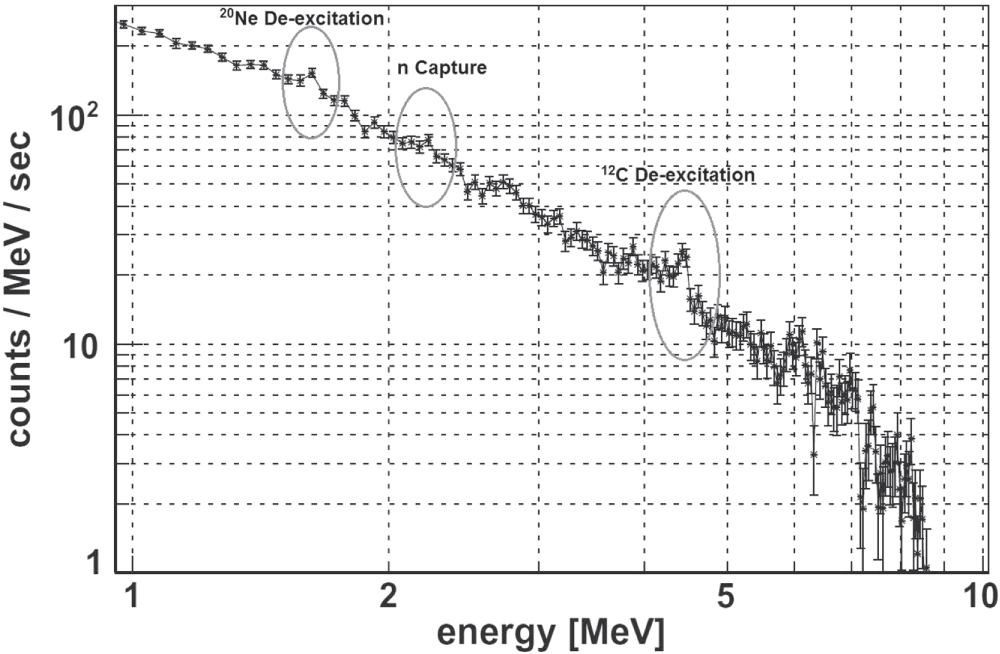
Figure 2 presents the INTEGRAL satellite data for the gamma-ray spectrum from 1 to 10 MeV, attributed to the solar flare of 2005 September 7 (Watanabe et al. 2007). Three features of the spectrum (ovals) are distinguishable: (i) the 20Ne nuclear de-excitation line, (ii) the deuterium neutron capture line at 2.223 MeV, and (c) the 4.4 MeV 12C nuclear de-excitation line. These are further proof that nuclear reactions occurred during the flare and that energetic neutrons were produced as a consequence.
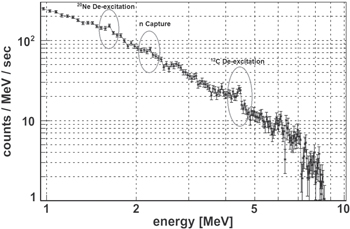
Figure 2. Energy spectrum of gamma rays observed by the INTEGRAL satellite, for the solar flare of 2005 September 7 (Watanabe et al. 2007). The ovals show the nuclear de-excitation lines of 20Ne and 12C and the neutron capture line (2.223 MeV). These confirm the solar neutron production.
Download figure:
Standard image High-resolution imageThe SNT installed at the top of the Sierra Negra volcano in Mexico was the best emplacement among the world network of SNTs for observing solar neutrons for the X17.0 solar flare. Figure 3 shows the position of the seven SNTs and the NMs with the best positions for observing the solar flare, with respect to the Sun at the time of the September 7 flare. In Sierra Negra (262°E, 19 0 N, 4580 m.a.s.l.), the Sun zenith angle was 175 and the air mass of the line of sight to the Sun was about 600 g cm−2.

Figure 3. Cosine of the solar zenith angle at the time of the flare (17:40 UT) of 2005 September 7. The black dots represent the geographic location of the SNTs and the two neutron monitors that observed the solar flare signal. The intense gray zone means that the Sun zenith angle was close to zero and was just above the SNT at Sierra Negra.
Download figure:
Standard image High-resolution imageThe evidence presented here constitutes a strong argument in favor of the possibility of observing energetic solar neutrons at Earth, produced in the referred event.
2. SOLAR NEUTRONS OBSERVATION
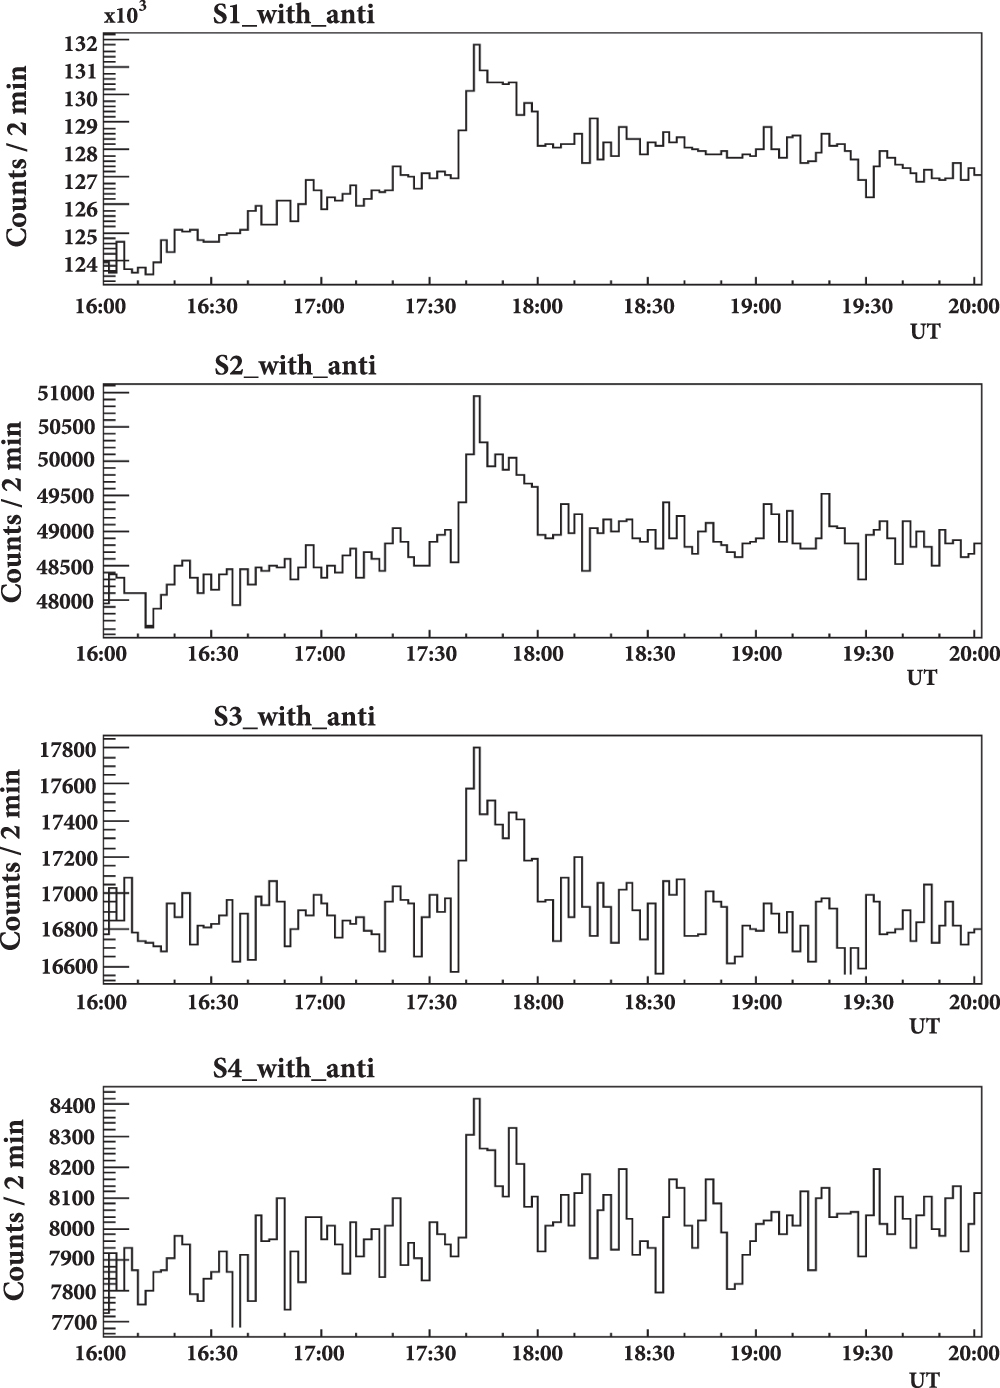
The SNT at Sierra Negra has four different energy deposition threshold channels that correspond to E > 30 MeV (S1_with_anti), E > 60 MeV (S2_with_anti), E > 90 MeV (S3_with_anti) and E > 120 MeV (S4_with_anti). Figure 4 shows the long time profile (16–20 hr UT) of the solar neutron event of 2005 September 7, detected by the four channels of the SNT. The excess in the time interval from 17:42 to 17:54 UT is clearly seen in all four energy channels and the statistical significances of the humps are 15.8σ, 12.6σ, 9.6σ, and 7.8σ, from the lowest to the highest energy deposition, respectively. For the charged particle channels of the SNT, there is no corresponding increase; furthermore, Figure 1 shows that the data increase detected by the Mexico City NM corresponds to the profiles of the X-ray and γ-ray emissions. Therefore there is no doubt that the particles registered were neutrons, as the contamination of the neutron channels is negligible (González et al. 2010). Whereas the emission of solar neutrons began together with the increase of gamma-ray lines (17:34 UT), the neutrons' arrival to the SNT occurred ∼9 minutes later, indicating that they were ultrarelativistic.

Figure 4. Solar neutron event detected by the SNT at Sierra Negra on 2005 September 7. It shows the four channels of neutron deposition energy for a two minute counting rate. The statistical significances of the humps are 15.8σ, 12.6σ, 9.6σ, and 7.8σ for S1_with_anti (>30 MeV) to S4_with_anti (>120 MeV), respectively.
Download figure:
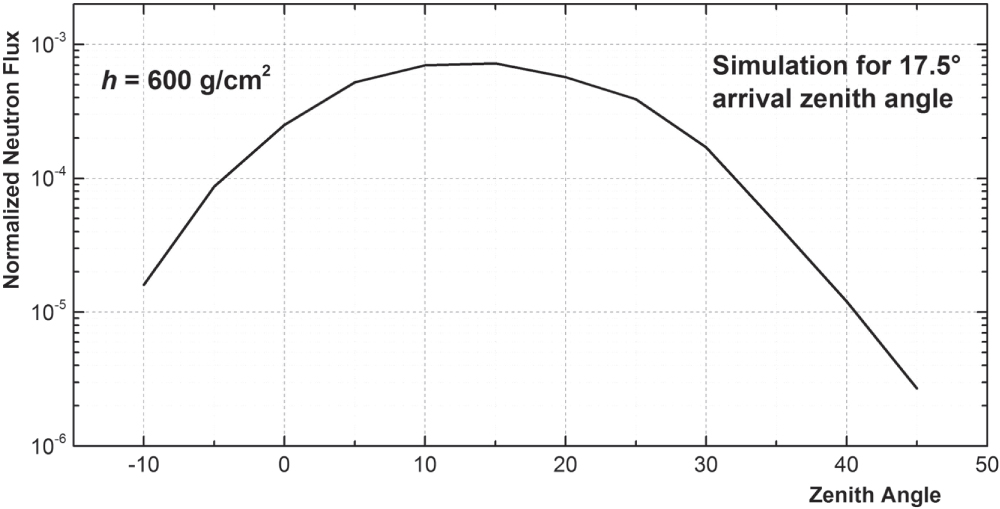
Standard image High-resolution imageThe Sun position at the sky for the time of the solar flare was 175 zenith. Figure 5 shows the atmospheric attenuation of neutrons for an atmospheric depth of 600 g cm−2, calculated according to (Dorman & Valdés-Galicia 1999). The forward direction of the neutron attenuation is toward the west, and the neutron distribution is asymmetric in the forward direction.

Figure 5. Atmospheric attenuation-scattering of solar neutrons for 175 arrival zenith angle and atmospheric depth h = 600 g cm−2, based on (Dorman & Valdés-Galicia 1999). The neutron distribution is asymmetric to the west side, with a maximum around 15°. This asymmetry is noticeable when analyzing the counting rate percentages of the directional channels of the SNT (see the text).
Download figure:
Standard image High-resolution imageFigure 6 shows the distribution of data recorded by the 25 directional channels of the SNT at Sierra Negra, produced by the four gondolas of PRCs below the scintillators. The largest neutron increase (11.5 ± 3.1%) was measured in the central channel, which corresponds to zero (±7.5) zenith angle. The next highest counts were at the channel west of central, with 7.8 ± 1.6%. These results are in agreement with the estimated asymmetrical distribution of the attenuation of neutrons (see Figure 5). Thus, the atmospheric scattering of neutrons causes the central channel of the SNT to have the greatest percentage of counts during the time that the solar flare neutrons arrived at Sierra Negra.

Figure 6. Percentage of solar neutron increases registered by the 25 directional channels of the SNT at Sierra Negra, due to the 2005 September 7 X17.0 solar flare. The darker central area represents the largest number of neutrons detected, during the time of the flare.
Download figure:
Standard image High-resolution image3. A NEW ANALYSIS OF THE SOLAR NEUTRON DATA
For this event, in (Sako et al. 2006) we calculated a power spectrum using data from the Chacaltaya NM, assuming that the neutrons were emitted with the same profile as the hard X-rays and gamma rays. We considered the time of flight of neutrons from the Sun to the Earth. Additionally, we used the Shibata's program to calculate the attenuation of neutrons in the Earth's atmosphere (Shibata 1994), and the efficiency of the NM based on Clem & Dorman (2000). We estimated an energy spectrum in the Sun as a power-law function with an index (α) α = 3.2.
In Watanabe et al. (2007), we used the time profile of the data observed by the Chacaltaya NM and calculated the spectrum of neutrons emitted as a power law with a cut at 500 MeV, based on a solution of the transport equation. The atmospheric attenuation of solar neutrons was calculated based on (Shibata 1994) and the efficiency of the NM by (Clem & Dorman 2000). We used the time profile of the emission line at 4.4 MeV (12C) as a hypothetical profile of the solar neutron production. These results show a spectral index of the emission of neutrons of α = 3.1 for this solar flare.
In (Sako et al. 2008), we used the data of the SNT at Sierra Negra with 2-minute counting rates and integrated the counts of each channel recorded between 17:30 UT and 18:30 UT. To determine the excess, background counts were calculated by adjusting a third order polynomial, excluding the range of 17:30–18:30 UT. To estimate the response of the SNT, we made use of the GEANT 3 code, where neutrons were injected and distributed uniformly over the SNT with vertical direction. It was considered that the neutron energy spectrum had a power law in the Sun. We calculated the neutron β-decay and the neutron attenuation in the Earth's atmosphere, based on Shibata (1994).
In the present analysis, we use 1-minute counting rate data from the four neutron channels of the SNT at Sierra Negra (S1_with_anti, S2_with_anti, S3_with_anti and S4_with_anti). The probability of detection of the SNT was calculated using the GEANT4 code. It is known that the GEANT4 code (Agostinelli et al. 2003) responds better to the physics of hadronic interactions and eliminates programming errors remaining in GEANT3. In addition, we reduced the integration time of the data by considering only the interval 17:40–18:05 UT, when there is a clear excess of counts above the reference line in all of the neutron channels; we therefore believe that this time interval better represents the time when solar neutrons were detected; the temporal resolution used is a further help in this endeavor. As the increase is clearly over the baseline between 17:40 UT and 18:05 UT these counting rates were used to calculate the excess over the baseline, and the spectral index of primary neutrons.
Figure 7 shows the data for channel S1_with_Anti (E > 30 MeV) with 1-minute resolution. The excess of neutrons emitted in the solar flare is clearly noticeable. The dashed line corresponds to the background radiation, calculated by a third order polynomial, omitting data from 17:40 UT to 18:05 UT. Figure 8 shows the probability of detection of the four channels of energy deposition of the SNT, according to the kinetic energy of the incident neutrons injected at the top of the SNT, calculated based on the GEANT4 simulations. It can be seen that a significant contribution to the registered counts comes from neutrons with energies of several hundred MeV. We calculated the probability of the detection of each channel of the SNT as a function of kinetic energy of the incident neutrons. The neutrons were distributed uniformly over the detector, with a zenith angle of 0°.

Figure 7. 1-minute neutron counting rate for the S1_with_anti channel (Edep > 30 MeV) of the SNT at Sierra Negra. The dashed line corresponds to the background calculated with a third order polynomial. The horizontal bar represents the time interval (17:40–18:05 UT) used to integrate the total surplus flux. The gray points represent the simulated time profiles of the SNT, assuming that the emission of neutrons follows the gamma-ray flux time profile (according with Watanabe et al. 2006). The neutron excess is clearly observed.
Download figure:
Standard image High-resolution image
Figure 8. Response of the four neutron channels of the SNT at Sierra Negra according to the GEANT4 simulations. The probabilities of detection for each channel are calculated as functions of the kinetic energy of the neutrons at the top of the SNT. In these calculations, the neutrons were distributed evenly over the detector, with a vertical injection angle (0° zenith).
Download figure:
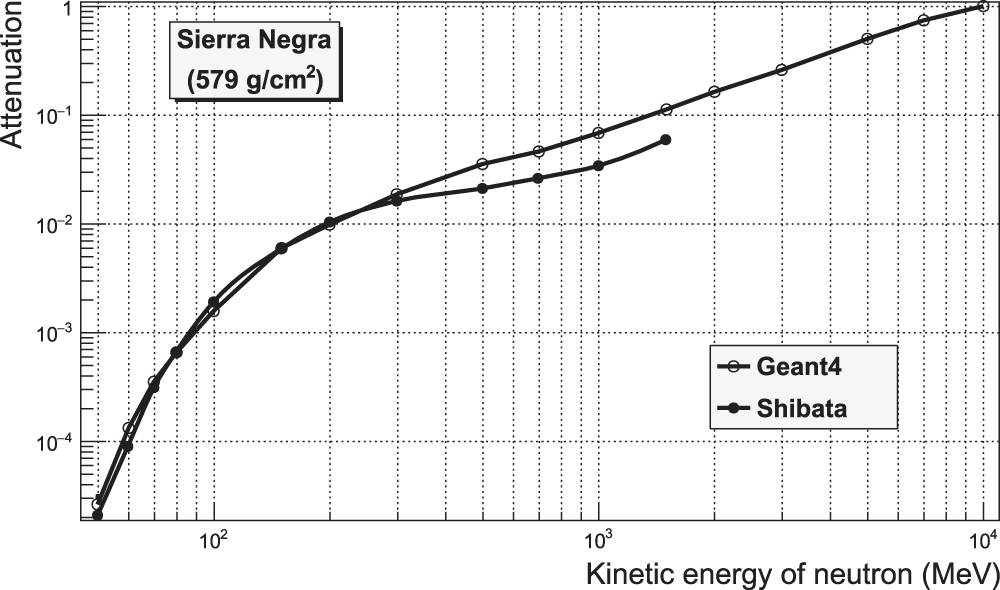
Standard image High-resolution imageFor this solar event, we assumed that the energy spectrum of the solar neutrons had a power law, as was done in previous studies (Watanabe et al. 2006). We estimated the β-decay of neutrons during their travel from the Sun to the Earth. The neutron attenuation in the atmosphere was calculated by a GEANT4 simulation that includes the mass they crossed on their way to the SNT at the time of the event. The attenuation results are in good agreement with previous works (Shibata 1994 and Dorman & Valdés-Galicia 1999).
Figure 9 presents the atmospheric attenuation of the neutrons at the height of Sierra Negra, calculated with a GEANT4 based code, compared with previous Monte Carlo simulation results by Shibata. Results are almost identical below 400 MeV; no significant differences are found for higher energies. The distribution of the simulated neutrons was in accordance with the energy and direction defined in (Shibata 1994).
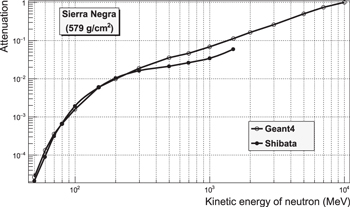
Figure 9. Atmospheric attenuation of the neutrons at Sierra Negra. It shows that the GEANT4 simulation is in good agreement with previous Monte Carlo simulations by Shibata.
Download figure:
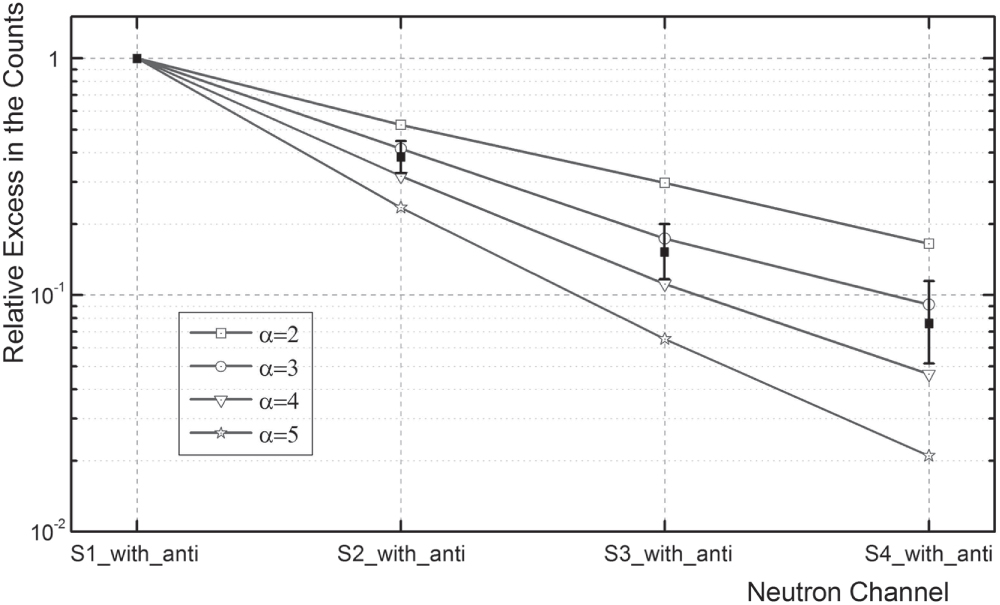
Standard image High-resolution imageAssuming different power-law indexes (from α = 2 to α = 5), the counts produced by the numerical simulation were normalized to the channel S1_with_anti and plotted in Figure 10. To calculate the spectral index of primary neutrons that best fits the results of the simulation, each of the four channels' excess counts were integrated between 17:40 UT and 18:05 UT, on 2005 September 7, and plotted over the curves produced by the simulations. The spectral index that best fits the solar neutron flux detected is about 3, which is consistent with the results shown in the earlier publications. Two of these (Watanabe et al. 2007 and Sako et al. 2008) make use of a completely independent source of information. It is emphasized that for this solar neutron event, the neutron emission was assumed to be produced with the time profile of hard X-rays.
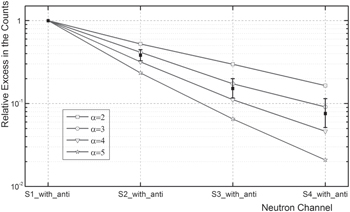
Figure 10. Relative excess of the four channels neutron counts of the SNT, for the solar flare of 2005 September 7 with error bars. The lines show the expected counts for different neutron spectra, calculated as a power law with an index from α = 2 to α = 5, based on the GEANT4 simulations of the SNT performance.
Download figure:
Standard image High-resolution imageThe results of the spectral index calculation made in (Sako et al. 2006) and (Watanabe et al. 2007) are based on analyses of the NM data from Chacaltaya and the gamma-ray production profile at the Sun. In Sako et al. (2008), data from the SNT at Sierra Negra with 2=minute counting rates were used. The neutron excess was estimated with integrated counts from 17:30 to 18:30 UT. Numerical simulations were performed using the GEANT3 code.
To remove the uncertainties of the calculation of the detection probability GEANT3 produces about neutron production, in this work we used the GEANT4 code to ensure that in the calculation of the detection probability the simulation unequivocally registered solar neutrons, as the code makes certain that they are detected in a single process.
Figure 4 shows that the excess counts for the analyzed event are significant in the four neutron channels, (from E > 30 MeV, up to E > 120 MeV); based on González et al. (2010), the different SNT channels may be used to estimate the energy deposited by the impinging neutrons as a function of the incident energies. According to Figure 11, neutrons must reach the top of the SNT with an average energy of at least 600 MeV in order to deposit 120 MeV or more into the scintillator, to be detected by the channel S4_with_anti. As stated above, the statistical significance of the counting rates observed in the E > 120 MeV channel is 7.8σ.
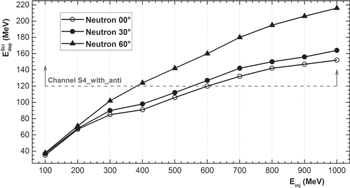
Figure 11. Relationship between the primary energy (Einj) of neutrons and the average energy deposited in the Scintillators of the SNT at Sierra Negra, by these neutrons, for the three different zenith angles (González et al. 2010).
Download figure:
Standard image High-resolution imageFigure 12 presents the results of the simulation of impinging neutrons at the top of the SNT, depositing ≥120 MeV in the scintillators. It shows the primary energy of the neutrons (Einj) and the percentage of neutrons that deposited at least 120 MeV into scintillators, and they are detected by the S4_with_anti channel. With the distribution obtained, we calculated that the primary neutrons with energies between 600 and 1000 MeV constitute 80% of the neutrons that deposit at least 120 MeV into the scintillators of the SNT at Sierra Negra, and it confirms that very high-energy solar neutrons were detected.

Figure 12. Percentage of impinging neutrons at the top of the SNT, depositing an energy ≥120 MeV into the scintillators. It can be seen that 80% of the neutrons that deposited at least 120 MeV have an Einj between 600 and 1000 MeV.
Download figure:
Standard image High-resolution image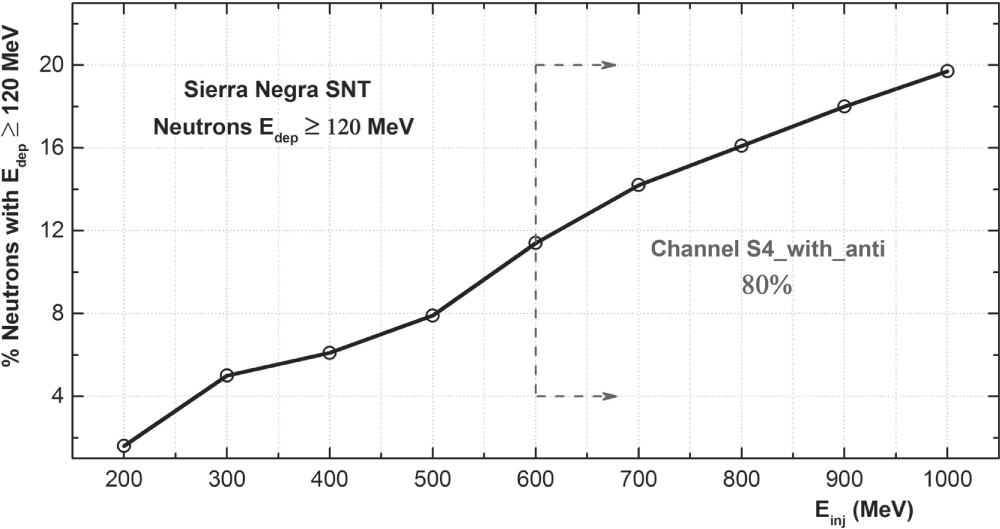
Based on the combination of experimental and numerical simulation in the results presented above, we may estimate that a significant portion of the neutrons detected in the SNT at Sierra Negra must have had energies near 1 GeV. As neutrons are the product of proton–proton and alpha-proton nuclear collisions in the corresponding active region in the solar atmosphere, it is very plausible that these protons were accelerated to energies of up to 10 GeV. As the solar flare whose products were analyzed here was an east limb flare, any charged particles flowing from this site to the interplanetary medium would be guided by the interplanetary magnetic field to regions far from the Earth, thus it is therefore very unlikely that these high-energy particles were observed from our planet or the spacecraft in orbit around it.
In Watanabe et al. (2007), it was necessary to introduce a sharp cutoff at 500 MeV in the energy at the top of the atmosphere in order to explain the ascending portion of the time profile in the Chacaltaya NM. In this work, we do not consider that cutoff, as we use the data detected by the Sierra Negra SNT and the results of the detector numerical simulations.
4. CONCLUSIONS
Analyzing the data of solar neutrons detected by the SNT at Sierra Negra for the flare of 2005 September 7, we showed that the excesses in the different energy channels have different responses; they are therefore sensitive to the spectrum of primary neutrons.
Based on the assumption of a power-law-type spectrum at the source, we calculated the spectral index of the solar neutrons detected by the SNT at Sierra Negra, based on a longer time series of data with better time resolutions, using only the most evident excess counts in the four neutron energy channels. The results show that the power-law spectral index that best fits the neutron flux produced in the flare of 2005 September 7 is about 3. This result is consistent with previous estimates based on similar or completely independent sources of information. Considering all the characteristics of this event, we may conclude that the emission of neutrons was continuous and contemporary with that of gamma-ray flux.
As the solar neutrons are essentially unaltered by the electromagnetic fields between the source and the top of the Earth's atmosphere, it is very likely that the resulting spectrum corresponds to the source spectrum.
It would be interesting to have solar flare events where both neutrons and charged particles were detected by the SNT, to try to infer production and transport characteristics from the differences observed in their fluxes, and as shown in (Bieber et al. 2005b), to model the injection of both neutron and proton flux and to calculate the timing information of the accelerated particles.
Based on the results of energy deposition obtained with the numerical simulations, and the high significance of the observed signal at the highest neutron energy channel, we may conclude that the Sierra Negra SNT detected neutrons with at least 1 GeV energy.
The protons that were involved in the production of these neutrons during the solar flare could well have had an energy of around 10 GeV. These protons were not detected at Earth, since the event was produced by an east limb solar flare. To the best of our knowledge, the evidence presented here constitutes the first calculation of the solar flare acceleration capability based on the detection of solar neutrons.
This work was partially supported by the grants PAPIIT IN114612, CONACyT 180727, and CONACyT AEM-2014-01-247722. We thank Engr. Miguel Ángel García Palacios for the technical support.