


ABSTRACT
We report multifrequency phase-referenced observations of the nearby radio galaxy NGC 4261, which has prominent two-sided jets, using the Very Long Baseline Array at 1.4–43 GHz. We measured radio core positions showing observing frequency dependences (known as "core shift") in both approaching jets and counterjets. The limit of the core position as the frequency approaches infinity, which suggests a jet base, is separated by 82 ± 16 μas upstream in projection, corresponding to (310 ± 60)Rs (Rs: Schwarzschild radius) as a deprojected distance, from the 43 GHz core in the approaching jet. In addition, the innermost component at the counterjet side appeared to approach the same position at infinity of the frequency, indicating that cores on both sides are approaching the same position, suggesting a spatial coincidence with the central engine. Applying a phase-referencing technique, we also obtained spectral index maps, which indicate that emission from the counterjet is affected by free–free absorption (FFA). The result of the core shift profile on the counterjet also requires FFA because the core positions at 5–15 GHz cannot be explained by a simple core shift model based on synchrotron self-absorption (SSA). Our result is apparently consistent with the SSA core shift with an additional disk-like absorber over the counterjet side. Core shift and opacity profiles at the counterjet side suggest a two-component accretion: a radiatively inefficient accretion flow at the inner region and a truncated thin disk in the outer region. We proposed a possible solution about density and temperature profiles in the outer disk on the basis of the radio observation.
Export citation and abstract BibTeX RIS
1. INTRODUCTION
It is widely believed that the release of gravitational energy from a disk of accreting matter onto a supermassive black hole generates a huge amount of energy in active galactic nuclei (AGNs). Energy and matter can be ejected in the form of jets, which have relativistic velocities and emit nonthermal radiation. The jets of radio galaxies develop from the central engine beyond their host galaxy and are characteristically narrow. Very long baseline interferometry (VLBI) images of AGNs often reveal a "radio core," a region of peak intensity generated by a compact component at the apparently upstream end of the jets.
The radio cores of blazars or BL Lacertae objects manifest as standing shock points up to (104–106)Rs (Schwarzschild radius) distant from the black hole (Jorstad et al. 2001, 2005; Marscher et al. 2008). In other objects, such as the M87 galaxy, the central engine is located within a few tens of Rs from the 43 GHz radio core (Hada et al. 2011).
The M87 result was obtained by measuring core shifts, defined as the positional change of the core at different frequencies caused by absorption of the jet base. The infinite-frequency extrapolation of the core position can be interpreted as the origin of the jet. Hada et al. (2011) estimated the position of the central engine of M87 by measuring the core shifts at varying frequency and observing an exterior source as a phase reference.
The absorption processes that cause core shifts are synchrotron self-absorption (SSA) and free–free absorption (FFA). In SSA, the core is located at the position of unity opacity. SSA opacity depends on physical conditions of the jet, such as the luminosity, structure, velocity, and inclination, as well as the observed emission frequencies. Besides M87, this type of core shift has been measured in 3C 395 (Lara et al. 1994), 3C 345 (Lobanov 1998), and M81 (Bietenholz et al. 2004), among others (Kovalev et al. 2008; Sokolovsky et al. 2011).
Core shifts arising from FFA potentially provide information on the size, density, and temperature of the absorbing material. FFA absorbers existing within subparsec distances have been suggested in some objects such as 3C 84 (Vermeulen et al. 1994; Walker et al. 1994), CenA (Tingay & Murphy 2001), CygA (Krichbaum et al. 1998), and NGC 1052 (Kameno et al. 2001). Core shifts have also been reported in CygA and NGC 1052 (Kadler et al. 2004).
Measurements of core shifts and studies of the distributions of a spectral index require an unambiguous reference position when comparing core positions at different frequencies and overlaying images collected at different frequencies. Previous studies were performed properly using optically thin jet components as reference positions (e.g., Kameno et al. 2001; Kovalev et al. 2008; Sokolovsky et al. 2011) or an exterior source by a phase-referencing technique (e.g., Sudou et al. 2003; Hada et al. 2011). However, some aspects of core shifts remain elusive. Although the extrapolation of core positions to infinite frequency is supposed to locate a central engine, it is a working hypothesis. The only thing we can claim rigidly is that a central engine and a black hole exist somewhere upstream of observed cores, as far as measurements performed on single-sided jet sources. Previously, core shift measurements in both approaching jets and counterjets have been attempted for NGC 1052 under the lack of a common reference position over observing frequencies; however, multiple candidates for the location of the central engine are discussed (Kadler et al. 2004). A core position was frequently assumed as the reference position in previous studies, for example, when spectral index maps were made. However, as discussed above, this may alter with frequency because of absorption. To resolve these problems, we supplement the analysis of a two-sided jet source with phase-referencing observations. NGC 4261 is a suitable AGN candidate on which this technique is applied.
NGC 4261 (3C 270) is a nearby Fanaroff–Riley Class I (FR-I) radio galaxy. It is characterized by nearly symmetric kiloparsec-scale two-sided jets (Birkinshaw & Davies 1985). The galaxy is 31.6 Mpc distant from the Earth (Tonry et al. 2000), corresponding to 0.15 pc mas–1. This proximity presents an advantage for studying regions within 1 pc of the central engine. The NGC 4261 nucleus is known to contain a central black hole of mass  (Ferrarese et al. 1996). Hubble Space Telescope observations have also revealed a disk of gas and dust, having a diameter of 300 pc, in the NGC 4261 nucleus (Jaffe et al. 1993).
Another feature of NGC 4261, revealed by VLBI studies, is its prominent parsec-scale two-sided jet along large-scale jets, running parallel to the rotation axis of the dust disk (Jones et al. 2000). The west- and east-side jets are approaching and receding to observers, respectively; the latter is known as a counterjet. The brightness of both jets is slightly affected by relativistic beaming. Piner et al. (2001) estimated the speed of the jets by Very Long Baseline Array (VLBA) monitor observations at 8 GHz. From the jet-to-counterjet brightness ratio and apparent speed, they obtained a gentle intrinsic jet velocity of about  , inclined at
  from the line of sight.
NGC 4261 is further characterized by an apparent discontinuity in the structure of the counterjet. This region, called the "gap," has been interpreted as obscuration by an edge-on, geometrically thin, cold parsec-scale disk with a temperature of  K (Jones et al. 2001). As an alternative to the FFA disk model, the gap may arise from resistive radiatively inefficient accretion flow (RIAF) (Kaburaki et al. 2010). According to Kaburaki et al. (2010), the low temperature of the standard disk model (Shakura & Sunyaev 1973) precludes the existence of FFA plasma gas in a gap region so distant from the central black hole.
The present study aims to determine the position of the central engine in NGC 4261 and investigate the structure of the absorber. In Section 2, we explain the phase-referencing method from multifrequency observations and core shift measurements. Section 3 is devoted to core shift results and spectral index maps. The position of the central engine, the interpretation of the core shift, the absorption process, and the disk model of NGC 4261 are discussed in Section 4. Section 5 concludes the paper.
2. OBSERVATIONS AND DATA REDUCTION
2.1. Observations
Multifrequency observations of NGC 4261 were conducted using the VLBA (Napier 1994) at four frequency bands (1.4, 2.3, 5.0, and 8.4 GHz) on 2003 July 3, and at three frequency bands (15, 22, and 43 GHz) on 2003 June 26. The two sets of observations were separated by only 7 days. Each observation period was approximately 12 hr. At 1.4 GHz, dual-circular polarizations at two intermediate frequencies (IFs) were received, covering a total bandwidth of 16 MHz. At both 2.3 and 8.4 GHz, two IFs covered a total bandwidth of 16 MHz in right-hand circular polarization. Other frequency bands collected four IFs, covering a total bandwidth of 32 MHz in left-hand circular polarization. Digital sampling of 2 bits was applied at all observational frequency bands. Correlations were processed using the VLBA correlator in Socorro, New Mexico.
The radio core positions of NGC 4261 were measured by the nodding-style phase-referencing technique, relative to a nearby reference source, J1222+0413, separated by less than 2° from NGC 4261:·-T-C1-T-C1-T-·, where T and C1 represent the target and primary calibrator, respectively. Switching between the target and calibrator was repeated after scanning for 20 s. Observations were conducted for approximately 20 minutes at each frequency in turn. Under this measurement condition, the uv-coverage among frequencies was almost identical, thereby minimizing the residual systematic errors in astrometry. The total on-source time on the target was approximately 1 hr at each frequency.
2.2. Calibration and Imaging
The antenna parallactic angles and Earth orientation parameters were corrected. Furthermore, ionospheric dispersive delays were corrected using the ionospheric model from GPS data provided by the Jet Propulsion Laboratory (Mannucci et al. 1999). Instrumental delays/phases and bandpass were calibrated using 3C 273 data. Assuming a point-source model, we performed fringe-fitting on J1222+0413 as a phase calibrator C1. Subsequently, we calibrated the visibility amplitude and phase using a source structure model available in the Difmap software (Shepherd et al. 1994) procedures. This model is based on iterative deconvolution and self-calibration algorithms. Applying these solutions to the visibilities of NGC 4261, we obtained phase-referenced images of NGC 4261. On the other hand, we also made self-calibrated images for NGC 4261 using the Difmap (Figure 1).

Figure 1. Self-calibrated images of NGC 4261 at each frequency from VLBA observations. The gray ellipses show the synthesized beam size (FWHM). The rms noise in the images at each frequency is provided in Table 3. Contours start at the  level, increasing by factors of
  .
.
Download figure:
Standard image High-resolution image2.3. Core Position Measurement
The source position in the phase-referenced images was measured using JMFIT in AIPS (Greisen 2003), adopting a single-ellipse Gaussian profile model. However, we consider that, because the core and jets were blended, the core position potentially drifted toward the jet side from its true position. The jet contribution was evaluated by comparing results by two methods of measuring the core position in final (self-calibrated) images of NGC 4261 and J1222+0413: one-component JMFIT and fitting of visibility data to multiple circular Gaussian components using modelfit in Difmap (Figure 2). The final core position was defined as the positions between the core in the phase-referenced image of NGC 4261 with the correction of jet contribution on its final image and the core of J1222+0413 in the final images with the correction of jet contribution.

Figure 2. Contour image of NGC 4261 at 8 GHz and overlaid fitted components as an example for circular Gaussian model fitting using modelfit in Difmap.
Download figure:
Standard image High-resolution imageFollowing the method of Hada et al. (2011), we estimated the error in our astrometric measurements. The error incorporates ionospheric residuals, tropospheric residuals, antenna positional error, Earth orientation error, a priori source coordinate error, core identification error, and thermal noise. The error contributions are listed in Table 1. Based on GPS data, we assume a total electron content of  , which is reducible to 1/4 equivalent following ionospheric residual correction by TECOR in AIPS (Mannucci et al. 1999). The zenith excess path error in tropospheric residuals is assumed to be 2 cm (Beasley & Conway 1995). We adopted proper geometric errors such as antenna location error (3 mm), Earth orientation parameter error (VLBA memo 69), and a priori source coordinate error that is determined from source declination (Pradel et al. 2006). The core identification error was estimated from the difference in core positions yielded by the above-described two fitting methods. The thermal noise error was defined by the beam size over the dynamic range of phase-referenced maps.
Table 1. Error Budget (μas)
| Frequency [GHz] | 1.4 | 2.3 | 5.0 | 8.4 | 15 | 22 | 43 |
|---|---|---|---|---|---|---|---|
| Phase-referencing observation | |||||||
| Beam width/signal-to-noise ratio | 52 | 24 | 10 | 6 | 4 | 3 | 2 |
| Ionosphere | 2006 | 779 | 161 | 57 | 17 | 8 | 2 |
| Troposphere | 13 | 13 | 13 | 13 | 13 | 13 | 13 |
| Earth orientation | 5 | 5 | 5 | 5 | 5 | 5 | 5 |
| Antenna position | 2 | 2 | 2 | 2 | 2 | 2 | 2 |
| Apriori source coordinates | 1 | 1 | 1 | 1 | 1 | 1 | 1 |
| Core identification analysis | |||||||
| Approaching jet | 349 | 60 | 17 | 40 | 3 | 5 | 3 |
| Counterjet | 343 | 26 | 5 | 50 | 326 | 312 | 19 |
| Total error (RSS) | |||||||
| Approaching jet | 2055 | 792 | 170 | 77 | 30 | 23 | 19 |
| Counterjet | 2054 | 790 | 169 | 82 | 328 | 313 | 25 |
Notes. According to the method of Hada et al. (2011), error estimation was made for our astrometric measurements in NGC 4261.
Download table as: ASCIITypeset image
3. RESULTS
3.1. Multifrequency CLEAN Images
Figure 1 shows the (self-calibrated) CLEANed images from uniformly weighted visibilities at each frequency; the corrections of relative positions in R.A., which were determined by phase-referencing (Section 2.3), have been applied in Figure 3. The beam sizes and image qualities are listed in Table 2. Approaching jets and counterjets, extending west and east from the brightest region (core), respectively, appear in the images at  15 GHz clearly. The counterjet is not so prominent in the image recorded at 22 GHz, while no obvious jet-like structures are visible in the 43 GHz image. However, both approaching jets and counterjets were clearly detected as model components of modelfit in Difmap. The lower the frequency, the more extended and symmetric the jets.

Figure 3. All frequency images, aligned relative to the 43 GHz core (accounting for core shifts).
Download figure:
Standard image High-resolution imageTable 2. Image Performance
| ν | Ipeak | σ | θmaj | θmin | θp.a. |
|---|---|---|---|---|---|
| (GHz) | (mJy beam–1) | (mJy beam–1) | (mas) | (mas) | (deg) |
| (1) | (2) | (3) | (4) | (5) | (6) |
| 1.4 | 47.4 | 0.50 | 8.90 | 4.45 | 5.5 |
| 2.3 | 70.1 | 0.69 | 5.41 | 2.60 | 1.1 |
| 5.0 | 117.1 | 0.40 | 2.47 | 1.19 | 0.06 |
| 8.4 | 101.6 | 0.60 | 1.51 | 0.69 | 0.95 |
| 15 | 113.4 | 0.71 | 0.85 | 0.37 | −5.0 |
| 22 | 123.2 | 1.27 | 0.55 | 0.27 | −3.1 |
| 43 | 72.9 | 0.94 | 0.30 | 0.16 | −2.8 |
Notes. Columns are as follows: (1) frequency; (2) peak intensity; (3) image rms noise; (4) major axis size of the synthesized beam; (5) minor axis size of the synthesized beam; (6) position angle of the synthesized beam.
Download table as: ASCIITypeset image
Table 3. Core Positions
| ν | rAJ | rCJ |
|---|---|---|
| (GHz) | (mas) | (mas) |
| (1) | (2) | (3) |
| 1.4 | −4.92 ± 2.06 | 4.74 ± 2.05 |
| 2.3 | −2.98 ± 0.79 | 2.73 ± 0.79 |
| 5.0 | −1.18 ± 0.17 | 1.97 ± 0.17 |
| 8.4 | −0.52 ± 0.08 | 1.60 ± 0.08 |
| 15 | −0.21 ± 0.03 | 0.73 ± 0.33 |
| 22 | −0.12 ± 0.02 | 0.29 ± 0.31 |
| 43 | 0 ± 0.02 | 0.17 ± 0.03 |
Notes. Columns are as follows: (1) frequency; (2) core position in approaching jet with respect to the core at 43 GHz; (3) core position in counterjet with respect to the core at 43 GHz in approaching jet.
Download table as: ASCIITypeset image
3.2. Core Shift Measurement
The determined core positions at 1.4–43 GHz are plotted on the 5 GHz self-calibrated image of NGC 4261 in Figure 4. The core appears to shift northwestward as the frequency decreases. The jet of the reference source J1222+0413 is oriented nearly perpendicular to that of NGC 4261 (toward the south, whereas the NCG 4261 jet tends to the west; see Figure 5). For this reason, the observed core shifts compose the sum of core shifts of both sources. Therefore, we decomposed the observed core shift into a westward shift for NGC 4261 and a northward shift for J1222+0413.
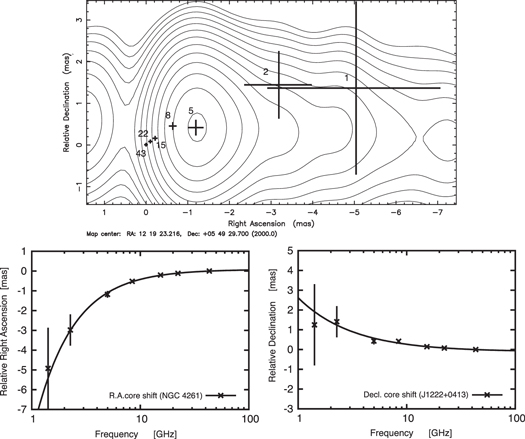
Figure 4. Top: crosses denote observed core positions, on the approaching-jet side at each frequency, relative to the 5 GHz core on the same image. The thin contours denote the 5 GHz self-calibrated image. The core positions appear to drift northwest as the frequency is lowered. Given the jet directions of NGC 4261 and J1222+0413, NGC 4261 is responsible for the core shift in the R.A. direction, while J1222+0413 is responsible for the decl. shift. Bottom left: shift in core position in R.A. as a function of frequency, attributable to NGC 4261. The solid line is the least-squares fitted function. Bottom right: frequency dependence of the decl. shift in core position, caused by J1222+0413.
Download figure:
Standard image High-resolution image
Figure 5. Self-calibrated image of J1222+0413 at 5 GHz. The jet extends to the south, almost perfectly perpendicular to the jet of NGC 4261.
Download figure:
Standard image High-resolution image The east–west structure of NGC 4261's jet appears slightly fluctuating in the north–south direction. On the approaching side, the jet gradually inclines toward south beyond ∼4 mas from the 43 GHz core. We analyzed the ridge line in the 5 GHz image and measured its deviation to be −0.24 mas southward at −5 mas, where the core at 1 GHz is found. This southward deviation is used to correct the core position at 1 GHz for the final image to be used for making a spectral index map (Section 3.3). On the other hand, in the innermost region, the jet shows an S-shaped structure at 15–43 GHz images. The measured position angle of the jet is  in the 43 GHz image, while it is
  up to 1.5 mas from the core in the 15 GHz image. The amplitude of the S-shape is only ∼50 μas, which is much smaller than the scale of core shifts in J1222+0413 and NGC 4261. We do not take into account this north–south deviation for the final results of the core shift and the spectral index maps.
Figure 4 reveals that the core position of NGC 4261 shifts at all other observational frequencies relative to the 43 GHz core. By least-squares fitting, the core position is found to shift as a power-law function of frequency, that is,

where  , Ω, k, and b are projected (east–west) distance from the 43 GHz core, free-fitting parameters representing a scale factor, a power-law index, and an asymptotic limit at infinite frequency, respectively (solid curves in Figure 4). At the approaching-jet side, these values are determined as
  ,
,  , and
, and  , respectively, with residuals
  /n.d.f = 0.16 (see Table 4). This reduced
  is very small because we estimated the core positional errors conservatively. The core positional errors could be actually smaller than our estimations. As a result, the free-fitting parameters, Ω, k, and b, are determined with an uncertainty of 10%, 5%, and 20%, respectively. The value of k suggests a possible excess over the theoretical value of unity predicted for SSA under the equipartition condition and as frequently observed (Lobanov 1998; O'Sullivan & Gabuzda 2009; Hada et al. 2011; Sokolovsky et al. 2011). The asymptotic parameter b was determined within a tolerance of 32 μas (≈120 Rs) and separated by 82 μas (≈310 Rs) from the 43 GHz core position.
Table 4. Core Shift Fitting Parameters
| Ω | k | b | χ2/n.d.f | |
|---|---|---|---|---|
| (1) | (2) | (3) | (4) | (5 ) |
| r(ν) | −8.42 ± 0.86 | 1.22 ± 0.06 | 0.082 ± 0.016 | 0.66/4 |
Notes. Columns are as follows: (1) fitting function (Equation (1)); (2)–(4) parameters of core shift fitting; (5) reduced chi-square.
Download table as: ASCIITypeset image
We also measured and fitted the core shift at the counterjet side of NGC 4261. In this study, the core of the counterjet is defined as the closest east-side component to the core of the approaching jet, the region of maximum intensity yielded by modelfit. As shown in Figure 6, the distance between the cores in the approaching jets and counterjets reduces as the frequency increases. When the shifting core of the counterjet was fitted to a three-parameter model, we obtained  ,
,  , and
, and  , respectively. However, these errors have little contribution for confining the position of the central engine. This suggests that a simple power law is insufficient to represent the profile of the counterjet side. Hence, we applied two alternative model fitting procedures imposing further assumptions, which will be discussed in Section 4.3.

Figure 6. Core shift profile on both sides of the jet in NGC 4261. Bars and crosses denote the core positions of the approaching jets and counterjets, respectively. The solid line is a function fitted by the least-squares method for the approaching side ( in Figure 4). At the counterjet side, dashed and dot–dashed lines are predicted core shifts from the SSA model and the spherical FFA plasma model, respectively, assuming symmetry for the two-sided system. The parameters k and b equivalent to those of
  are used for the counterjet side. Given a viewing angle, Ω at the counterjet side is predicted in both models from the results of the approaching-jet side.
Download figure:
Standard image High-resolution image3.3. Spectral Index Maps
Spectral index (α,  ) maps were generated from final (self-calibrated and CLEANed) images between two adjacent frequencies using the AIPS task COMB. To ensure proper construction of spectral index maps, the images between the adjacent frequencies must spatially align, and their angular resolutions must match. The map coordinates at each frequency were aligned using the core shift relative to the 43 GHz core in right ascension and the jet axis of NGC 4261 in declination. The images at adjacent frequencies were convolved by rendering both beams equivalent to the beam at the lower frequency. The intensity below 3σ was clipped out before calculating the spectral index.
All of the spectral index maps exhibit common features, in particular, the spectral index peaks in the regions between the cores of the approaching jets and counterjets. As the jet extends further from the core, the spectral index becomes smaller. Figure 7 displays the spectral index maps of the 1–2 GHz and 5–8 GHz adjacent frequency pairs. Some regions show  which is the theoretical limit of SSA. This result is consistent with other observations in which the circumnuclear structure favored FFA over SSA (Jones et al. 2001). The spectral index gradients are clearly parallel to the jet axis for all frequency pairs. The restored beams in each map are too large to decompose the absorption structures across the jet. However, a transverse gradient marginally appears in 1–2 GHz and 2–5 GHz spectral index maps. We cannot rule out that the combination of the north–south fluctuation in the jet structure (Section 3.2) and remaining position errors in the east–west direction causes the apparent transverse gradient.
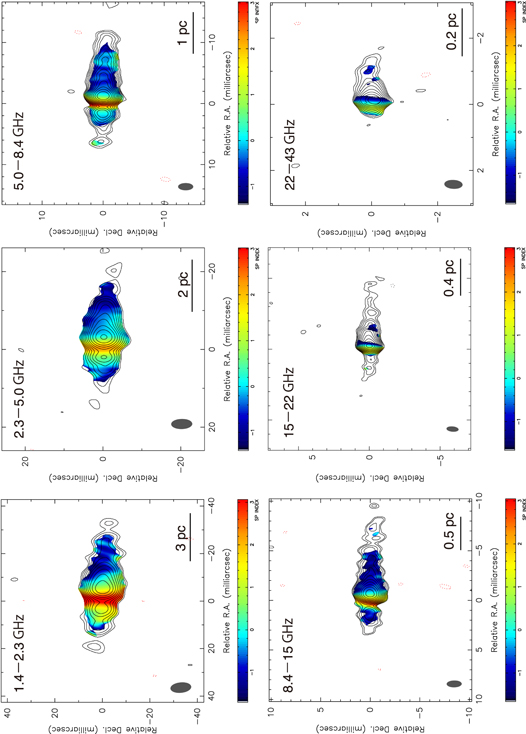
Figure 7. Spectral index maps of all adjacent frequencies. Overlaid contours are total intensity at the lower frequency.
Download figure:
Standard image High-resolution imageFigure 8 shows slice profiles of spectral index along the jet axis (from the east to the west). We estimated error components in the spectral index. We tentatively displaced one image eastward and westward with respect to the other image by our conservative positional error, in order to evaluate a spectral index error due to the positional error in overlaying two images. We also used the spectral error map, simultaneously produced during COMB processing, and assumed a conservative flux calibration error of 5% at  GHz and 10% at
  GHz. The total error represented by an envelope is the square root of the summed squares of these error components.

Figure 8. Spectral index profiles along jet axis at each pair of adjacent frequencies. Black regions represent estimated spectral index errors, consisting of the accuracy of the core position, the uncertainty of flux scaling, and image noises (see Section 3.3). Gray narrow lines represent median values.
Download figure:
Standard image High-resolution imageAt 8–15 GHz and lower-frequency pairs, a region of  appears in the slice profiles, suggesting an FFA mechanism, although the error is too high for a conclusive assessment. Another feature is that the curve at ν
  5 GHz peaks at the counterjet side. The peaks are located at the same positions, regardless of the error-induced displacement of the core position. At ν
  5 GHz, the peaks are located around the origin.
4. DISCUSSION
4.1. Position of the Black Hole in NGC 4261
First, we consider the relationships between the black hole positions and limiting core positions. Hada et al. (2011) showed that the central engine in M87 is located  distant from the observed core at 43 GHz in their analyses of core shift measurements. This study assumed that the asymptotic line, representing the origin of a jet, spatially coincides with the central engine. However, the core location in BL Lac, indicated as the standing shock point (Marscher et al. 2008), is actually 104RS–
 from the black hole, as determined from γ-ray monitoring observations (Albert et al. 2007). On the other hand, a core shift was discovered downstream of the BL Lac jet. Core shift measurements of BL Lac and other blazar sources revealed that the base of the jet is located
  from the 43 GHz core position (O'Sullivan & Gabuzda 2009). Recently, core shift data have accumulated at an accelerated pace for blazars (Sokolovsky et al. 2011; Pushkarev et al. 2012). However, the above-cited examples highlight the difficulty of proving assumptions from one-sided jets.
To overcome these limitations, we located the central engine in NGC 4261 by investigating a double-sided system and measuring the core positions of the approaching jet and the counterjet. As shown in Figure 9, the core (most upstream component) on the counterjet side resides at 0.17 ± 0.03 mas ( ) from the approaching-jet core at 43 GHz. The central engine and black hole must be situated at most 750 Rs distant from this core to ensure its location between the cores of both jets. Moreover, because the origin of the counterjet coincides with that of the approaching jet (as discussed later), the assumption that the origin of a jet spatially coincides with the central engine within the error tolerance is reasonable for NGC 4261. The center of activities was discussed using cross-identification of the Gaussian component models in multifrequency maps in other two-sided jet systems (e.g., Cygnus A, Krichbaum et al. 1998; NGC 1052, Kadler et al. 2004). For Cygnus A, a relatively distant source, the core shift in the counterjet has not been measured. Kadler et al. (2004) determined the position of the central engine in NGC 1052 with an uncertainty of ∼0.03 pc, corresponding to
  assuming
  (Woo & Urry 2002), from both sides of the jets. Our result for NGC 4261 is of higher accuracy and includes coordinates relative to 1222+0413 rather than relative to optically thin components in the source itself.
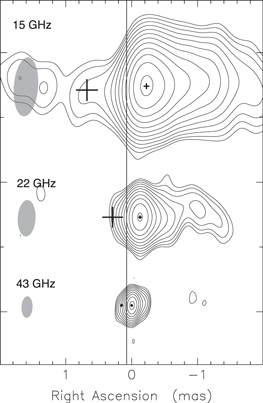
Figure 9. Enlarged image from a part of Figure 3 for ν  15 GHz within ±2 mas. The cross marks denote determined positions of innermost cores on each jet side. The line at R.A. = 0.082 ± 0.016 mas represents the determined position of the central engine.
Download figure:
Standard image High-resolution image4.2. Core Position at 43 GHz
The central engine of NGC 4261 is located at 82 ± 16 μ as, corresponding to  from the 43 GHz core. The core–central engine separation differs by orders of magnitude among NGC 4261, M87, and BL Lac, being larger and smaller in M87 and BL Lac, respectively, than in NCG 4261. The separation caused by a core shift is correlated with the strength of SSA and depends on jet characteristics such as luminosity, velocity, structure, radial profiles of density and magnetic field, the geometric relationship to our line of sight, velocity gradients, and/or their time variation. According to Lobanov (1998), if a jet is continuous, is uniform, is stationary, and travels with constant velocity, and under equipartition condition, the (projected) core shift from the jet origin is given by

where  and
and  ,
,  ,
,  , and θ denote the Lorentz factor, intrinsic jet velocity, jet opening angle from an observer (intrinsic opening angle
  ), and viewing angle, respectively. DL and Lsyn are the luminosity distance to the source (pc) and synchrotron luminosity (erg s−1). In this case, Θ depends on the jet structure, whether conical or parabolic, and does not usually exceed ln 3 for parsec-scale jets. The frequency ν is given in Hz. In the present study, the separation between the central engine and core position is determined at 43 GHz. Using Equation (2), we now compare the separation in NGC 4261 with those estimated in M87 and BL Lac. In place of Lsyn, we use the intrinsic luminosity at millimeter wavelengths, Lm. In order to remove the beaming effect from the observed luminosity
  , we calculate the beaming factor
  , where
 ![$D={\left[\gamma (1-\beta \mathrm{cos}\theta )\right]}^{-1}$](https://content.cld.iop.org/journals/0004-637X/807/1/15/revision1/apj509693ieqn48.gif) is the Doppler factor, using the viewing angle and intrinsic velocity for each source. Using
is the Doppler factor, using the viewing angle and intrinsic velocity for each source. Using  ,
,  for NGC 4261 (Piner et al. 2001) and
  erg s−1 (Geldzahler & Witzel 1981), we estimated a beaming factor of 1.5 and
  erg s−1, assuming
  . The parameters of NGC 4261, M87, and BL Lac are provided in Table 5.
Table 5. Parameters for Comparisons
| Object Name |

|
MBH | β | θ | D |

|
Lm |
|---|---|---|---|---|---|---|---|
| (Rs) | (108M⊙) | (1040 erg s−1) | (1040 erg s−1) | ||||
| (1) | (2) | (3) | (4) | (5) | (6) | (7) | (8) |
| NGC 4261 | 310 ± 60 | 4.9a | 0.46d | 63°d | 1.1 | 3.9h | 2.5 |
| M 87 | 23 ± 6 | 60b | 0.38–0.62e | 15°–25°g | 1.4–1.7 | 5.2i | 1.4 |
| BL Lac | 104–106 | 1.7c | ≧0.99f | 6°–10°f | 5.6–9.1 | 3.6 × 10³j | 1.0 |
Notes. Columns are as follows: (1) object name; (2) distance of core at 43 GHz from putative central engine; (3) black hole mass; (4) jet velocity in the unit of speed of light; (5) estimated viewing angle; (6) Doppler factor, ![$D\equiv {\left[\gamma (1-\beta \mathrm{cos}\theta )\right]}^{-1}$](https://content.cld.iop.org/journals/0004-637X/807/1/15/revision1/apj509693ieqn58.gif) ; (7) observed luminosity at millimeter wave range; (8) estimated intrinsic luminosity.
; (7) observed luminosity at millimeter wave range; (8) estimated intrinsic luminosity.
 –0.40 (Ly et al. 2007).
fJorstad et al. (2005).
gAcciari et al. (2009).
hGeldzahler & Witzel (1981).
iDavies et al. (2009).
jAgudo et al. (2010).
–0.40 (Ly et al. 2007).
fJorstad et al. (2005).
gAcciari et al. (2009).
hGeldzahler & Witzel (1981).
iDavies et al. (2009).
jAgudo et al. (2010).
Download table as: ASCIITypeset image
As a rough discussion, assuming that the jet opening angle is nearly constant6 under Equation (2), the ratio of the core–central engine (deprojected) separation to that of NGC 4261 in Rs units is given by
For the M87 case, the viewing angle of the jet is likely 15°–25° (Acciari et al. 2009), and apparent jet velocities of  –0.40 have been reported for the innermost region at 43 GHz (Ly et al. 2007). Under these situations, the intrinsic velocity would be
  –0.62. Assuming
  ,
,  and
and  erg s−1 (Davies et al. 2009), we obtain
  erg s−1. Adopting a black hole mass of
  (Gebhardt & Thomas 2009), we obtain
  . For
. For  and
and  , we obtain
  erg s−1 and
  . On the other hand, based on the core shift measurements, the 43 GHz core–central engine distance ratio of
  (M87) to
  (NGC 4261) is 0.07. The difference between the two results is not so large. The discrepancy may originate in uncertainties of the black hole mass or the intrinsic luminosity. Another possibility is the difference of opening angles between different sources. From Equation (2), the separation is inversely proportional to the opening angle. If the opening angle of M87 is widely larger (see Junor et al. 1999) than that of NGC 4261, it can explain the difference of the separation between them.
By contrast, the core shift in BL Lac substantially differs from that of NGC 4261. The estimated jet velocity and inclination are  and
and  –10°, respectively (Jorstad et al. 2005). Such conditions should enhance the relativistic beaming effect and indicate a beaming factor of
  . Since the observed luminosity was reported to be
  erg s−1, we estimate an intrinsic luminosity of
  erg s−1. The mass of the black hole associated with BL Lac is estimated to be
  (Woo & Urry 2002). Substituting these values into Equation (3), we obtain
  as an expected core shift, showing a large discrepancy from the result from γ-ray monitoring observations (∼30–3000; Albert et al. 2007; Marscher et al. 2008). To explain the large discrepancy, a much larger intrinsic luminosity of
  erg s−1 or a much smaller opening angle
  is necessary.
However, such a wide difference in intrinsic luminosity between NGC 4261 and BL Lac is quite unlikely if both FR-I radio galaxies and BL Lac objects are regarded as a common AGN population intrinsically (Urry et al. 1991). More likely, the appearance of FR-I radio galaxies and that of BL Lac objects differ because of the beaming effect imposed by jet inclination. The jet of M87 has a limb-brightened structure, which is probably associated with a fast spinal flow surrounded by a slow layer (sheath) (Ghisellini et al. 2005). If the jet axis inclines significantly from the line of sight, such as for M87 and NGC 4261 as FR-Is, sheath emission dominates because spinal emission is deboosted by the relativistic effect. On the other hand, if the jet is viewed from nearly pole-on, such as for BL Lac, spine emission from a small opening angle dominates. This phenomenon can explain the varying distance between the central engine and the 43 GHz core between FR-I radio galaxies and BL Lac objects.
4.3. What Causes the Core Shift
The physical causes of the core shift are considered as SSA and/or FFA. The core shift measurement for a two-sided system allows us to utilize a symmetry assumption for understanding the jet structure and surrounding circumstances and offers a critical advantage over studies for one-sided systems. Only the counterjet itself could not well describe its core shift profile (Section 3.2). In the following subsections we establish the model that best explains the core shift of NGC 4261, focusing on the results of fitting parameters in Equation (1).
4.3.1. SSA in Jets
First, we assume a pure SSA model. The physical conditions in the jet reflect the index of the core shift profile in Equation (1). In this model, ks (representing k for the SSA case) is given by

where α, m, and n denote the spectral index at the optically thin regime, the profiles of the magnetic field B (where  ), and the electron density N (where
  ), respectively (Blandford & Königl 1979). Assuming m = 1 and n = 2 as the profile indices, corresponding to the stabilization of jet energy in equipartition, ks invariably becomes unity regardless of the spectral index value. However, the fitting parameter on the approaching-jet side is
  , which possibly exceeds that from previous studies for other sources (
 ; i.e., M87, Hada et al. 2011; BL Lac, O'Sullivan & Gabuzda 2009; and 3C 345, Lobanov 1998), indicating that m and n in Equation (4) can take different values in NGC 4261.
We next predict the core shift profile on the counterjet side assuming the SSA model. If the jets are intrinsically symmetric, ks and b of the counterjet and approaching-jet sides should be identical. On the other hand, comparing Equations (1) and (2), we find that Ω depends on geometrical and intrinsic parameters of a jet. The parameter Ω differs between the approaching jet and counterjet only through the inclination, θ. Therefore, Ω of the counterjet and approaching-jet sides, denoted  and
and  , respectively, must satisfy
 . In other words, the position of the core at the same frequency is farther from the black hole in the approaching jet than in the counterjet. The parameter
  should be connected with
  by a difference of 180° in terms of viewing angle. The curve predicted by the pure SSA model (dashed line in Figure 6) can explain the core position at both low frequency (
 2 GHz) and high frequency (
 22 GHz). On the other hand, the observed positions of the core at 5, 8, and 15 GHz are significantly larger than those predicted by this model, implying that the SSA model alone lacks sufficient absorption to explain the core shift in these regions.
4.3.2. Spherical FFA Plasma
Another alternative is the FFA model. The spectral index maps indicate that FFA plasma exists at least in regions near the putative black hole. For simplicity, and from the parameters of the core shift measurement, we assume a spherical FFA plasma (see Appendix  becomes unity, kf (representing k in Equation (1) for the FFA model) is given by

where s and t represent the profiles of the electron density ne and temperature Te ( ,
,  ) in the FFA absorber, respectively. These parameters can be determined from the opacity profile; the denominator on the right-hand side of Equation (5) represents the index value of the opacity profile (
 ). We obtain the radial profile of FFA opacity on the approaching-jet side by fitting to a power-law function:
  (Appendix
  . It is consistent with the result of the core shift measurements (
 ), in spite of independent measurements of the core shift and the opacity. Theoretical speculations have indicated that kf exceeds unity (Lobanov 1998; Kadler et al. 2004). Thus, the core shift on the approaching-jet side can also be sufficiently interpreted by the spherical FFA model.
However, the spherical FFA is inconsistent with the radial profile of FFA opacity on the counterjet side. The parameter kf should be identical in both the approaching-jet and counterjet sides if the FFA absorber is symmetric. Ω reflects the path length of the absorber, that is, the geometrical structure of the absorber (for details, see Appendix  because the path length of the counterjet side is longer than that of the approaching one. The core-shift curve predicted by the spherical FFA plasma model (dot–dashed line in Figure 6) meets some of the core positions at
  5 GHz on the counterjet side. However, the core shifts at 1 and 2 GHz are inconsistent because their shifts are significantly smaller than those predicted by this model.
Therefore, neither of these simple models can explain the core shifts in this two-sided system.
4.3.3. SSA in Jet + FFA by the Disk
A possible solution is to combine the SSA core shift with an additional external absorber, which compensates for the inadequate core shift. Indeed, our results show that the pure SSA model fitted fairly well on both approaching-jet and counterjet sides at all frequencies, except for the counterjet components at 5, 8, and 15 GHz. When the observed core shifts on the counterjet side are fitted without the cores at these frequencies, the best-fit values of  and
and  (representing the index and the asymptotic limit in this condition) approximate those of the approaching-jet side, as expected from SSA theory (Table 4). This suggests the presence of an absorber in a limited region. Thus, it appears that the cores at 5, 8, and 15 GHz are additionally affected by FFA. FFA opacity
  at the positions of 2–22 GHz cores in the counterjet is determined by spectral analysis of multifrequency images (Appendix
  is well represented by a power-law profile. On the other hand,
  at other frequencies, where SSA alone can describe the core shift profile, should be
  .
.

Figure 10. FFA opacity at the locations of cores on the counterjet side, assuming that FFA is responsible for observed deviations of core positions at 5, 8, and 15 GHz (Section 4.3.3) and the spectral profile along the counterjet is caused by an FFA process. The upper limits at the low frequency (2 GHz) and the high frequency (22 GHz) are because of no significant deviation from the SSA core shift model. The dashed line denotes a possible radial profile of FFA opacity as a power-law function by least-squares fitting with 5–15 GHz data.
Download figure:
Standard image High-resolution imageSuch a limited range of FFA regions is consistent with a gap found in the intensity profile on the counterjet side in previous studies (e.g., Jones et al. 2001) and an obscuring disk proposed by them. Thus, the geometrically thin disk predicted is a candidate to explain the core shift of the counterjet side.
4.4. Disk Structure of NGC 4261
We consider the structure of a disk to explain the core shift and the profile of  on the counterjet side.
4.4.1. Disk Model
Figure 11 shows the geometric relationships between the jet and disk, assuming that  and the rotation axis of the disk is aligned with the axis of the parsec-scale jet. As discussed in the combined model, if the disk plasma causes the core shift at 5–15 GHz, the density and temperature of the disk require the radial gradient (
 ,
,  , where x is the radius of the disk in Rs units,
  ). In addition, the thickness of the disk and the path length through the disk to observers are also described as
  and
and  . By substituting ne, Te, and L into Equation (A2), we obtain
  by the disk (hereafter
  ), that is,


Figure 11. Left: density (ne) and temperature (Te) profiles of an outer thin accretion disk, assuming  and
and  K at the area covering the 5 GHz core in the case of h = 0 and
  pc. An arrow denotes the upper limit of ne at 22 GHz from
  , on the basis of the Te profile as the outer thin disk, because no deviation from the SSA core shift model was found at 22 GHz (Section 4.3.1). Right: schematic illustration of our model that explains the observed core shifts in the jets at both sides simultaneously (Section 4.4). The parameters rH, rM, and rL denote the observational core position at the high-frequency (
 22 GHz), the medium-frequency (5–15 GHz), and the low-frequency (
 2.3 GHz) range, respectively. At rH and rL, the counterjet is not absorbed sufficiently because of obscuration only by optically thin RIAF at the inner region, and because of an insufficient electron density and/or too low temperature to be ionized at the outer radii. On the other hand, at rM the counterjet is strongly absorbed by the outer thin disk. xc represent a transition radius.
Download figure:
Standard image High-resolution imageIn Figure 10, the least-squares fitting at 5–15 GHz data reveals the profile of disk opacity to the power-law function of the disk radius, that is,  then we obtain

4.4.2. Core Shifts at  2 GHz and 22 GHz Do Not Require Disk Absorption


To explain the small opacity at low frequency ( 2 GHz), the low density, the short path length, or high temperature is required because the FFA effects depend on frequency (
 see Appendix
We consider the condition that the temperature at the radius corresponding to the 5 GHz core position and at the 2 GHz position are higher and lower than 104 K, respectively. Assuming that  predicted by the standard disk model at the outer region (Shakura & Sunyaev 1973) and 104 K at 5 GHz, we obtain

In addition, if h = 0 (wherever the path length is constant) and  pc, for simplicity, we obtain s = 2 from Equation (7). It is very close to
  predicted by the standard disk model. Inserting these value and
  into Equation (6), we obtain

The density and temperature profile in this condition are shown in Figure 11.
We note that the assumptions of h and H1 may be unsupported and thus other values are acceptable. Substituting  (predicted by the standard disk model) into Equation (7) and
  pc (corresponding to L = 0.01 pc at the 5 GHz core), we obtain s = 2.6 and
  cm−3. Although the index s increases the gap to the value predicted by the model, ne at
  –105 is almost the same, within a factor of a few, as the case of h = 0. In the case of H1,
  is obtained from Equation (6), indicating that the thinner disk geometrically requires the higher density (i.e.,
  cm−3 at
  pc). However, if the disk thickness was much larger (i.e.,
  pc), the disk would obscure the approaching jet as well as the counterjet. Thus,
  pc provides a reasonable upper limit, indicating the lower limit of ne.
On the other hand, this density profile cannot explain the small opacity at the high frequency ( 22 GHz,
  The interpretation under a simple power-law profile requires a large t such as
  , which leads to a sufficiently high temperature of plasma to reduce the FFA effect at the inner region (22 GHz). However, this is impractical because the disk temperature at 3 Rs should be too high (1014 K). The weak effects of FFA at the 22 GHz core indicate that the disk structure changes dramatically at a characteristic radius.
The RIAF model is suitable for describing this situation of the low density at inner radii of an accretion. In fact, X-ray observations suggest that a low luminosity and flux and spectral variations of the nuclear X-ray emission of NGC 4261 can be caused by an accretion disk with a low accretion rate with a low radiative efficiency such as RIAF (Gliozzi et al. 2003). Therefore, we propose that the accretion flow of NGC 4261 has a two-component structure: one is an inner, hot, optically thin RIAF, and the other is an outer, truncated, cool, optically thick accretion disk. This structure is considered to be not expedient for NGC 4261 but common for LLAGNs based on broad SED and X-ray spectral studies (Nemmen et al. 2006; Nandra et al. 2007).
4.4.3. Comparison with Theoretical Models for Transition Radius in an Accretion Flow/Disk
According to Liu et al. (1999), the transition radius, xc, in an accretion disk is given by

where mb and  denote the black hole mass in units of solar masses,
  and the mass accretion rate in Eddington units,
  ,
,  g s−1. Inserting
  and
and  into Equation (10), we obtain
  , requiring a significantly higher accretion rate compared to that of the typical LLAGNs (
 –10−3). Recently, the equation of the transition radius is modified by the disk evaporation model taking account of the effects of viscosity and magnetic field in accretion flow (Qiao et al. 2013). In this case,
  is easily acceptable for
  , which is an expected accretion rate for NGC 4261.
Consequently, this combined model of RIAF and truncated disk is a possible solution to explain the core shift of NGC 4261 on both sides simultaneously. Figure 11 shows this schematic illustration.
4.4.4. The Structure of Absorber and the Location of X-Ray Emission
It is necessary to explain an observed large column density of  , where NH represents the column density, toward the nucleus (e.g., Worrall et al. 2010), with an X-ray luminosity of
  ; the origin of the power-law X-ray emission is controversially associated either with the accretion flow or the base of the jet (e.g., Gliozzi et al. 2003; Zezas et al. 2005).
First, we consider the case that the X-ray absorber would be the outer thin disk. Substituting  in Equation (9), the emission is passing through the region of a density of
  cm−3. In the case of L = 0.01 pc, we obtain
  cm−2, indicating consistency with the X-ray observation. However, the geometrically thin disk can obscure only the counterjet in this case. It is inappropriate to make only the counterjet take responsibility for the X-ray-emitting source.
Second, we consider the case that the X-ray absorber would be the inner accretion flow. We adopt a simple ADAF model (Mahadevan 1997) with  as a free-fall density profile and
  at
at  . The observed X-ray luminosity, suggesting an accretion rate of
  , roughly provides an electron temperature and restricts the amount of accreting material. In this condition, a resultant FFA opacity at
  at 22GHz is significantly less than unity (see Appendix
  through the accretion flow. Thus, only the accretion flow cannot be responsible for the large column density observed at X-ray. Consequently, neither the outer thin disk nor the inner RIAF seems to be a sufficient X-ray attenuator; an external absorber, such as a dusty torus, along our line of sight is required to explain X-ray observations.
5. CONCLUSION
We measured the origin of jets at the radio galaxy NGC 4261 as the limit of the core position at infinite frequency using a core shift profile. The origin is 82 ± 16 μas (projected) distant from the 43 GHz core position, corresponding to  (deprojected). We also measured the core shift on the counterjet side and confirmed that the core positions on both sides asymptotically converge to the same limit. Therefore, we conclude that the jet origin estimated by core shift measurements spatially coincides with the central engine.
The spectral index maps reveal the possible presence of FFA,  , in at least a limited area on the counterjet side. The core shift profile of the counterjet is not solely attributable to SSA and requires an additional absorbing component such as a geometrically thin disk. Moreover, the core shift and FFA opacity profiles from our results suggest a two-component accretion such as a combined model of RIAF and truncated thin disk that is previously proposed for accretion flows of LLAGNs to explain observed SEDs. The density and temperature profiles for the outer thin disk as free–free absorbers are estimated to be
  K and
K and  cm−3, respectively, in the case of
  pc. Neither the outer thin disk nor the inner RIAF seems to be a sufficient X-ray attenuator; an external absorber, such as a dusty torus, along our line of sight is required to explain an observed high column density toward the nucleus.
The VLBA is operated by the National Radio Astronomy Observatory, a facility of the National Science Foundation, operated under cooperative agreement by Associated Universities, Inc. This work was partially supported by a Grant-in-Aid for Scientific Research (B; 24340042, A.D.) from the Japan Society for the Promotion of Science (JSPS) and the Center for the Promotion of Integrated Sciences (CPIS) of Sokendai.
APPENDIX A: ANALYSIS OF FFA OPACITY PROFILE
In this section, we estimate the distribution of FFA opacity along the jet axis (from the east to the west). We determined an intensity profile along the jet by integrating the flux density of clean components in defined regions, at intervals of 0.25 mas and 1 mas inside and outside of 2 mas from the putative central engine, respectively. From the integrated flux densities, we then performed spectral fitting analysis in each area. The fitting function for spectral shape  is described as

where

Here,  are the unabsorbed flux density at 1 GHz, the intrinsic spectral index of synchrotron emission, and FFA opacity, respectively;
  are the electron density, path length, and temperature of the plasma, respectively. Assuming that
  is fixed at some typical value (
 ),
),  were determined by least-squares fitting. Figure A1
shows the determined distribution of FFA opacity
were determined by least-squares fitting. Figure A1
shows the determined distribution of FFA opacity  . In addition, we determined the radial profile of FFA opacity on the approaching-jet side by fitting to a power-law function:

where  are free-fitting parameters. The fitted parameters are listed in Table A1
.
are free-fitting parameters. The fitted parameters are listed in Table A1
.
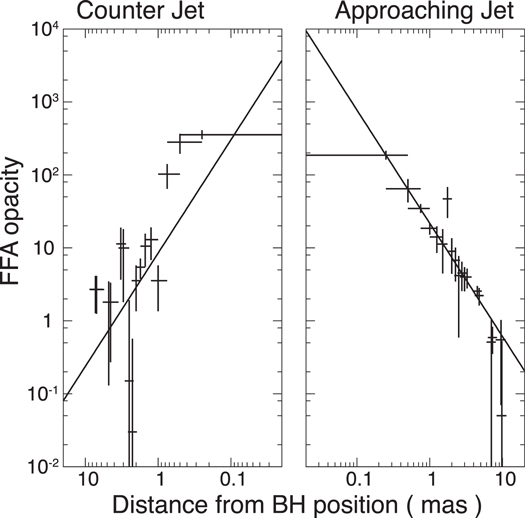
Figure A1. FFA opacity profiles on the counterjet (left) and approaching-jet (right) sides, assuming that spectral profiles along jets are caused by an FFA process. Crosses denote the opacity in each area, and the solid lines denote the least-squares fits to the function  . On the counterjet side, we fix d to the same value of the approaching-jet side and determine
  by fitting. The fitting parameters are given in Table A1.
Download figure:
Standard image High-resolution imageTable A1. Parameters Obtained from Least-squares Fitting of the FFA Opacity Distribution Along R.A.

|
d | |
|---|---|---|
| (1) | (2) | (3) |
| Approaching jet | 21.65 ± 0.21 | 1.55 ± 0.02 |
| Counterjet | 8.46 ± 3.56 |
Notes. Columns are as follows: (1) jet side; (2) FFA opacity at 1 mas; (3) power-law index for radial dependence.
Download table as: ASCIITypeset image
APPENDIX B: SPHERICAL FFA PLASMA MODEL
In this section, we consider an FFA-induced core shift using the radial profile of FFA opacity. We assumed that the core position affected by FFA is emitting at the local maximum in the spectral shape. The partial derivative of (A1) with respect to ν is maximized at  . Substituting this τ into (A3) and solving the equation for r, we obtained the core shift profile on the approaching-jet side.
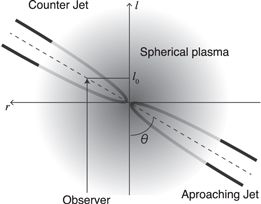
Assuming the structure of the FFA plasma, the core shift profile on the counterjet side can be derived from the information of the approaching side. In this study, we presumed a simple spherical plasma (see Figure A2
), which can obscure both the approaching jet and the counterjet. If the electron density and temperature of the FFA plasma follow a power-law function, i.e.,  and
and  , the index of the opacity profile, d, should be identical on both the approaching-jet and counterjet sides. When fitting the opacity profile on the counterjet side, we fixed d to the same value as that of the approaching jet and obtained
  . Table A1 provides this fitting result. Let us consider the configuration as shown in Figure A2. Substituting
  and
and  into Equation (A2), we integrate the path length in the plasma along the line of sight from the jet at
  . The radius x from the black hole is described in (r, l) coordinates as
  . Therefore, the FFA opacity is given by

Figure A2. Schematic of spherical FFA plasma model. We discuss in the assumptions that radial profiles of electron density and temperature of the plasma are described by power-law functions (Appendix B). The counterjet side is more opaque than the approaching-jet side at a given radius from the putative black hole for this inclined ( ) system of NGC 4261. Let the l and r axes be parallel and perpendicular to the line of sight, respectively.
Download figure:
Standard image High-resolution image
By replacing with  , we now convert Equation (B.1) to


Adopting d = 1.55 from the analysis of the opacity profile (Table A1), the result of the integration is obtained in numerical calculations. An asymmetric profile of the opacity between both jets is caused by only the different viewing angles, corresponding to the integration ranges  . Even if
  and
and  are unknown, we can obtain the opacity profile of the counterjet by using the ratio of the opacity to that of the approaching jet.
In this way, we can calculate the FFA core shift profile in the counterjet (Figure 6).
Footnotes
- 6
Actually, the jet profile of NGC 4261 is nearly conical, which will be reported in another paper.