


ABSTRACT
We study the relation between strong and extreme geomagnetic storms and solar cycle characteristics. The analysis uses an extensive geomagnetic index AA data set spanning over 150 yr complemented by the Kakioka magnetometer recordings. We apply Pearson correlation statistics and estimate the significance of the correlation with a bootstrapping technique. We show that the correlation between the storm occurrence and the strength of the solar cycle decreases from a clear positive correlation with increasing storm magnitude toward a negligible relationship. Hence, the quieter Sun can also launch superstorms that may lead to significant societal and economic impact. Our results show that while weaker storms occur most frequently in the declining phase, the stronger storms have the tendency to occur near solar maximum. Our analysis suggests that the most extreme solar eruptions do not have a direct connection between the solar large-scale dynamo-generated magnetic field, but are rather associated with smaller-scale dynamo and resulting turbulent magnetic fields. The phase distributions of sunspots and storms becoming increasingly in phase with increasing storm strength, on the other hand, may indicate that the extreme storms are related to the toroidal component of the solar large-scale field.
Export citation and abstract BibTeX RIS
1. INTRODUCTION
Extreme space weather storms are low-probability but high-consequence events that may have a significant impact on the modern technological infrastructure in space and on the ground (e.g., Pulkkinen et al. 2005). The strongest documented storm in the geospace to date is the famous Carrington storm, which occurred in 1859 September (e.g., Carrington 1859; Tsurutani et al. 2007). The possibility of a solar superstorm hitting the Earth has become a focus of attention in the space physics community since a record strong and fast coronal mass ejection (CME) hit the STEREO-A spacecraft in 2012 July (Russell et al. 2013; Liu et al. 2014). If this CME would have been Earth directed, it would have caused severe space weather consequences (Baker et al. 2013; Ngwira et al. 2013).
Due to their potential to cause significant economical losses (e.g., Baker 2009), there is a great interest to forecast the future occurrence probability for extreme space weather. Extrapolation from smaller events gives the 10 yr occurrence probability for a Carrington-sized storm (geomagnetic index Dst < −850 nT) to be 12% (Riley 2012), or one such event in every 500 yr (Yermolaev et al. 2013). Love (2012), in turn, assumed that the occurrence of extreme geomagnetic storms can be described statistically in terms of an idealized Poisson model. They obtained the most likely Poisson occurrence probability for a Carrington-sized event in the next 10 years to be 6%.
However, these estimations rely on strong assumptions and on Dst that covers only cycles pertaining to the "modern solar maximum," i.e., the relatively high solar activity period that began from Solar Cycle 15 in 1914. Furthermore, the correspondence between the occurrence of extreme geomagnetic storms and the solar cycle characteristics, such as its strength and phase, is not known. While it is well established that CMEs are involved in the majority of strong and extreme storms (e.g., Huttunen et al. 2002; Zhang et al. 2007; Richardson & Cane 2012; Yermolaev et al. 2013), the prerequisites at the Sun that generate superstorms and connections with large- and small-scale solar dynamo processes are not yet understood. Latest studies have given increasing evidence that the most extreme space weather storms are generated when multiple fast and strong CMEs interact with each other (e.g., Gonzalez et al. 2011; Liu et al. 2014). It is noteworthy that both the Carrington storm and the 2012 July CME event occurred during moderate/weak-sized solar cycles. In particular, the recent declining trend in solar activity has raised the question whether extreme geomagnetic storms can also occur during calmer solar periods.
Here we seek to answer the following questions. How does the occurrence of extreme storms correlate with the solar cycle strength? In which solar cycle phase do extreme storms tend to occur? We obtain a quantitative estimation on the relation between the occurrence of extreme geomagnetic storms with the size and phase of the solar cycle using the Pearson correlation statistics and estimating the significance of the correlation coefficients with a bootstrapping technique. The characteristics of the extreme storms are compared with the characteristics of the less extreme storms. We also discuss the implications of our results in the context of solar dynamo processes.
2. OBSERVATIONS
To cover the maximally long time period, we use the 3 hr resolution AA index,8
which provides the longest continuous geomagnetic activity index data set, dating back to 1868. AA covers 14 solar cycles (solar cycles 11–23) with a large range of sizes and durations. It is calculated from two approximately antipodal mid-latitude magnetometer observatories that have changed over the years. AA indicates the severity of global geomagnetic storminess as it is affected by variations in several magnetospheric current systems, such as the auroral electrojets, ring current, field-aligned currents, and the magnetopause current. We also define storms using the amplitude of the geomagnetic field horizontal component at the Kakioka Magnetic Observatory9
(Kakioka dH). The Kakioka Observatory is located at the geographic latitude of 36 6N (geomagnetic latitude of 274N), having the primary contribution from the equatorial ring current, and thus there is no one-to-one correspondence with AA. Kakioka measurements are given at 1 hr resolution, and the observations used here date back until 1926. Hence, Kakioka dH covers in total eight solar cycles (solar cycles 16–23).
Our definition of a magnetic storm requires that AA or Kakioka dH exceeds 100 nT, i.e., the threshold for intense geomagnetic activity (e.g., Gonzalez et al. 1990). The storm peak is the maximum of the 3 hr AA or 1 hr Kakioka dH value reached during the storm. The storm is defined to start when AA or Kakioka dH exceeds 50 nT and to end when the index decreases below 50 nT (Figure 1). The analysis in this study is performed using storm thresholds, given in Table 1 for both indices. We also performed our analysis using the ranges (e.g., AA = 100−200 nT), but no significant differences in the results were found.
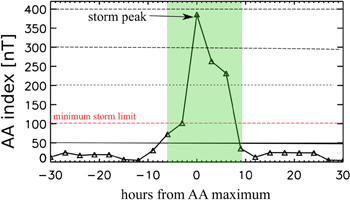
Figure 1. Our storm definition. For a storm it is required that the 3 hr AA index exceeds 100 nT (red dashed line). The storm begins when AA exceeds 50 nT (solid black line) and ends when it decreases below 50 nT (the storm duration is indicated by the green-hatched area in the figure). Same definitions are used for Kakioka dH.
Download figure:
Standard image High-resolution imageTable 1. Total Number of Storms in Different Thershold Categories for AA and Kakioka dH (KAK) and Their Distributions to Different Solar Cycle Phases with Standard Errors of the Bootstrapped Distributions
| Threshold | Total | Minimum | Ascending | Maximum | Declining |
|---|---|---|---|---|---|
| AA > 100 nT | 2073 | 246 ± 16.0 | 299 ± 17.1 | 665 ± 25.3 | 827 ± 27.5 |
| AA > 200 nT | 328 | 18 ± 4.2 | 49 ± 7.3 | 145 ± 11.7 | 116 ± 10.8 |
| AA > 300 nT | 106 | 2 ± 1.4 | 16 ± 4.0 | 49 ± 7.0 | 39 ± 6.3 |
| AA > 400 nT | 54 | 1 ± 1.0 | 8 ± 2.8 | 25 ± 4.9 | 20 ± 4.6 |
| AA > 500 nT | 33 | 1 ± 1.0 | 6 ± 2.5 | 14 ± 3.7 | 12 ± 3.6 |
| AA > 600 nT | 17 | 0 | 4 ± 2.0 | 7 ± 2.6 | 6 ± 02.5 |
| Δ TSC (years) | ⋯ | 2.3 | 1.9 | 2.8 | 3.8 |
| KAK > 100 nT | 472 | 31 ± 5.6 | 79 ± 8.8 | 189 ± 13.6 | 173 ± 12.7 |
| KAK > 150 nT | 368 | 10 ± 3.2 | 28 ± 4.4 | 78 ± 8.9 | 63 ± 7.8 |
| KAK > 200 nT | 112 | 5 ± 2.3 | 12 ± 3.5 | 37 ± 6.2 | 28 ± 5.3 |
| KAK > 250 nT | 57 | 2 ± 1.04 | 4 ± 1.9 | 20 ± 4.6 | 17 ± 4.2 |
| KAK > 300 nT | 34 | 0 | 2 ± 1.4 | 7 ± 2.6 | 11 ± 3.3 |
| KAK > 350 nT | 17 | 0 | 1 ± 1.0 | 4 ± 2.0 | 6 ± 02.5 |
| ΔTSC (years) | ⋯ | 2.2 | 1.8 | 2.2 | 3.5 |
Note. The ΔTSC columns give the average duration of each solar cycle phase for the set of cycles investigated for AA and Kakioka dH.
Download table as: ASCIITypeset image
In the analysis we use the international sunspot number (ISSN) from the Belgian Royal Observatory.10 The size of the sunspot cycle is estimated using the maximum of the daily ISSN and by calculating the mean of the monthly ISSN over the whole cycle.
Then we calculate the correlation between the cycle strength and the number of storms above the certain threshold, as well as the phase shift between the average sunspot number and the storm frequency distributions (see below). The confidence intervals for the correlation coefficients are calculated using the bootstrapping technique (Efron 1979). The main idea of the bootstrap is to substitute the unknown distribution by the empirical distribution of the observed data. Then the data generation process from this empirical distribution is repeated several times. The value in question is calculated on each iteration, and hence its uncertainty can be estimated.
We apply two different methods to investigate the storm occurrence frequency per solar cycle phase. First, we divide each solar cycle into ascending, maximum, declining, and minimum phase using epochs defined by the method described in Hynönen (2013). The method uses the averages and standard deviations of the smoothed ISSN, and the phases are illustrated in Figure 2 for solar cycles 22 and 23. For each phase we count the total number of storms above the certain threshold and scale it with the mean duration of the phase. The total number of storms in each AA and Kakioka dH category, their distributions to different solar cycle phases, and the mean phase durations are given in Table 1. Second, we investigate the phase shift between the ISSN and storm occurrence distributions. We form a mean ISSN distribution by scaling each cycle length to unity and by superimposing all scaled cycles together. Similarly, we form the scaled mean distributions for different AA and Kakioka dH storm thresholds. Then, we search the phase shift that minimizes the distances between the ISSN and AA/Kakioka dH distributions (Figure 3). Error estimates for the phase shifts are calculated using the block bootstrap technique (Kunsch 1989), where the blocks and their sizes are defined by solar cycles.
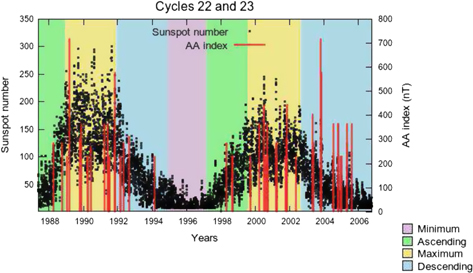
Figure 2. Examples of division to different solar cycle phases used in this study. Black dots give the daily values of the ISSN. Red vertical lines show the times of the AA > 200 nT storms.
Download figure:
Standard image High-resolution image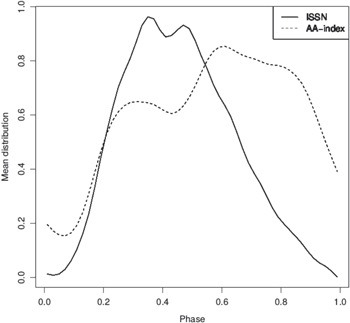
Figure 3. Mean distributions of ISSN and AA index. The curves reflect the phase dependence of corresponding normalized measurements averaged over all cycles.
Download figure:
Standard image High-resolution image3. RESULTS
3.1. Storm Occurrence and Solar Cycle Strength
Figure 4 shows the annual ISSN and the occurrence times of the most extreme storms (AA > 600 nT and Kakioka dH > 350 nT). There were in total 17 AA > 600 nT storms during the period of 13 solar cycles and 11 Kakioka dH > 350 nT storms during the period of eight solar cycles. The Carrington storm and the 2012 July event are also marked in the top panel. We also give in Tables 2 and 3 the times of the 10 largest AA and Kakioka dH storms. From Figure 4 and Tables 2 and 3 it is evident that extreme geomagnetic storms do not occur solely during strong solar cycles.
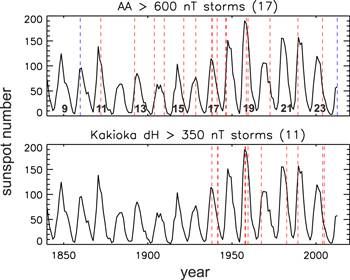
Figure 4. Annual ISSN and the times of the most extreme geomagnetic storms, defined here by the 3 hr AA index exceeding 600 nT (top) and Kakioka dH exceeding 350 nT (bottom). The blue dashed lines in the top panel show the Carrington storm in 1859 and the 2012 July event that missed the Earth but hit the STEREO-A spacecraft. Numbers in the bottom part of the top panel give the solar cycle number for odd-numbered cycles. AA covers the years 1868–2009 (solar cycles 11–23) and Kakioka dH the years 1926–2009 (solar cycles 16–23).
Download figure:
Standard image High-resolution imageTable 2. A List of the 10 Largest AA Storms
| N | Date | AA Max (nT) | Solar Cycle | ISSN Max |
|---|---|---|---|---|
| 1 | 2003 Oct 29 | 715 | 23 | 120.8 |
| 2 | 1989 Mar 14 | 715 | 22 | 158.5 |
| 3 | 1972 Aug 4 | 698 | 20 | 110.6 |
| 4 | 1959 Jul 15 | 698 | 19 | 201.3 |
| 5 | 1958 Jul 8 | 698 | 19 | 201.3 |
| 6 | 1921 May 14 | 698 | 15 | 105.4 |
| 7 | 1909 Sep 29 | 658 | 16 | 78.1 |
| 8 | 1903 Oct 31 | 658 | 14 | 64.2 |
| 9 | 1892 Feb 14 | 658 | 13 | 87.9 |
| 10 | 1872 Feb 4 | 658 | 11 | 140.3 |
Note. The columns give the date of the AA maximum, the peak value of the AA index reached during the storm, solar cycle number, and the sunspot maximum of this cycle.
Download table as: ASCIITypeset image
Table 3. A List of the 10 Largest Kakioka dH Storms
| N | Date | dH Max (nT) | Solar Cycle | ISSN Max |
|---|---|---|---|---|
| 1 | 1989 Mar 14 | 567 | 22 | 158.5 |
| 2 | 1941 Jul 5 | 535 | 17 | 119.2 |
| 3 | 1957 Sep 13 | 412 | 19 | 201.3 |
| 4 | 1958 Feb 11 | 411 | 19 | 201.3 |
| 5 | 1941 Sep 19 | 401 | 17 | 119.2 |
| 6 | 1982 Jul 14 | 395 | 21 | 164.5 |
| 7 | 2003 Nov 20 | 373 | 23 | 120.8 |
| 8 | 1967 May 26 | 371 | 20 | 110.6 |
| 9 | 2004 Nov 8 | 371 | 23 | 120.8 |
| 10 | 1938 Nov 22 | 370 | 17 | 119.2 |
Note. The columns give the date of the Kakioka dH maximum, the peak value of the Kakioka dH index reached during the storm, solar cycle number, and the sunspot maximum of this cycle.
Download table as: ASCIITypeset image
The top panels of Figure 5 give the Pearson correlation coefficients with the confidence intervals calculated with the bootstrap method (see Section 2) between the strength of the solar cycle and the number of AA (left) and Kakioka dH (right) storms per solar cycle for different storm magnitude thresholds. It is seen that the correlation coefficients are higher when the maximum of the ISSN is used to estimate the strength of the cycle than when the cycle mean is used. The few lowest storm thresholds for both indices show a strong positive correlation between the solar cycle strength and the storm occurrence. When the limiting storm magnitude is increased, the correlation starts to decline toward negligible correlation, in particular when the solar cycle strength is defined in terms of the mean ISSN. However, the width of the 95% confidence intervals is large due to a small number of the most extreme storms (see Table 1). Hence, it is not possible to tell reliably whether the correlation is negligible or weakly positive or negative.
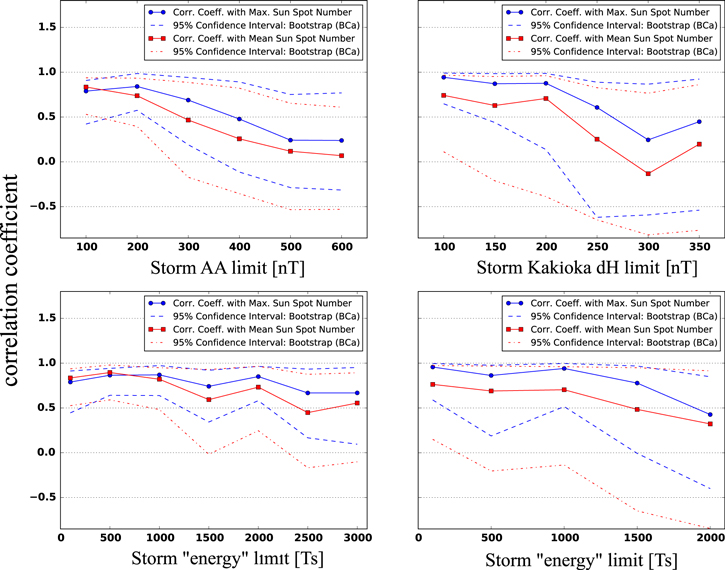
Figure 5. Pearson correlation coefficients between the strength of the solar cycle and the number of storms per solar cycle as a function of storm maximum (top) and storm "energy" (integral of the geomagnetic index over the storm duration) (bottom). Left panels show the analysis based on the 3 hr AA index covering the time period 1868–2009. Right panels show the analysis based on the 1 hr Kakioka dH index covering the time period 1926–2009. Red curves show the correlation coefficients where the solar cycle strength has been estimated using the maximum monthly sunspot number, and blue curves where the solar cycle strength has been estimated using the mean value of the monthly sunspot numbers. The blue and red dashed lines give the corresponding 95% confidence intervals.
Download figure:
Standard image High-resolution image3.2. Storm Total Energy and Solar Cycle Strength
The bottom panels of Figure 5 display the correlation between the storm "energy" (calculated over the whole storm interval) and the solar cycle strength for AA and Kakioka dH storms for different storm "energy" thresholds. By "energy" we mean the integral of the storm magnetic field over the length of the storm. This is not exactly energy (since the energy is proportional to the integral of the square of the magnetic field), and therefore we have put the word "energy" in quotes. Again, correlation coefficients are higher when the solar cycle strength is estimated using the maximum ISSN. The storms with the lowest energy limits (≤1000) show a strong positive correlation for both AA and Kakioka dH. For AA storms with higher total energy, the correlation fluctuates between strong and moderate positive correlation. For Kakioka dH the correlation between the storm energy and solar cycle strength decreases clearly when the storm energy increases, but there is still a moderate positive correlation. The 95% confidence intervals widen again considerably with increasing storm energy.
3.3. Storm Distribution over Solar Cycle Phase
The stacked histograms in Figure 6 show the relative percentage split of AA and Kakioka dH storms into different solar cycle phases. It is seen that only a minority of AA and Kakioka dH storms occurred in the minimum phase. In particular, none of the most extreme storms occurred in the minimum phase. The fraction of storms in the minimum phases increases with decreasing storm magnitude, in particular for AA.

Figure 6. Relative distribution of AA (top) and Kakioka dH (bottom) storms into different solar cycle phases. The number of storms has been weighted by the duration of each phase (see Table 1).
Download figure:
Standard image High-resolution imageThe storm frequency is highest in the maximum phase for all investigated AA storm magnitude thresholds. The frequency of storms in the maximum phase increases from 33% to 48% when the storm magnitude threshold increases from AA > 100 nT to AA > 400 nT. For the two most extreme AA storm thresholds the frequency of storms in the maximum phase sligthly decreases, but the maximum phase has still clearly the largest fraction of storms (44% and 40% for AA > 500 nT and AA > 600 nT, respectively). Until the AA > 400 nT threshold the frequency of storms is higher in the declining phase than in the ascending phase. For the AA > 500 nT threshold ascending and declining phases have the equal frequency of storms, and for the most extreme threshold limit the ascending phase has a larger storm frequency.
For Kakioka dH the maximum phase has clearly the largest frequency of storms from the >100 to >250 nT threshold range. Within this range, the frequency of storms in the maximum phase again increases with increasing storm magnitude threshold, from 38% to 47%. For the two most extreme Kakioka dH thresholds the frequency of storms in the maximum phase decreases and the largest percentage of storms is in the declining phase (46%). The declining phase has a larger frequency of storms than the ascending phase for all investigated thresholds.
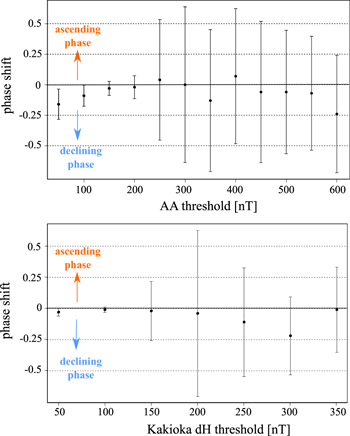
The results of the phase shift analysis between the normalized ISSN distribution and the AA and Kakioka dH distributions are shown in Figure 7. As described in Section 2, the analysis is performed for different storm thresholds, including the >50 nT threshold. For the smallest AA thresholds (AA > 50 nT and AA > 100 nT) it is apparent that the storms tend to be accumulated more toward the declining phase, i.e., they show a negative phase shift. When the storm threshold increases, this tendency vanishes, indicating that the stronger storms are in phase with the solar maximum, consistent with the results shown in Figure 6. However, owing to the low number of data points after the threshold AA > 250 nT (see Table 1), the uncertainty is too large to draw reliable conclusions. The bottom panel of Figure 7 shows that for Kakioka dH also the distributions for the weakest thresholds are in phase with the ISSN distribution.
Figure 7. Phase shift between the normalized ISSN distribution and the normalized AA (top) and Kakioka dH (bottom) distributions. Error estimates for the phase shifts have been calculated using the block bootstrap techique. Negative (positive) phase shifts indicate the storm occurrence in the declining (asceding) phase.
Download figure:
Standard image High-resolution image
4. DISCUSSION
The first part of our analysis indicates that the correlation between the storm occurrence and the overall solar cycle strength decreases with increasing storm magnitude. In particular, the most extreme events are not well correlated with the strength of the solar cycle. This result is supported by both the Carrington superstorm and the 2012 July extreme CME event occurring during relatively medium/weak-sized solar cycles (see Figure 4).
Large-fluence (>30 MeV) solar proton events (SPEs) provide an alternative long-term proxy of solar superstorms and extreme space weather events. SPEs are accelerated at the interplanetary shocks driven by fast and strong CMEs, and they leave detectable traces in ice core nitrate concentrations. It has been reported that large-fluence SPEs occur frequently also during weak solar cycles (e.g., McCracken et al. 2001, 2004; Barnard et al. 2011). We calculated the correlation between the occurrence of large fluence SPEs in 1561–1950 using a list published in McCracken et al. (2001) and the combination of the sunspot number from Steinhilber et al. (2012) and Hoyt & Schatten (1997). The obtained Pearson correlation coefficient is −0.02 with the standard error of 0.17, hence indicating a negligible correlation. However, it is not clear how much of the SPE correlation with the solar cycle strength is influenced by interplanetary magnetic field being generally weaker during quieter times. The Alfvén velocity depends linearly on the strength of the interplanetary magnetic field, which allows higher shock compression ratios, and hence large SPEs, during periods of lower solar activity (e.g., McCracken et al. 2004).
Our results raise an interesting question on the importance of large- and small-scale components of the solar dynamo in the generation of different sizes of space weather disturbances. It is commonly believed that the cyclic variation of the solar activity level is caused by a large-scale hydromagnetic dynamo (e.g., Parker 1955) operating in the turbulent convection zone and producing magnetic fields on global scales, commonly divided into the toroidal (azimuthal) and poloidal (meridional) field components. The toroidal component is thought to give rise to the formation of sunspots and active regions and also to the eruptive events, such as extreme flares and CMEs, originating from them. In turn, the poloidal field, obtaining its maximum during the toroidal field minimum, can be directly observed on the solar surface, and it manifests itself through, e.g., coronal holes (e.g., Ruzmaikin & Feynman 2001).
The first step of our analysis, however, gives an indication toward the extreme storms not being directly connected with the variations seen in the overall evolution of the solar activity level. It has indeed been proposed that, instead of the large-scale dynamo, a small-scale dynamo and resulting turbulent magnetic fields would have the desired intermittent character to display burst-like activity phenomena with long waiting times (Veltri et al. 2005).
As discussed in the Introduction, it is important to forecast the occurrence probability of extreme space weather events. In particular, the recent declining trend in solar activity has raised the question at what frequency major storms occur during weaker solar cycles. Estimating occurrence probabilities for rare events is problematic (e.g., Love 2012), and as our results show, the occurrence frequency for extreme storms cannot be directly extrapolated from weaker events. While the frequency of nominal geomagnetic activity varies clearly with the strength of the solar cycle, the occurrence probability for extreme space weather does not decrease with decreasing solar cycle strength. Also magnetohydrodynamic turbulence modeling supports this hypothesis: eruptive-type events draw their energy from the turbulent dissipation, which can be estimated from numerical models. Such modeling has shown broad exponential tails in the distribution of energy dissipation, implying a non-zero probability for an extreme event even for a system with low average activity level (e.g., Candelaresi et al. 2014).
The second part of our analysis, however, shows that the extreme events are not totally detached from the solar cycle, but they tend to occur more frequently near solar maximum. Furthermore, both the extreme CME event of 2012 July and the Carrington storm occurred near solar activity maximum (see Figure 4). The mean magnetic field is a proxy of the solar large-scale dynamo, while the signal in the sunspot number contains both the mean field and fluctuations. Hence, from the point of view of solar dynamo, especially the averaged cycle analysis can give hints of the behavior of extreme storminess versus the behavior of the mean solar magnetic field, as by the averaging procedure one may hope to capture the regular part of the signal while eliminating the fluctuations. Our analysis suggests that the stronger the storms are, the more in phase their distributions are. Our results are also consistent with Gonzalez et al. (1990), who showed that the strongest Dst storms tend to occur at or very close to solar maximum.
As has been shown, e.g., by Ruzmaikin & Feynman (2001), part of the geomagnetic signal is related to the toroidal magnetic field, and part to the poloidal one. Since the monthly averaged AA used in Ruzmaikin & Feynman (2001) is generally dominated by the lower-level activity, the AA signal in their study tends to be poorly in phase with the sunspot cycle (see also Tanskanen 2009). The most straightforward interpretation of this tendency in terms of the dynamo theory is that the stronger the storm, the more connected it is to the toroidal magnetic field component, therefore most likely having an origin from active-region CME(s). Consistent with Ruzmaikin & Feynman (2001), the distributions of weakest storm thresholds were shifted toward the declining phase, implying that they have an origin in the poloidal field component. This is consistent with several studies (e.g., Huttunen et al. 2002; Richardson & Cane 2012) demonstrating that a large fraction of weak and moderate-level storms are driven by slow-fast stream interaction regions and by fast streams.
The distributions of the weaker Kakioka dH storms being in phase with the mean ISSN distribution may be partly explained by a large contribution of the ring current to the Kakioka recordings. In contrast, AA has a significant contribution from the high-latitude currents. Turbulent high-speed streams from coronal holes, frequent when poloidal fields dominate, are efficient in driving high-latitude activity. In turn, a storm-level enhancement of the ring current requires more continuous and stronger solar wind driving, which is typically related to CMEs (e.g., Tsurutani & Gonzalez 1987; Huttunen & Koskinen 2004; Yermolaev et al. 2012) and hence to the toroidal field component. It is also possible that our results on the storm total energy having a moderate or strong positive correlation with the solar cycle strength are biased by the less strong geomagnetic activity occurring more frequently during strong solar cycles (see also, e.g., Stamper et al. 1999). Many CMEs that produce strong storms are followed by fast streams, which can lead to long recovery phases (e.g., Xie et al. 2005).
Another viable time-dependent process influencing the extreme event production in the Sun is the magnetic helicity (e.g., Owens et al. 2007; Schrijver 2009), i.e., the twist of the magnetic field. Magnetic helicity is a crucially important quantity for the operation of the large-scale dynamo, and without the small-scale helicity being regularly removed by flares and CMEs, the production of small-scale helicity would quench the dynamo already at field strengths much below the equipartition strength, inhibiting the dynamo process (see, e.g., the review by Brandenburg & Subramanian 2005). The magnetic helicity shows a clear sign ordering during a solar cycle, being dominantly negative (positive) in the northern (southern) hemisphere. Near solar maximum helicity shows a clearer sign rule than during solar minimum, when the distribution of magnetic twist is more chaotic (Hagino & Sakurai 2005). One could therefore speculate that the tendency for the strong storms to occur during sunspot maximum reflects the more ordered distribution of magnetic helicity.
We acknowledge Kakioka Magnetic Observatory for providing the magnetometer data. E.K. acknowledges Academy of Finland projects 1218152 and 1267087 for financial support. ISSN data were obtained through SILSO data/image, Royal Observatory of Belgium, Brussels. Work by H.M. was supported by JSPS KAKENHI Grant Number 25287051. This work has been supported by the Academy of Finland Centre of Excellence ReSoLVE (N.O., M.J.K., E.T., J.P.).
Footnotes
- 8
- 9
- 10