


ABSTRACT
Both large-amplitude longitudinal (LAL) oscillations and material drainage in a solar filament are associated with the flow of material along the filament axis, often followed by an eruption. However, the relationship between these two motions and a subsequent eruption event is poorly understood. We analyze a filament eruption using EUV imaging data captured by the Atmospheric Imaging Array on board the Solar Dynamics Observatory and the Hα images from the Global Oscillation Network Group. Hours before the eruption, the filament was activated, with one of its legs undergoing a slow rising motion. The asymmetric activation inclined the filament relative to the solar surface. After the active phase, LAL oscillations were observed in the inclined filament. The oscillation period increased slightly over time, which may suggest that the magnetic fields supporting the filament evolve to be flatter during the slow rising phase. After the oscillations, a significant amount of filament material was drained toward one filament endpoint, followed immediately by the violent eruption of the filament. The material drainage may further support the change in magnetic topology prior to the eruption. Moreover, we suggest that the filament material drainage could play a role in the transition from a slow to a fast rise of the erupting filament.
Export citation and abstract BibTeX RIS
1. INTRODUCTION
Here we report the observation of a solar filament exhibiting large-amplitude longitudinal (LAL) oscillations and abundant material drainage before its eruption. This observation may provide important clues on the physical processes behind both the activation and eruption of filament channels.
Generally, filaments are supported steadily by the solar magnetic field, which determines their slow evolution. Sometimes, however, the filaments disappear when they are strongly perturbed. Such disappearances can be thermal or dynamical (filament eruptions; Mouradian et al. 1995). When the magnetic structure of the filament becomes unstable, accumulated energy may be suddenly released to initiate an eruption (see, e.g., Chen 2011; Schmieder & Aulanier 2012 for a review). The fast acceleration and the eruption of the filament often follows a slow rise (Valniček 1964; Tandberg-Hanssen et al. 1980; Sterling & Moore 2003; Schmieder et al. 2008; Schrijver et al. 2008; Shen et al. 2012; Bi et al. 2013). According to some models, the acceleration is thought to result from the torus instability or from the loss of equilibrium in a flux rope upon reaching a critical height (Kliem & Török 2006; Fan & Gibson 2007; Aulanier et al. 2010). However, the dynamics of the process prior to the eruption, associated with the early slow motion, are still poorly understood. As shown below, the strong flow and drainage of the filament material, as well as the LAL oscillations, are often observed in the pre-eruption phase, and this may provide an alternative approach for analyzing the onset mechanisms.
The drainage of filament mass was first observed early in the 1920 s and the phenomenon was well summarized by Gilbert et al. (2000). The filament often erupts with material draining out of it. However, this material drainage does not always occur with a filament eruption. Gilbert et al. (2001) observed that a filament disappeared after filament material draining, with no coronal mass ejection (CME) associated with the filament. From theoretical point of view, Fong et al. (2002) considered the hydromagnetic processes in a filament structure and suggested that the plasma weight from the filament plays a role in balancing the flux rope. They therefore proposed that the removal of mass from a filament naturally releases a flux rope that then rises in the atmosphere, provided the filament at the base of the corona prior to the eruption has a mass comparable to the CME mass. In observations, however, the timing of the drainage in relation to other eruption-related phenomena has not been thoroughly studied.
Large-amplitude filament oscillations (see, e.g., Tripathi et al. 2009 for an excellent review) are classified into two groups, transverse or longitudinal, depending on whether they are oriented perpendicular or parallel to the filament axis. Transverse oscillations are often associated with a remote flare and associated wave phenomena (Ramsey & Smith 1966; Eto et al. 2002; Gilbert et al. 2008; Shen et al. 2014). They are caused by the interaction of the filament with the Moreton wave (Moreton 1960) and the EIT wave (Thompson et al. 1998). On the other hand, LAL oscillations are often caused by a sub-flare (Jing et al. 2006; Vršnak et al. 2007). Recently, Luna et al. (2014) discussed a filament that oscillated in response to a small local impulsive jet-like event. Interestingly, the LAL oscillations in a quiescent filament, as one out of four filament oscillations reported by Jing et al. (2006), show no clear relationship to any flares. LAL oscillations have also often been observed before eruptions (Zhang et al. 2012; Li & Zhang 2012). However, neither Jing et al. (2003) nor Vršnak et al. (2007) observed a CME following LAL oscillations of the filament. The oscillating parts of the filament present by Luna et al. (2014) did not erupt, but a nearby segment erupted later. This also indicates that the LAL oscillation phenomena in filaments is not always associated with a subsequent eruption.
We note that both the LAL oscillations and material drainage are associated with substantial material flow along the filament axis. However, in contrast to material drainage, the LAL oscillations imply the existence of a restoring force that pulls the filament material back toward its equilibrium position. Both analytic theory and simulations point to gravity as the most likely mechanism for the restoring force (Luna & Karpen 2012; Vršnak et al. 2007; Zhang et al. 2013). Here we report a filament eruption that occurred on 2012 February 23. LAL oscillations were observed along the filament axis, and filament material drainage occurred from the middle region to one endpoint of the filament before the eruption. The observations and data analysis are presented in Sections 2 and 3, respectively. Implications of these observations are discussed in Section 4. A summary is given in Section 5.
2. OBSERVATIONS
The Atmospheric Imaging Assembly (AIA; Boerner et al. 2012) takes full-disk EUV images with a pixel size of 0 6 and a cadence of 12 s from on board the Solar Dynamics Observatory (SDO) from a geosynchronous orbit. The Global Oscillation Network Group (GONG; Harvey et al. 2011) collected Hα images at six sites around the world, with a pixel size of 1'' at a cadence of 1 minute. By means of the data of SDO/AIA and GONG/Hα, we present the eruptive event that occurred on the Earth-side solar disk. The eruption was also detected at the solar limb by one of the twin spacecraft of the Solar Terrestrial Relations Observatory (STEREO) mission, which are separated by nearly 117° behind the Earth along Earth's orbit. We examined full-disk images taken at wavelengths 195 Å and 304 Å by the Extreme Ultraviolet Imager (EUVI; Wuelser et al. 2004; Howard et al. 2008) telescope on board the STEREO, with a pixel resolution of 16 and cadences of 5 minutes and 10 minutes, respectively. Observations from the COR2 coronagraphs (Howard et al. 2008) on board the STEREO were also used to identify the associated CMEs.
3. DATA ANALYSIS
Figure 1 and the accompanying animations show the eruption of a large filament on the northern hemisphere on 2012 February 23. The pre-eruptive filament is visible in Figures 1(a), (e), and (i). Figure 1(a) shows the GONG/Hα image of the filament, which consists mainly of a clump of continuous filament material (outlined by the dark curve) and a pillar structure, which serve as a footpoint or barb for the filament (Schmieder et al. 2013). The outline of the Hα filament clump just overlaps the absorption structure visible in the AIA 193 Å image (Figure 1(e)). In the AIA 304 Å image (Figure 1(i)), the filament appears to be longer and extends from south to north, with its northern end reaching the off-limb corona.
Download figure:
Video Standard image High-resolution imageFigure 1. (a)–(d) GONG/Hα line-center images. (e)–(h) SDO/AIA 304 Å(i)–(l) SDO/AIA 193 Å images. (m)–(n) STEREO-B EUVI 304 Å image. (o)–(p) STEREO-B EUVI 195 Å images. The black line outlining the filament clump on panel (a) is also overlaid on panel (e)–(j). The green arrows in panels (b) and (f) mark the extent of the filament oscillatory motion. The dotted lines on panels (a), (e), and (i) mark the axis of the 304 Å filament axis on panel (i). The asterisk and the plus sign represent the projections of the two points along the filament axis on the view of SDO (panel (f)) and the view of STEREO-B (panel (o)), respectively. The blue dashed curves on panels (b) and (f) mark the trajectory for the slit-image on Figures 2(a) and (b), which are determined based on the location along the flow of the filament material. The blue lines on panels (m) and (n) approximatively mark the trajectory of the apexes of the eruptive prominence on STEREO-B, through which the slit-image on Figure 2(c) is obtained. The box on panel (e) indicates the view of Figures 3(a) and (b).
(Animations (a and b) and a color version of this figure are available in the online journal.)
Download figure:
Video Standard image High-resolution imageIn the time series of the Hα intensity (first row of Figure 1 and Animation 1), the filament material appears to flow back and forth between the location of the filament clump and the pillar. Most of the material in the clump then flows toward the south. By the time corresponding to Figure 1(d), the filament clump has flowed away from the initial location. It then disappears from the Hα image (Animation 1). Another observation in the AIA 193 Å image (Figures 1(e)–(f)) is that the filament clump disappears in the same fashion. In the 304 Å images (Figures (i)–(l)), however, some remaining filament material appears elevated and erupts after the material drainage.
Because the filament appeared as a prominence on the limb from the perspective of STEREO-B, it is convenient to study the evolution of the filament height from this perspective. The pre-eruption prominence shows the emission in the STEREO-B 304 Å image (Figure 1(m)) and the absorption in the 195 Å images (Figure 1(o)). The prominence appears to rise gradually before ∼17:00 UT (see Animation 2). The slow rising motion is asymmetric. In the gradually rising phase, the northern segment of the prominence reaches a higher altitude than the southern one, which makes the prominence, captured by both wavelengths, appear to be inclined relative to the solar surface (Figures 1(m) and (n)). Two points on the filament axis are marked by the asterisk and the plus sign on Figure 1(o). Because the corresponding points on the AIA 304 Å image (Figure 1(f)) are easily identifiable based on the epipolar constraint (Inhester 2006), their true height (i.e., the distance from the solar surface) can be estimated as ∼0.18 R☉ and ∼0.13 R☉, respectively. This indicates that the height difference between the northern and southern regions of the filament is ∼0.05 R☉. As Animation 2 shows, the prominence captured by the 304 Å images subsequently erupts (Figure 1(n)) and leaves the field of view of the EUV image. Consistent with the observation by the SDO/AIA at 193 Å, most of the absorption structure seen at 195 Å seems to flow away from the image plane and then disappears. This also indicates that a significant amount of filament material is drained instead of erupting. After the material drainage, a very weak emission structure appears at 195 Å (Figure 1(p)), which is co-spatial with the erupting prominence seen at 304 Å (Figure 1(n)).
In Figure 2(a), we present a time slice of Hα images that show the evolution of the filament in detail. This slit-image is composed of strips taken from the Hα images throughout the trajectory shown by the blue curve in Figure 1(b), with the horizontal and vertical axes representing time and distance, respectively. Thus, the slope of an inclined feature in the slit-image specified its transverse velocity and the direction in the plane of the sky. The filament clump and the pillar appear to be two dark horizontal bands around 550 and 350 arcsec on the slit-image, respectively. The upper band implies that the filament clump appears on the northern segment of the trajectory until 22:00 UT. Several dark rippled structures on the slit-image are clearly observed from ∼16:00 UT onward, indicating that some filament threads start to oscillate along the filament axis. As seen from the magnified Hα slit-image in Figure 2(d), all of the oscillatory threads start at the clump indicated by the upper band and travel southward before reversing for the first time in the middle segment of the filament. The plus symbols in Figure 2(d) identify two clearly oscillating threads, labeled T1 and T2, respectively. Both threads undergo approximately two oscillations before the threads cease to be detectable. By comparing the two oscillations, we find that the oscillation periods increase with time. The oscillations were therefore fitted to a sine function with a frequency that decreases linearly with time. In the slit-image, the displacement of the threads can thus be expressed as: d(t) = a0 + b0t + Asin (2π(b1 − a1(t − t0))(t − t0) + ϕ), where a0 + b0t indicates the slowly shifting equilibrium position of the oscillation. For T1, A = 35.9 Mm, b1 = 0.9, a1 = 0.07/hr, t0 = 17.7 hr, and ϕ = 3.25. For T2, A = 42.3 Mm, b1 = 0.84, a1 = 0.1/hr, t0 = 18.2 hr, and ϕ = 3.73. Thus, the oscillations start with an oscillation period of 67 minutes for T1 and 71 minutes for T2. After two hours, the period increases to 80 minutes for T1 and 94 minutes for T2, during which time oscillations are observed in the slit-image.
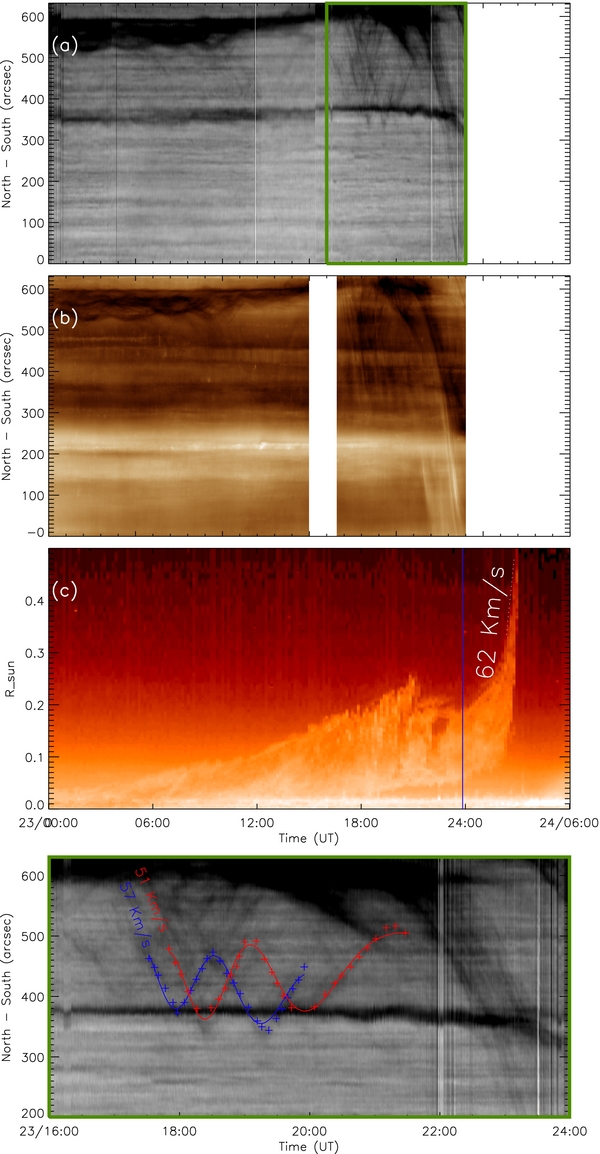
Figure 2. (a)–(c) GONG/Hα, SDO/AIA 193 Å, and STEREO-B EUVI 304 Å slit images for the slit depicted by the blue curve in Figures 1(b), (f), and (m), respectively. The time ticks on the three panels are the same. In panel (c), the blue vertical line indicates the time when the filament starts to rise rapidly at 24:00 UT. (d) The enlarged Hα slit-image of the area indicated by the green boxes on panel (a). The plus symbols in panel (d) indicate two oscillatory threads, and the blue (red) curve is a fit to the blue (red) plus symbols in a form of d(t) = a0 + b0t + Asin (2π(b1 − a1(t − t0))(t − t0) + ϕ).
Download figure:
Standard image High-resolution imageIn Figure 2(a), on the other hand, a thick dark feature visible after 21:00 UT, which spans from the top to the bottom of the slit-image. It indicates that instead of reversing in the middle region of the filament, the flowing material runs toward the southern endpoint of the filament at a velocity of ∼62 Km s−1. Moreover, most of the flowing material does not have the same mass as that seen in the oscillation. There is much more flowing material than the preceding oscillations.
The slit-image corresponding to SDO/AIA 193 Å images was also obtained (Figure 2(b)) for the same trajectory. The persistent bright band around 200 arcsec results from a loop structure. The slit-image also shows rippled structures, albeit less evidently. Similar in the Hα slit-image, a thick inclined band shows that some southward mass flow disappears around 500 arcsec, then reappears in emission around 200 arcsec with the same slope. This transition from dark to bright starts at approximately 21:00 UT and lasts approximately two hours before it reaches the end of the slit, suggesting that during this period, the draining material increases in temperature when approaching the southern filament end.
The slit image presented in Figure 2(c) is derived from the STEREO-B/EUVI 304 Å images along the blue line shown in Figure 1(m), aligned along the radial direction and crossing the apex of the prominence at 17:56 UT. Because no obvious non-radial motion of the prominence is observed along the south–north direction, the brightening feature in the slit-image may indicate the approximate trajectory of prominence apex. The rising profile shows a slow rising motion starting at ∼04:00 UT and a definite jump in the filament height after 24:00 UT. Between these times, the height becomes stationary from 22:00 UT to 24:00 UT. The timing of the rising profile in relation to the motion along the filament axis indicates that the oscillating threads appear approximately 10 hours after the filament has begun to rise slowly, and that consistent with Animation 1, the substantial material drainage is immediately followed by the violent eruption.
4. DISCUSSION AND INTERPRETATION
The filament analyzed here has very different appearances depending on the imaging wavelength. It resembles a clump of absorption feature when observed in the Hα and 193 Å images, but is more extended in the 304 Å images. Prominences are noticably larger and more extended in 304 Å images than when observed by Hα or EUV absorption (Schmieder et al. 2007). The hotter emission at 304 Å most probably originates from the outer shell of the cooler material (that is, the prominence-corona transition region). After the filament is activated, the clump of material observed in Hα and 193 Å images undergoes the LAL oscillations followed by significant material drainage, whereas the subsequent eruptive part of the filament appears mainly in the 304 Å images.
LAL oscillations of a filament are well known to be often initiated by nearby sub-flares and jets. However, we did not observe the triggering events during the initiation of the LAL oscillations. In the filament under investigation, the oscillations were detected after the filament was slightly elevated. Second, the activated filament appeared to be inclined, with its northern section higher than its southern. The filament threads move southward before reversing at the start of the first oscillation. Because the thread motion is initially southward, the trigger for the oscillation must be on the northern side. The LAL oscillations are therefore presumably associated with the asymmetric rise of the activated filament. The oscillation energy may originate from magnetic restructuring due to the increased magnetic pressure associated with the rise and inclination of the filament. The oscillation may also be caused by a disturbance that pushes the threads away from their equilibrium position. This disturbance could result from the weak magnetic reconnection under the slowly rising filament. Gravity alone could make the material in the inclined filament reach a velocity of  ∼ 65 Km s−1, where g = 0.274 km s−2 is the solar gravitational constant, θ ∼ 14° is the angle between the inclined filament and the solar surface, and ▵h ∼ 35 Mm is the height difference. The θ and ▵h are determined by the difference in height and distance of the two points of the three-dimensional reconstruction in Section 3. The value of the predicting velocity is consistent with that of the observed speed of ∼60 Km s−1 at which the filament material travels along the axis, suggesting that the action of gravity is a strong candidate mechanism for triggering the LAL oscillations.
Another noteworthy observation is that the oscillation period of both threads changes during the two observed cycles. A similar change in period was reported in the transverse oscillation of a pre-eruptive filament (Isobe & Tripathi 2006; Bocchialini et al. 2011), possibly indicating the weakness of the restoring force. Considering the restoring force as originating from the projected gravity along the flux tubes, Luna & Karpen (2012) found a dependence of the oscillation periods on the average radius of curvature of the filament threads. Similar to a simple gravity-driven pendulum, the angular frequency of the oscillation is
where P is the period and g0 is the gravitational acceleration at the solar surface. Thus, an increasing period implies an increasing curvature radius of the filament magnetic field. It indicates that the magnetic dips evolve to be flatter in the course of the oscillations. Following Luna & Karpen (2012), we can further estimate the minimum magnetic field strength of the filament threads as

where n is the electron number density in filament. For a value of near the lower limit ∼1 × 1011 cm−3 (Koutchmy et al. 1983; Kucera et al. 1993; Labrosse et al. 2010) and a calculated maximum period of 1.8 hr, Equation (2) predicts that the magnetic field of the filament threads should be greater than 15 G.
In this case, LAL oscillations are followed by significant filament material drainage, which flows from the higher to the lower segment along the inclined filament axis. It therefore seems that the material flow is also driven by the gravity. A similar scenario was recently presented in which filament threads with a greater initial velocity pass the apex of the magnetic loop and drain downward instead of oscillating along the magnetic field (Zhang et al. 2013). In the reported event, however, the drainage velocity approached that of the preceding oscillation. An analogy is that in this case, the threads that display drainage may be located in a region with flatter field lines such that the magnetic loops cannot provide enough restoring force to confine the threads. Accordingly, the material drainage could result from the flattening of the magnetic dip, as implied by the increase in the oscillation period. Moreover, it is worth noting that only two oscillation cycles are observed in either of the oscillating threads. This could result from the plasma escaping on the southern side after the two oscillation cycles. This would be consistent with the flattening of the supporting field lines. Admittedly, we cannot be certain that each thread underwent oscillations before drainage. The threads that had drained may have been located in the flatter field lines before the filament was activated. However, such threads would be expected to drain once the oscillations are triggered, inconsistent with the observation that the drainage follows the oscillations.
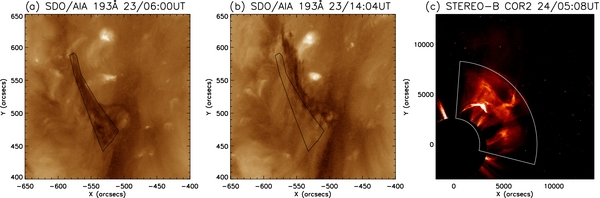
To derive the filament mass, Gilbert et al. (2005) used observations of the 195 Å coronal radiation, which is absorbed by filament material. More recently, Williams et al. (2013) used the near-synchronous data of the AIA 94, 131, 171, 193, and 211 Å channels to estimate the column density of the filament material by the polychromatic opacity imaging method. Using the optically thin coronal line ensures that the EUV intensity at a given point on a filament corresponds to the background intensity attenuated by a factor of e−τ (Kucera et al. 1998). In the event we report here, it is a filament clump that is observed in the AIA 193 Å images. The clump of the filament material is also detected in the near-synchronous multi-wavelength imaging data of the AIA 171, 193 and 211 Å channels. It is therefore possible to estimate the mass of the filament clump using the method described by Williams et al. (2013). The curve outlining the 06:00 UT 304 Å filament clump in Figure 3(a) is also plotted in Figure 3(b), where the filament at 14:00 UT has completely disappeared from the area as the outline indicated. The filament motion enables the EUV intensity to be measured in both the presence and absence of the filament (Figures 3(a) and (b), respectively). From the six measurements from near-synchronous data of the 171, 193, and 211 Å channels, we estimate column density of the filament clump to be 3.7 × 1019 cm−2, according to Equation (10) given by Williams et al. (2013). Integrating the density over the clump area, we obtain a filament clump mass of 1.0 × 10¹⁵ g.
Figure 3. (a)–(b) SDO/AIA 193 Å images showing the areas outlined in black are used to obtain mass measurements of the filament. (c) Base difference images (using a base image at time 6:07 UT) of the CME in COR2 B, with pixel values of grams in which the areas outlined in white are used to obtain mass measurements of the entire CME.
Download figure:
Standard image High-resolution image
We also estimated the mass of the CME associated with the filament, observed by COR1 and COR2 of both STEREO coronagraphs. We employed standard techniques (Hundhausen et al. 1994) that are further described by Vourlidas et al. (2000, 2010). Because the knowledge of the longitudinal propagation angle of the CME allows a significant reduction in the mass uncertainty (Carley et al. 2012), we estimated the mass of the associated CME using the COR2 images on board STEREO-B, which allows the immediate localization of the filament eruption on the solar limb. Considering the uncertainty in the longitudinal angular width of the CME, our final estimate is 5.0 ± 1.2 × 10¹⁵ g for the CME at 05:08 UT on February 24. Accordingly, the mass of the filament clump is about 20% of the associated CME. Since the filament clump was observed to almost completely drain before the filament began to rise quickly, it seems that the filament mass draining before the eruption is comparable with that of the associated CME. This is consistent with the models of mass loading in eruptions (Low et al. 2003; Fong et al. 2002), which predict that significant material drainage may facilitate an eruption. On the other hand, we note that the filament rose slowly over several hours and then the filament stayed a height plateau for two hours before it erupted. The timing of the material drainage relative to the filament rising profile shows that the drainage coincides with the height plateau and is followed systematically by the vigorous rising motion. This indicates that the filament mass drainage would play an important role in triggering the filament eruption at last. If the torus instability is responsible for the eruption, persistent material drainage could produce a further rise of the filament to a critical height where the filament axis reaches the threshold of the torus instability.
5. SUMMARY
We investigated the evolution of a filament prior to its eruption, which showed LAL oscillations and significant material drainage. We summarize the major results as follows.
- 1.After the filament is activated, the part of the filament with cooler temperature undergoes LAL oscillations and material drainage.
- 2.Both the oscillations and the material drainage occur in the direction along the inclined filament axis, suggesting that both motions may have been caused by the slow rising motion of the pre-eruptive filament.
- 3.The period of two oscillating threads are observed to increase with time over two cycles. This is consistent with the asymmetric rise of the magnetic structure, which could facilitate filament drainage.
- 4.Abundant filament material drainage is observed prior to the eruption. The mass of the filament material that is drained is less than 20% of the associated CME.
The authors sincerely thank the anonymous referee for detailed comments and useful suggestions for improving this manuscript. We thank the GONG, AIA, and STEREO teams for data support. This work is supported by the 973 Program(2011CB811403), by the Natural Science Foundation of China under grants 11173058 and 11273056, and by the CAS grant KJCX2-EW-T07. This work is supported by the Open Research Programs of CAS.