


ABSTRACT
We jointly analyze the gamma-ray burst (GRB) data observed with Burst Alert Telescope (BAT) and X-ray Telescope on board the Swift mission to present a global view on the internal energy dissipation processes in GRBs, including precursors, prompt gamma-ray emission, extended soft gamma-ray emission, and late X-ray flares. The Bayesian block method is utilized to analyze the BAT light curves to identify various emission episodes. Our results suggest that these emission components likely share the same physical origin, which is the repeated activation of the GRB central engine. What we observe in the gamma-ray band may be a small part of more extended underlying activities. The precursor emission, which is detected in about 10% of Swift GRBs, is preferably detected in those GRBs that have a massive star core-collapse origin. The soft extended emission tail, on the other hand, is preferably detected in those GRBs that have a compact star merger origin. Bright X-ray emission is detected during the BAT quiescent phases prior to subsequent gamma-ray peaks, implying that X-ray emission may be detectable prior the BAT trigger time. Future GRB alert instruments with soft X-ray capability are essential for revealing the early stages of GRB central engine activities, and shedding light on jet composition and the jet launching mechanism in GRBs.
Export citation and abstract BibTeX RIS
1. INTRODUCTION
Swift (Gehrels et al. 2004) has greatly improved our understanding of the nature of the gamma-ray burst (GRB) phenomenon since it was successfully launched in 2004. The Burst Alert Telescope (BAT; Barthelmy et al. 2005b) and X-ray Telescope (XRT; Burrows et al. 2005b) on board Swift observe the GRB prompt emission and afterglow for up to days and even months (Zhang et al. 2006; O'Brien et al. 2006; Liang et al. 2006, 2007; Zhang et al. 2007; Sakamoto et al. 2007; Chincarini et al. 2007; Falcone et al. 2007; Margutti et al. 2010). It is known that the conventional long–short GRB classification scheme, which was based on the bimodal burst duration (T90) distribution discovered from the GRB survey observations with the Burst And Transient Source Experiment (BATSE) on board the Compton Gamma-Ray Observatory (CGRO; Kouveliotou et al. 1993), meets the theoretical speculations on two types of GRBs from the deaths of massive stars (Colgate 1974; Woosley 1993) and mergers of two compact objects (e.g., Paczynski 1986, 1991; Eichler et al. 1989; Narayan et al. 1992; Bloom et al. 1999; see Berger 2013 for a review). However, the erratic, bright X-ray flares and long, soft extended emission tails (EE tails) observed with BAT and XRT challenge the simple classification using the T90 criterion. It is also interesting that some short-duration GRBs likely originated from the collapse of massive stars (Virgili et al. 2011; Zhang et al. 2009; Levesque et al. 2010a, 2010b; Xin et al. 2011; Belczynski et al. 2010). Qin et al. (2013) showed that the bimodal T90 distribution is significantly affected by instrumental selection effects. A physically motivated classification scheme, i.e., Type II (massive star origin) versus Type I (compact star origin), was proposed (Zhang 2006; Zhang et al. 2007), which demands multiple observational criteria (Zhang et al. 2009). Other classification parameters were also proposed (e.g., Lü et al. 2010; Goldstein et al. 2010).
The duration T90 is not a good representative of the duration of internal energy dissipation processes driven by central engine activities. Observationally, the GRB emission we observe starts from the detector trigger time in the gamma-ray band. It is unclear what may happen prior to the GRB trigger. The most extensively discussed GRB model is the internal shock model (Rees & Meszaros 1994; Kobayashi et al. 1997; Daigne & Mochkovitch 1998; Maxham & Zhang 2009; Daigne et al. 2011), which suggests that the observed highly variable emission of GRBs is from internal shocks due to the collisions of baryon-dominated shells ejected from the central engines. Alternatively, a magnetically dominated outflow may be launched from the central engine (Zhang & Pe'er 2009), which dissipates magnetic fields either continuously (e.g., Drenkhahn & Spruit 2002) or abruptly at large radii through internal collision-induced magnetic reconnection and turbulence (Zhang & Yan 2011). In general, the internal dissipation site should be above the photosphere and below the deceleration radius, and should have two emission components: a quasi-thermal emission component from the photosphere and a non-thermal component from the energy dissipation site (internal shocks for a baryon-dominated outflow and magnetic dissipation site for a magnetically dominated flow), and the observed emission is generally believed to be a superposition of these components (e.g., Mészáros & Rees 2000; Toma et al. 2011; Pe'er et al. 2012). Indeed, photosphere emission is observed to be superposed on the non-thermal component in the spectra of some GRBs (e.g., Ryde 2005; Ryde & Pe'er 2009; Ryde et al. 2010; Guiriec et al. 2011; Axelsson et al. 2012), and some GRBs even have a dominant thermal component, e.g., GRB 090902B (Ryde et al. 2010; Zhang et al. 2011). For GRBs with a massive star progenitor, there could be an additional emission site where the jet first breaks out from the star. The long-lasting soft emission from low-luminosity GRBs has been attributed to the shock breakout emission (e.g., GRB 060218, Campana et al. 2006; X-ray outburst 080109, Soderberg et al. 2008). Some authors have suspected that shock breakout or photosphere emission may give rise to precursor emission for long-duration GRBs (e.g., Lyutikov & Usov 2000; Ramirez-Ruiz et al. 2002). It would be interesting to check whether there is any observational evidence in support of these claims.
Another interesting issue regarding the lifetime of GRB internal energy dissipation processes is the residual emission after the main burst. Swift detected an EE tail in the BAT band for some "short" GRBs, and bright X-ray flares in the XRT band for about half of the Swift GRBs. Both the EE tails and X-ray flares may signal the late central engine activities of GRBs (Burrows et al. 2005a; Zhang et al. 2006; King et al. 2005; Fan & Wei 2005; Dai et al. 2006; Perna et al. 2006; Proga & Zhang 2006; Liang et al. 2006; Lazzati & Perna 2007; Lazzati et al. 2008; Lee et al. 2009; Maxham & Zhang 2009). The EE tails (Norris & Bonnell 2006) have attracted a lot of attention from the community, especially after the detection of GRB 060614, which is a nearby long GRB (T90 = 108.7 s at z = 0.125) without an accompanied supernova (SN), which is different from other known nearby long GRBs, such as GRB 980425/SN 1998bw (Galama et al. 1998; Kulkarni et al. 1998), GRB 030329/SN 2003dh (Stanek et al. 2003; Hjorth et al. 2003), GRB 031203/SN 2003lw (Malesani et al. 2004), GRB 060218/SN 2006aj (Modjaz et al. 2006; Pian et al. 2006; Sollerman et al. 2006; Mirabal et al. 2006; Cobb et al. 2006), and 100316D/SN 2010bh (Starling et al. 2011; Fan et al. 2011). It was proposed that GRB 060614 may be similar to those of some nearby "short" GRBs that may have a compact star merger origin (e.g., Gehrels et al. 2006; Zhang et al. 2007; Gal-Yam et al. 2006). A handful of Type I GRBs show such a component in their light curves (Norris & Gehrels 2008; Lin et al. 2008; Zhang et al. 2009), such as GRB 050724 (Barthelmy et al. 2005a; Tanvir et al. 2005; Berger et al. 2005) and GRB 050709 (Hjorth et al. 2005). Metzger et al. (2008) suggested that late-time accretion from a remnant disk created during a compact object merger can in principle provide sufficient energy to power such late-time central engine activity. Liu et al. (2012) proposed that radial angular momentum transfer in a massive disk may significantly prolong the lifetime of the accretion process and multiple episodes may be switched by a magnetic barrier (e.g., Proga & Zhang 2006; Cao et al. 2014). In general, it would be interesting to check observationally whether the EE tail and X-ray flares share similar or different observational properties with respect to prompt gamma-rays.
This paper presents a joint analysis of both BAT and XRT data of GRBs in order to give a global view of the emission from internal energy dissipation processes in GRBs. We systematically study all the emission components that are likely related to internal dissipation processes, including precursor emission, main episodes of prompt emission, an EE tail, and X-ray flares. We pay special attention to the following questions. Is there any preference for precursor emission or an EE tail to exist in Type I and Type II GRBs? What is the physical origin of precursor emission? Is there X-ray emission prior to the gamma-ray triggers? Our data and analysis method are presented in Section 2. The analysis results are reported in Section 3. Conclusions and a discussion are presented in Section 4.
2. DATA ANALYSIS
2.1. BAT Data
We analyze the BAT and XRT data of 613 GRBs that triggered Swift/BAT by 2012 May 14. The data are downloaded from the NASA Swift Archive. We extract the light curves and spectra for the BAT data with the standard Swift scientific tools. Because of the narrowness of the BAT band, the BAT spectra are usually fit with a single power-law model, which is adequate to fit the spectra in our sample (e.g., Sakamoto et al. 2011; Zhang et al. 2007). In order to search for a low-significance signal before and after the duration covered by T90, the extracted BAT light curves usually cover 200–300 s prior to the BAT triggers and 200–300 s after T90 of the GRBs. The method of Bayesian blocks (BBs; Scargle 1998) is used to search for possible signals in the light curves. We find that the radiation episodes are poorly identified with the 64 ms binned light curves. Therefore, we re-bin the light curves with a bin size of 1 s, 2 s, 4 s, and 8 s, respectively, and pick up all blocks from the light curves based on our analysis with the BB method. We outline our BAT data analysis procedure as follows.
- 1.Select background time intervals, which are normally taken from 100–200 s prior to the BAT trigger and 100–200 after T90. The selection of the background intervals is essential in identifying a weak signal. We set a background time window and move the window to search for a proper background interval in which no block identified with the BB method has a signal-to-noise ratio (S/N) greater than 2σ in an 8 s binned light curve, where σ is the standard deviation of the data in the window.
- 2.Utilize the BB method to pick up emission episodes by progressively re-binning the light curves with a bin size of 1 s, 2 s, 4 s, and 8 s. The criterion for a radiation episode is taken as S/N > 3σ. The increase in bin size can reduce the level of background noise. We calculate the corresponding σ of the background noise, and then analyze the temporal structure of the light curves with the BB method. Note that a proper bin size is critical in identifying a weak signal. The increase in bin size is helpful in identifying a weak signal with a long duration, but may smear out an extremely short duration signal. Therefore, we progressively re-bin the light curves in size of 1 s, 2 s, 4 s, and 8 s, until the possible weak signals can be identified.
- 3.Measure the duration and separation of each episode. The duration of an episode is estimated with td = Te − Tb, where Te and Tb are the starting and ending times at S/N = 3.
Examples of our analysis with the BB method are shown in Figure 1 with a typical long GRB 041224 and a typical short GRB 050925. Two separated emission episodes are identified for GRB 041224. One is the main episode in the time interval from T0 − 25 to T0 + 60 s, which is well identified from the 1 s binned light curve. It contains some overlapped pulses. It triggered BAT at nearly the peak time interval of the light curve. A long, weak signal is also seen prior to the main episode, but its S/N is smaller than 3σ in the 1 s binned light curve. Increasing the bin size to 2 s, this episode stands out with S/N > 3σ. We therefore pick up this episode from the 2 s binned light curve. Different from the main episode, this episode is composed of some significant flickerings, and the emission level stays almost constant. In the 4 s and 8 s binned light curves, this episode can be recognized with a higher confidence level. The main episode is also followed by a weak, EE component, but its S/N value is smaller than 3 in these light curves. We do not identify it as an EE component from the light curves. For short GRBs, especially for those extremely short GRBs with a duration of less than 1 s, a large bin size may smear out its main episode, as shown in Figure 1 for GRB 050925. We therefore prefer to identify an emission episode from the light curves in a small bin size for these GRBs.
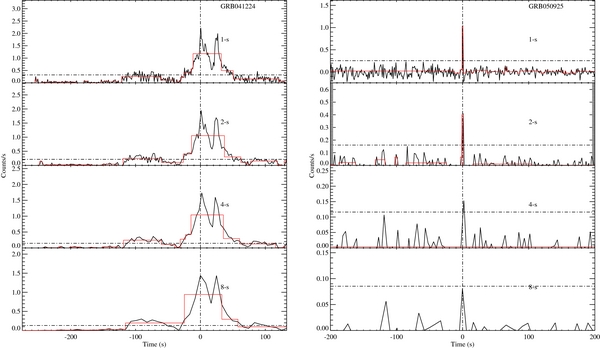
Figure 1. Examples of our Bayesian block analysis (step lines) for light curves of long (left panel) and short (right panel) GRBs with different bin sizes (connected lines). The vertical lines mark the BAT trigger time.
Download figure:
Standard image High-resolution image2.2. XRT Data
The rapid slewing capacity of XRT makes it possible to catch the X-ray emission from very early to very late episodes of GRBs (Burrows et al. 2005a; Chincarini et al. 2007; Margutti et al. 2010). We obtain the XRT light curves of all bursts in our sample from http://www.swift.ac.uk (Evans et al. 2007, 2009). The X-ray data are mixed with both flares and underlying power-law afterglow segments, and are non-uniformly binned. We do not utilize the BB method to analyze the XRT data, but identify a flare with a criterion of ΔF/F ⩾5, where ΔF = Fp − F is the peak flux (Fp) over the underlying flux F.
3. RESULTS
3.1. The Main Emission Episodes
Based on our analysis with the BB method, we identify emission episodes as connected blocks. One emission episode may contain one or several overlapped pulses. Because X-ray flares are temporarily separated from prompt emission, we explore whether the main GRB component may sometimes include multiple separated episodes. We find that the BAT light curves of 73% of GRBs in our sample are composed of one episode only, and the others are composed of several episodes. We show the distributions of the durations (td) and separation time intervals (ts) for the identified episodes in Figure 2. It is found that the typical td range from 10 to 100 s. The ts distribution is also in the same range.
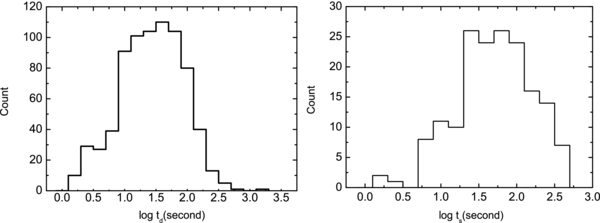
Figure 2. Distributions of duration (td, left panel) and separation interval (ts, right panel) of the episodes derived from our analysis with the BB method.
Download figure:
Standard image High-resolution image3.2. Precursors
Precursors are of interest in our analysis. We find 50 GRBs whose light curves start with a low-S/N episode followed by a bright emission episode. The low-S/N episode may be separated from or closely connected to the bright episode. Traditionally, a precursor is defined if the early low-S/N component triggers BAT (e.g., Burlon et al. 2008, 2009). We find that the low-S/N component in some GRBs did not trigger BAT. Here, we adopt the term precursor to refer to an early low-S/N component leading the main emission episode regardless of whether it triggered BAT. Among the 50 GRBs, 22 were trigged with the precursor, whereas the other 28 GRBs were triggered with the main bursts. Figures 3 and 4 show examples of the triggered and non-triggered precursors, respectively. We measure the duration of the precursor and its separation from the main episode based on our BB analysis results for each burst. Our results are reported in Table 1. The average count rate ratio of the precursor to the main burst spans from 0.05 to 0.5, with a typical value of ∼0.2, as shown in Figure 5, left panel. The distribution of the ratio between the durations of the precursor and the main episode is shown in Figure 5, right panel. It is found that the majority of precursors are shorter than the main burst. The duration ratio concentrates around 0.5. We also extract and fit the spectra of the precursors and the main bursts of these GRBs. Figure 6, left panel shows the comparison of the photon index of the precursor and main episode (Γp and Γm). We find that photon indices of the precursors are comparable to those of the main episodes (see also Burlon et al. 2008). We do not find any systematic differences between the triggered and non-triggered precursors. These results seem to indicate that the precursor is a weak emission episode that has the same origin as the main burst in a GRB.
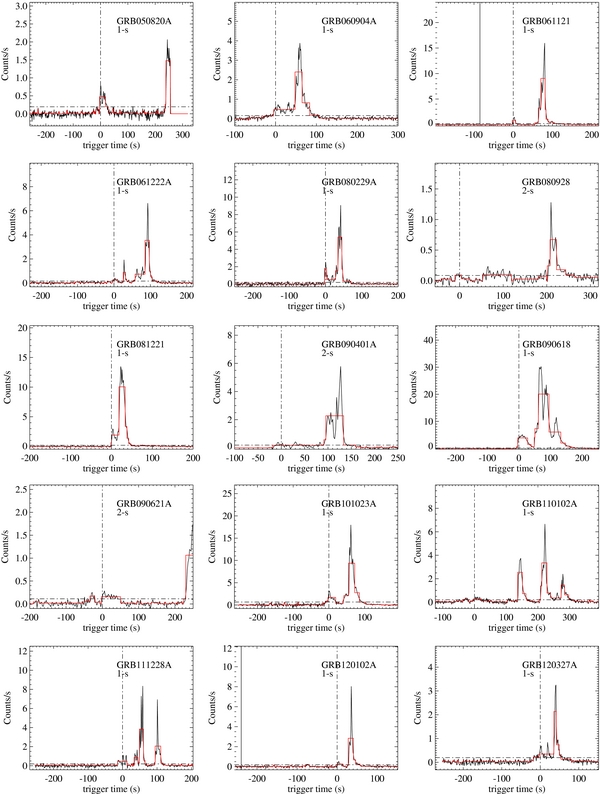
Figure 3. Examples of our analysis results (step lines) with the BB method for the BAT light curves (connected lines) of GRBs triggered with a precursor. The vertical dashed lines mark the BAT trigger time. The horizontal lines mark the 3σ of the background data in the given time interval as shown in Table 1. The selected bin sizes are also shown.
Download figure:
Standard image High-resolution image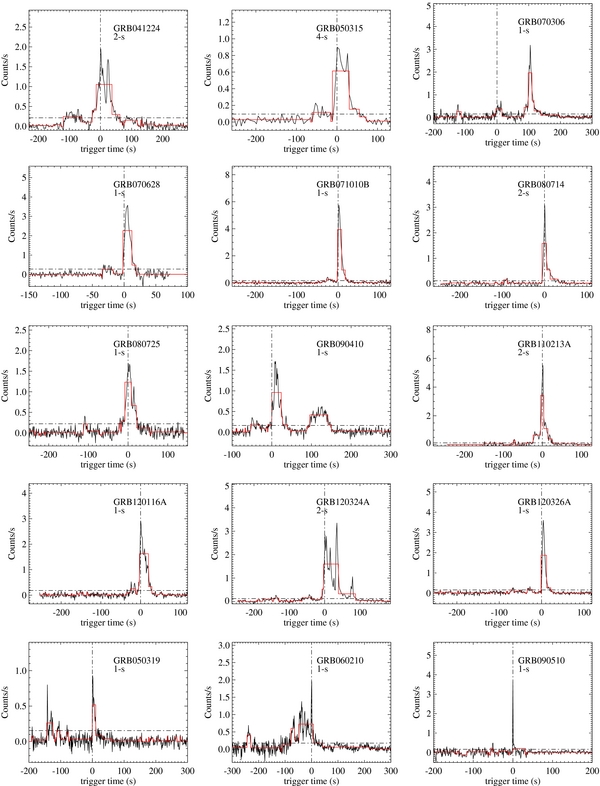
Figure 4. Same as Figure 3, but for non-triggered precursors.
Download figure:
Standard image High-resolution image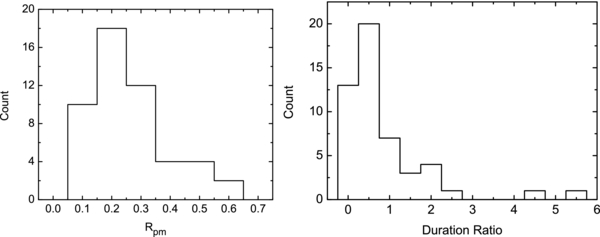
Figure 5. Ratio Distributions of the average count rate (Rpm = Cp/Cm, left panel) and duration ( , right panel) of the precursor to the main episode, where
  and
and  are the durations of the precursor and main burst, respectively.
Download figure:
Standard image High-resolution image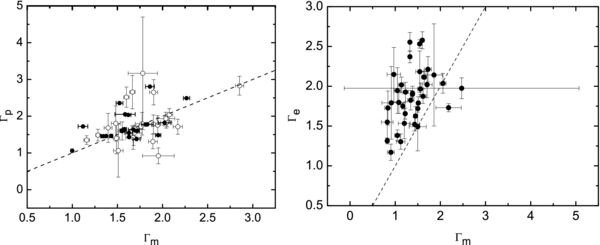
Figure 6. Comparisons of the photon index of the main bursts to that of the precursor (left panel) and the EE tail (right panel). The filled and open circles in the left panel are for the triggered and non-triggered precursors, respectively. The dashed lines are the equality lines.
Download figure:
Standard image High-resolution imageTable 1. Our Analysis Results for Triggered and Non-triggered Precursors
| GRB | T90 | BGa | Precursorb | Cpc | Main Burstd | Cme | Rpmf | Γpg | Γmh |
|---|---|---|---|---|---|---|---|---|---|
| (s) | (s) | (s) | (c/s) | (s) | (c/s) | ||||
| Triggered | |||||||||
| 050820A | 26 | −300 ∼ −200 | −33.79 ∼ 24.002 | 0.335 | 213.89 ∼ 238.658 | 1.343 | 0.249 | 1.722 ± 0.079 | 1.118 ± 0.054 |
| 060322 | 221.5 | 400 ∼ 600 | −55.285 ∼ 35.531 | 0.274 | 151.115 ∼ 200.651 | 0.562 | 0.488 | 1.379 ± 0.065 | 1.712 ± 0.040 |
| 060904A | 80.1 | 700 ∼ 900 | −29.646 ∼ 36.402 | 0.41 | 36.402 ∼ 94.194 | 1.324 | 0.309 | 1.647 ± 0.048 | 1.577 ± 0.023 |
| 061007 | 75.3 | 700 ∼ 900 | −5.845 ∼ 10.667 | 2.981 | 18.923 ∼ 93.227 | 7.231 | 0.412 | 1.061 ± 0.033 | 0.998 ± 0.013 |
| 061121 | 81.3 | 700 ∼ 900 | −4.103 ∼ 4.217 | 0.804 | 58.297 ∼ 99.897 | 5.646 | 0.142 | 1.464 ± 0.058 | 1.431 ± 0.015 |
| 061202 | 91.2 | 700 ∼ 900 | −5.845 ∼ 10.667 | 0.108 | 43.691 ∼ 151.019 | 0.823 | 0.131 | 2.357 ± 0.329 | 1.523 ± 0.038 |
| 061222A | 71.4 | 400 ∼ 500 | −22.817 ∼ 10.207 | 0.141 | 18.463 ∼ 117.535 | 2.029 | 0.069 | 1.458 ± 0.158 | 1.344 ± 0.022 |
| 071021 | 225 | 500 ∼ 700 | −38.563 ∼ 60.509 | 0.053 | 60.509 ∼ 101.789 | 0.183 | 0.289 | 2.051 ± 0.245 | 1.585 ± 0.112 |
| 080229A | 64 | 700 ∼ 900 | −12.392 ∼ 20.632 | 0.596 | 20.632 ∼ 70.168 | 2.757 | 0.216 | 1.484 ± 0.085 | 1.952 ± 0.029 |
| 080928 | 280 | −250 ∼ −150 | −13.795 ∼ 111.013 | 0.093 | 193.573 ∼ 259.621 | 0.484 | 0.192 | 1.781 ± 0.182 | 1.832 ± 0.064 |
| 081210 | 146 | 500 ∼ 700 | −14.569 ∼ 14.807 | 0.319 | 14.807 ∼ 21.335 | 1.101 | 0.289 | 1.462 ± 0.081 | 1.376 ± 0.062 |
| 081221 | 34 | 500 ∼ 700 | −5.74 ∼ 10.771 | 1.464 | 10.771 ∼ 35.54 | 6.596 | 0.222 | 1.775 ± 0.042 | 1.816 ± 0.015 |
| 090401A | 112 | 500 ∼ 700 | −19.157 ∼ 88.171 | 0.176 | 88.171 ∼ 162.476 | 2.054 | 0.086 | 1.603 ± 0.106 | 1.718 ± 0.026 |
| 090621A | n/a | −200 ∼ −100 | −46.819 ∼ 43.997 | 0.12 | 217.373 ∼ 233.885 | 0.677 | 0.177 | 1.629 ± 0.108 | 1.680 ± 0.059 |
| 090618 | 113.2 | 500 ∼ 700 | −5.071 ∼ 44.465 | 2.673 | 44.465 ∼ 120.059 | 16.271 | 0.164 | 1.434 ± 0.016 | 1.628 ± 0.011 |
| 090904A | 122 | 500 ∼ 700 | 27.485 ∼ 77.021 | 0.131 | 118.301 ∼ 184.349 | 0.631 | 0.207 | 2.806 ± 0.223 | 1.860 ± 0.049 |
| 100902A | 428.8 | 700 ∼ 900 | −53.914 ∼ 36.902 | 0.074 | 127.718 ∼ 243.302 | 0.21 | 0.352 | 1.822 ± 0.202 | 2.023 ± 0.069 |
| 101023A | 80.8 | 500 ∼ 700 | −14.488 ∼ 18.536 | 1.235 | 35.048 ∼ 92.84 | 4.926 | 0.251 | 1.634 ± 0.072 | 1.580 ± 0.016 |
| 110102A | 264 | 500 ∼ 700 | −38.563 ∼ 35.741 | 0.182 | 93.533 ∼ 275.165 | 0.931 | 0.195 | 1.609 ± 0.104 | 1.548 ± 0.021 |
| 111228A | 101.2 | 500 ∼ 700 | −19.221 ∼ 30.315 | 0.285 | 30.315 ∼ 112.875 | 2.018 | 0.141 | 2.490 ± 0.178 | 2.266 ± 0.035 |
| 120102A | 38.7 | 500 ∼ 700 | −6.297 ∼ 10.215 | 0.214 | 18.471 ∼ 51.495 | 2.033 | 0.105 | 2.034 ± 0.199 | 1.619 ± 0.031 |
| 120327A | 62.9 | 500 ∼ 700 | −22.728 ∼ 26.808 | 0.283 | 26.808 ∼ 76.344 | 1.12 | 0.253 | 1.548 ± 0.071 | 1.627 ± 0.044 |
| Non-triggered | |||||||||
| 041224 | 177.2 | 200 ∼ 300 | −115.568 ∼ −24.752 | 0.196 | −24.752 ∼ 57.808 | 0.943 | 0.208 | 1.657 ± 0.102 | 1.693 ± 0.034 |
| 050315 | 95.6 | −300 ∼ −200 | −66.967 ∼ −9.175 | 0.105 | −9.175 ∼ 65.129 | 0.613 | 0.171 | 1.714 ± 0.205 | 2.169 ± 0.050 |
| 050319 | 152.5 | 200 ∼ 300 | −143.973 ∼ −124.389 | 0.262 | −0.357 ∼ 10.523 | 0.518 | 0.506 | 1.934 ± 0.174 | 2.037 ± 0.098 |
| 050713A | 124.7 | −300 ∼ −200 | −74.28 ∼ −49.512 | 0.123 | −8.232 ∼ 74.328 | 1.565 | 0.079 | 1.398 ± 0.421 | 1.488 ± 0.036 |
| 060115 | 139.6 | 200 ∼ 300 | −66.612 ∼ −17.076 | 0.052 | −17.076 ∼ 115.02 | 0.291 | 0.179 | 1.795 ± 0.308 | 1.773 ± 0.075 |
| 060204B | 139.4 | 200 ∼ 300 | −189.227 ∼ −164.459 | 0.063 | −40.619 ∼ 17.173 | 0.387 | 0.163 | 1.682 ± 0.397 | 1.397 ± 0.044 |
| 060418 | 103.1 | 500 ∼ 700 | −88.446 ∼ −55.422 | 0.122 | −22.398 ∼ 51.906 | 1.396 | 0.087 | 2.657 ± 0.453 | 1.666 ± 0.029 |
| 060707 | 66.2 | 500 ∼ 700 | −53.194 ∼ −32.394 | 0.186 | −7.434 ∼ 30.006 | 0.39 | 0.477 | 1.416 ± 0.213 | 1.679 ± 0.086 |
| 070306 | 209.5 | 500 ∼ 700 | −19.753 ∼ 21.527 | 0.223 | 79.319 ∼ 153.623 | 0.979 | 0.228 | 1.597 ± 0.142 | 1.663 ± 0.033 |
| 070628 | 39.1 | −200 ∼ −100 | −39.466 ∼ −14.698 | 0.168 | −6.442 ∼ 18.326 | 1.835 | 0.092 | 2.651 ± 0.344 | 1.901 ± 0.045 |
| 070911 | 162 | −300 ∼ −200 | −73.796 ∼ −15.295 | 0.202 | −15.295 ∼ 149.825 | 0.854 | 0.236 | 1.719 ± 0.077 | 1.760 ± 0.023 |
| 071010B | >35.7 | −250 ∼ −150 | −47.093 ∼ −5.813 | 0.13 | −5.813 ∼ 27.211 | 2.535 | 0.051 | 1.844 ± 0.134 | 2.051 ± 0.026 |
| 080710 | 120 | −250 ∼ −150 | −99.921 ∼ −29.201 | 0.099 | −4.241 ∼ 24.879 | 0.194 | 0.510 | 0.922 ± 0.216 | 1.954 ± 0.176 |
| 080714 | 33 | 500 ∼ 700 | −103.587 ∼ −62.307 | 0.052 | −12.771 ∼ 45.021 | 0.858 | 0.0606 | 1.063 ± 0.720 | 1.509 ± 0.054 |
| 080725 | 120 | −250 ∼ −150 | −113.472 ∼ −96.96 | 0.104 | −22.656 ∼ 51.648 | 0.711 | 0.146 | 1.803 ± 0.477 | 1.482 ± 0.049 |
| 080906 | 147 | 500 ∼ 700 | −88.526 ∼ −14.222 | 0.065 | −14.222 ∼ 93.106 | 0.452 | 0.144 | 1.600 ± 0.246 | 1.553 ± 0.047 |
| 081109A | 190 | 500 ∼ 700 | −88.962 ∼ −22.914 | 0.042 | −22.914 ∼ 84.414 | 0.546 | 0.077 | 1.418 ± 0.319 | 1.674 ± 0.041 |
| 081128 | 100 | 500 ∼ 700 | −63.331 ∼ −5.539 | 0.096 | −5.539 ∼ 77.021 | 0.351 | 0.273 | 1.831 ± 0.157 | 2.041 ± 0.063 |
| 090123 | 131 | 500 ∼ 700 | −52.512 ∼ −15.072 | 0.19 | −15.072 ∼ 63.968 | 0.427 | 0.445 | 1.540 ± 0.162 | 1.685 ± 0.089 |
| 090410 | 165 | 300 ∼ 400 | −54.164 ∼ −4.628 | 0.138 | −4.628 ∼ 135.724 | 0.87 | 0.158 | 1.349 ± 0.117 | 1.159 ± 0.032 |
| 091221 | 68.5 | 600 ∼ 700 | −47.488 ∼ −6.208 | 0.147 | −6.208 ∼ 43.328 | 1.214 | 0.121 | 2.517 ± 0.276 | 1.600 ± 0.029 |
| 100727A | 84 | 500 ∼ 700 | −88.913 ∼ −14.609 | 0.05 | −6.353 ∼ 26.671 | 0.307 | 0.162 | 1.783 ± 0.251 | 1.898 ± 0.074 |
| 110213A | 48 | 500 ∼ 700 | −41.137 ∼ −7.857 | 0.595 | −7.857 ∼ 25.423 | 1.975 | 0.301 | 1.758 ± 0.257 | 1.947 ± 0.070 |
| 110305A | 12 | 500 ∼ 700 | −103.49 ∼ −86.978 | 0.116 | −12.674 ∼ 12.094 | 0.319 | 0.364 | 3.167 ± 1.529 | 1.781 ± 0.162 |
| 110315A | 77 | 400 ∼ 600 | −80.682 ∼ −35.598 | 0.133 | −35.598 ∼ 20.978 | 0.683 | 0.195 | 1.311 ± 0.196 | 1.893 ± 0.049 |
| 120116A | 41 | 500 ∼ 700 | −31.154 ∼ −6.385 | 0.206 | −6.385 ∼ 26.639 | 1.397 | 0.147 | 2.830 ± 0.257 | 2.853 ± 0.046 |
| 120324A | 118 | 500 ∼ 700 | −71.95 ∼ −12.545 | 0.106 | −12.545 ∼ 86.527 | 1.378 | 0.077 | 1.486 ± 0.160 | 1.284 ± 0.022 |
| 120326A | 69.6 | 300 ∼ 400 | −71.901 ∼ −5.853 | 0.085 | −5.853 ∼ 18.915 | 1.401 | 0.061 | 2.039 ± 0.169 | 2.074 ± 0.037 |
Notes. aTime interval of the background calculation. bTime interval of the precursor. cAverage count rate of the precursor estimated with our BB analysis. dTime interval of the main burst. eAverage count rate of the main burst estimated with our BB analysis. fThe ratio Cp/Cm. gγ-ray photo index of the precursor. hPhoton index of the main burst.
Download table as: ASCIITypeset image
Table 2. The BAT Observations and our Fitting Results of GRBs with an Extended Emission
| GRB | T90 | BGa | Main Burstb | Cmc | EE Taild | Cee | Rmef | Γmg | Γeh |
|---|---|---|---|---|---|---|---|---|---|
| (s) | (s) | (s) | (c/s) | (s) | (c/s) | ||||
| 050717 | 85 | −300 ∼ −200 | −9.062 ∼ 32.218 | 1.047 | 32.218 ∼ 114.778 | 0.26 | 4.027 | 1.221 ± 0.029 | 1.656 ± 0.069 |
| 050724 | 96 | −200 ∼ −100 | −1.547 ∼ 2.805 | 1.024 | 2.805 ∼ 108.341 | 0.089 | 11.506 | 1.706 ± 0.113 | 2.020 ± 0.163 |
| 050911 | 16.2 | −500 ∼ −200 | −2.329 ∼ 19.431 | 0.2 | 28.135 ∼ 156.519 | 0.076 | 2.632 | 1.858 ± 0.184 | 2.142 ± 0.642 |
| 051227 | 114.6 | −300 ∼ −200 | −1.53 ∼ 3.91 | 0.343 | 3.91 ∼ 145.35 | 0.077 | 4.455 | 1.202 ± 0.133 | 1.534 ± 0.192 |
| 060306 | 61.2 | −300 ∼ −200 | −6.89 ∼ 1.43 | 1.228 | 22.23 ∼ 63.83 | 0.249 | 4.932 | 1.617 ± 0.070 | 1.874 ± 0.091 |
| 060428A | 39.5 | 500 ∼ 700 | −1.173 ∼ 18.411 | 0.873 | 24.939 ∼ 46.699 | 0.252 | 3.464 | 2.057 ± 0.068 | 2.036 ± 0.124 |
| 060507 | 183.3 | 500 ∼ 700 | −12.257 ∼ 30.175 | 0.439 | 30.175 ∼ 199.903 | 0.2 | 2.195 | 1.558 ± 0.063 | 1.966 ± 0.074 |
| 060607A | 102.2 | 500 ∼ 700 | −22.648 ∼ 26.888 | 0.388 | 26.888 ∼ 117.704 | 0.069 | 5.623 | 1.450 ± 0.042 | 1.626 ± 0.120 |
| 060614 | 108.7 | −250 ∼ −150 | −2.839 ∼ 3.689 | 5.254 | 17.833 ∼ 91.817 | 3.213 | 1.635 | 1.631 ± 0.041 | 2.115 ± 0.023 |
| 060814 | 145.3 | 700 ∼ 900 | −14.214 ∼ 84.858 | 1.823 | 84.858 ∼ 159.162 | 0.289 | 6.308 | 1.499 ± 0.019 | 1.720 ± 0.045 |
| 061006 | 129.9 | 600 ∼ 800 | −25.968 ∼ −23.791 | 2.224 | −23.791 ∼ 36.049 | 0.158 | 14.076 | 2.471 ± 2.600 | 1.975 ± 0.131 |
| 061210 | 85.3 | 600 ∼ 800 | −0.901 ∼ 1.099 | 1.2 | 1.099 ∼ 105.723 | 0.124 | 9.677 | 0.824 ± 0.130 | 1.550 ± 0.206 |
| 070223 | 88.5 | 500 ∼ 700 | −6.007 ∼ 43.529 | 0.245 | 43.529 ∼ 101.321 | 0.104 | 2.356 | 1.725 ± 0.080 | 2.213 ± 0.160 |
| 070420 | 76.5 | −250 ∼ −150 | −6.08 ∼ 19.264 | 2.822 | 19.264 ∼ 72.064 | 0.463 | 6.095 | 1.511 ± 0.037 | 1.790 ± 0.080 |
| 070714B | 64 | 600 ∼ 800 | −1.7 ∼ 1.564 | 1.47 | 1.564 ∼ 109.276 | 0.065 | 22.615 | 1.049 ± 0.071 | 1.946 ± 0.288 |
| 071227 | 1.8 | 700 ∼ 900 | −1.479 ∼ 1.785 | 0.683 | 1.785 ∼ 164.985 | 0.044 | 15.523 | 0.969 ± 0.151 | 2.148 ± 0.339 |
| 080603B | 60 | 400 ∼ 500 | −3.632 ∼ 21.328 | 1.044 | 37.968 ∼ 67.088 | 0.342 | 3.053 | 1.643 ± 0.038 | 2.114 ± 0.073 |
| 080905B | 128 | 700 ∼ 900 | −8.149 ∼ 8.491 | 0.431 | 58.411 ∼ 104.171 | 0.189 | 2.280 | 1.429 ± 0.117 | 1.521 ± 0.084 |
| 090530 | 48 | −250 ∼ −150 | −1.122 ∼ 11.934 | 1.334 | 26.078 ∼ 43.486 | 0.155 | 8.606 | 1.544 ± 0.089 | 2.183 ± 0.261 |
| 090715A | 63 | 500 ∼ 700 | −3.567 ∼ 4.753 | 0.522 | 17.233 ∼ 62.993 | 0.095 | 5.495 | 0.912 ± 0.209 | 1.791 ± 0.456 |
| 090916 | 63.4 | 500 ∼ 700 | −1.173 ∼ 5.355 | 0.489 | 5.355 ∼ 82.603 | 0.081 | 6.037 | 1.498 ± 0.190 | 1.492 ± 0.303 |
| 091208A | 29.1 | −250 ∼ −150 | −14.69 ∼ 26.59 | 0.288 | 26.59 ∼ 101.26 | 0.057 | 5.053 | 0.838 ± 0.074 | 1.727 ± 0.213 |
| 100423A | n/a | −150 ∼ −50 | −3.697 ∼ 9.358 | 2.191 | 9.358 ∼ 97.487 | 0.865 | 2.533 | 0.823 ± 0.030 | 1.313 ± 0.037 |
| 100522A | 35.3 | 500 ∼ 700 | −3.648 ∼ 4.672 | 1.777 | 21.312 ∼ 37.952 | 0.505 | 3.519 | 1.601 ± 0.042 | 2.577 ± 0.107 |
| 100606A | 480 | 500 ∼ 700 | −2.145 ∼ 23.199 | 1.15 | 23.199 ∼ 84.447 | 0.505 | 2.277 | 1.047 ± 0.059 | 1.382 ± 0.068 |
| 100704A | 197.5 | 400 ∼ 600 | −22.744 ∼ 10.28 | 0.936 | 142.376 ∼ 191.912 | 0.335 | 2.794 | 1.326 ± 0.031 | 2.371 ± 0.076 |
| 100725A | 141 | 500 ∼ 700 | −6.245 ∼ 16.987 | 0.335 | 25.435 ∼ 65.563 | 0.157 | 2.134 | 0.904 ± 0.078 | 1.171 ± 0.102 |
| 100802A | 487 | 800 ∼ 900 | −12.521 ∼ 28.759 | 0.266 | 28.759 ∼ 111.319 | 0.087 | 3.057 | 1.342 ± 0.069 | 1.824 ± 0.123 |
| 100814A | 174.5 | 500 ∼ 700 | −4.967 ∼ 33.05 | 1.485 | 60.505 ∼ 157.657 | 0.649 | 2.288 | 1.170 ± 0.024 | 1.751 ± 0.037 |
| 100906A | 114.4 | 500 ∼ 700 | −6.111 ∼ 18.657 | 3.096 | 92.961 ∼ 125.985 | 0.674 | 4.593 | 1.541 ± 0.021 | 2.532 ± 0.052 |
| 101011A | 71.5 | 500 ∼ 700 | −1.581 ∼ 3.859 | 0.661 | 3.859 ∼ 39.763 | 0.241 | 2.743 | 1.121 ± 0.094 | 1.303 ± 0.096 |
| 101017A | 70 | 500 ∼ 700 | −14.496 ∼ 26.784 | 3.189 | 26.784 ∼ 76.32 | 0.499 | 6.391 | 1.382 ± 0.019 | 1.898 ± 0.043 |
| 110402A | 60.9 | −250 ∼ −150 | −0.388 ∼ 5.948 | 1.271 | 5.948 ∼ 60.86 | 0.495 | 2.568 | 1.078 ± 0.146 | 1.796 ± 0.137 |
| 111103B | 167 | 400 ∼ 500 | −14.287 ∼ 35.249 | 1.878 | 93.041 ∼ 134.321 | 0.243 | 7.728 | 1.384 ± 0.023 | 1.911 ± 0.089 |
| 111121A | 119 | 500 ∼ 700 | −2.739 ∼ 1.485 | 1.71 | 1.485 ∼ 62.733 | 0.204 | 8.382 | 1.136 ± 0.066 | 2.017 ± 0.098 |
| 120514A | 164.4 | 500 ∼ 700 | −8.951 ∼ 10.057 | 0.843 | 43.849 ∼ 69.193 | 0.227 | 3.714 | 1.229 ± 0.060 | 1.927 ± 0.122 |
Notes. aTime interval of the background calculation. bTime interval of the main burst. cAverage count rate of the main burst estimated with our BB analysis. dTime interval of the EE tail. eAverage count rate of the EE tail estimated with our BB analysis. fThe ratio Cm/Ce. gγ-ray photo index of the main burst. hPhoton index of the EE tail.
Download table as: ASCIITypeset image
We include 57 GRBs with T90 < 2 s in our sample. Except for GRB 090510, we do not find other strong cases that have a significant precursor.4 This result likely indicates that the precursors preferably happen in GRBs associated with the collapse of massive stars (Type II GRBs), and not in GRBs produced by mergers of compact stars (Type I).
3.3. The EE Tails
We recognize the weak episode following the main episode as an EE tail with the criterion that the EE tail has a count rate that is lower than 50% of the mean count rate of the main burst (except for GRB 060614, whose EE tail is even brighter). Such an EE tail was detected for 36 GRBs in our sample. We extract the spectra of the EE tails in these GRBs and fit them with a simple-power law model. Our analysis of the EE tails is reported in Table 2. Figure 6, right panel shows the comparison of the photon index of the EE component (Γe) to that of the main episode. It is found that the EE tails are softer than that of the main episode.
We show some typical light curves with an EE component in Figure 7. One of the most prominent features of these light curves is that they usually start with a bright and sharp spike. GRB 060614 is a prototype of the EE tails. Some GRBs whose light curves are similar to that of GRB 060614 are shown in the first three rows of Figure 7. The EE tails are usually highly variable and their brightness gradually decreases. The bright EE tails detected in some GRBs may extend up to ∼100 s, or even hundreds of seconds, after the BAT trigger. Besides the GRB 060614-like events, the EE tails in some GRBs appear as continuous fluctuations with amplitudes much smaller than the initial spikes, such as those as observed in GRB 061006 and 111121A. According to our analysis, EE tails are usually detected in some "short" GRBs. These GRBs are usually classified as short since their EE tails are ignored in T90 calculations.5 The light curves of typical long GRBs are composed of several separated pulses. In the case that the amplitude of these pulses decreases with time, the later pulses may be identified as EE tails. Excluding this kind of GRB, we find a prominent EE tail only in GRB 070420. Therefore, if both GRB 060614-liked GRBs and GRB 061006-liked GRBs have the same origin (e.g., Zhang et al. 2007), the EE tails may preferably happen in GRBs from compact star mergers (Type I).
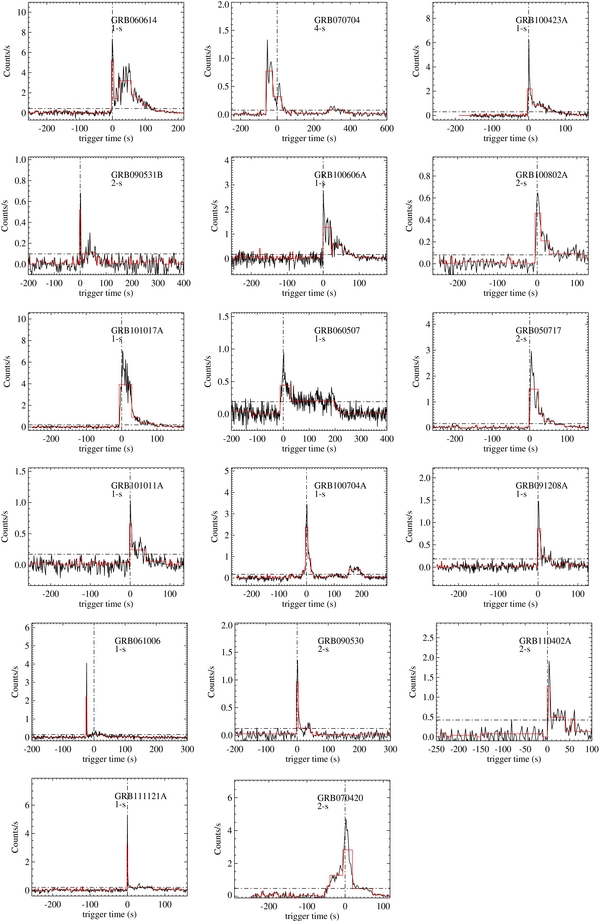
Figure 7. Same as Figure 3, but for the extended tails.
Download figure:
Standard image High-resolution image3.4. X-Ray Emission from Internal Energy Dissipation
X-ray flares observed with XRT show that the GRB phenomenon is also bright in the X-ray band. We derive the X-ray flux in the XRT band by extrapolating the BAT data to the XRT band and make a joint X-ray light curve from the BAT trigger to the late epochs as observed with XRT. We take the peak time (Tf) of the last X-ray flare as an indicator of the end of the internal energy dissipation processes. In order to give a robust estimate of Tf, we search for subsamples of GRBs whose BAT and XRT data are well connected without a gap, or whose significant flares are observed after a gap, indicating that the internal energy dissipation process is still alive at late times. We have such a subsample of 159 GRBs. We find that the T90 values of 30% of GRBs are comparable to Tf, indicating that T90 would be a good measure of the duration of the internal energy dissipation processes in these GRBs. However, the Tf values of 70% of GRBs are much larger than T90, suggesting that the internal energy dissipation processes extend to much longer than T90. This is in general agreement with Zhang et al. (2014), who defined the duration of a burst based on X-ray data. We show some typical X-ray light curves of the two type of GRBs in Figures 8 and 9, respectively.
A long quiescent phase in the BAT band is observed in some GRBs. The XRT observations during the BAT quiescent phase can reveal the feature of the internal energy dissipation processes in this phase. We show the joint BAT and XRT light curves of eight GRBs that have a long BAT quiescent phase in Figure 10. The double-triggered GRB 110709B (Zhang et al. 2012) and GRB 121217A are the most prominent cases. BAT was triggered again by GRB 110709B by the second bright episode after a quiescent phase of 11 minutes. XRT promptly slewed to catch the X-ray emission after the first trigger. One can find that the bright X-ray emission was detected during the quiescent phase, indicating that the burst events are not indeed quiescent. For GRB 121217A, a rapid decay segment of the XRT light curve before T0 + 100 s should be the tail emission of the first gamma-ray peak caused by the curvature effect (e.g., Zhang et al. 2007). The X-rays since T0 + 200 s increase with significant flares and peak at T0 + 750 s. The second bright, short gamma-ray peak is just at the peak of the X-ray emission. The duration of the second peak of the gamma-ray emission is only a very short slice of the burst event in the time interval from T0 − 200 s to T0 + 1300 s.

Figure 8. Examples of X-ray light curves from the BAT trigger to the late XRT observational epochs for the GRBs that have no significant flares after T90, where the prompt X-rays (the connected dots) are derived by extrapolating the BAT data to the XRT band. The vertical lines mark the end time of T90.
Download figure:
Standard image High-resolution image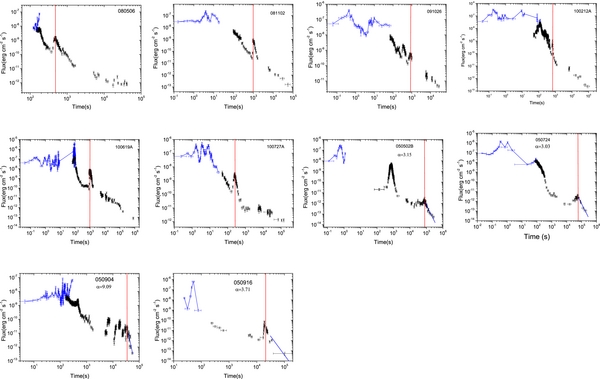
Figure 9. Same as Figure 8, but for those GRBs whose significant flares are observed after T90. The lifetime of the internal energy dissipation process of these GRBs is much longer T90.
Download figure:
Standard image High-resolution image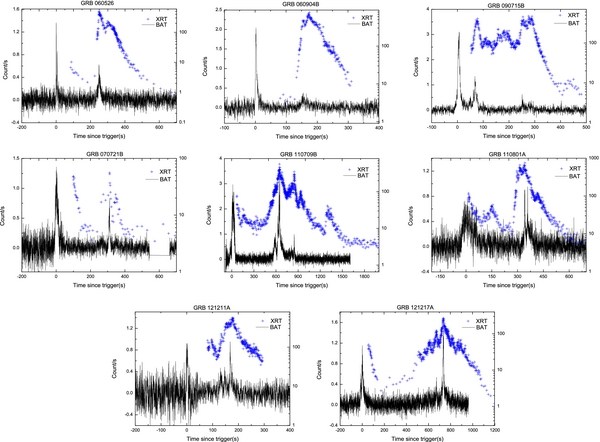
Figure 10. Examples of joint BAT (connected lines) and XRT (crosses) light curves for GRBs with a long quiescence phase in the BAT band. The left and right vertical axes of each panel are for the count rate for the BAT data and XRT data, respectively.
Download figure:
Standard image High-resolution image
4. CONCLUSIONS AND DISCUSSION
We have presented a joint analysis of data of 613 GRB observed with the Swift mission to investigate the internal energy dissipation processes as observed in the BAT and XRT bands, including precursors, prompt gamma-ray emission, extended soft gamma-ray emission, and late X-ray flares. Based on our analysis with the BB method, we show that the BAT light curves of 73% of GRBs in our sample are composed of only one single emission episode. A precursor is observed in about 10% of the BAT GRBs, most of which are of long-duration GRBs. About half of the precursors triggered BAT about the GRB, but we do not find any statistical differences in the photon indices between the triggered and non-triggered precursors, and their photon indices are also roughly consistent with those of the main burst. The EE tails in the BAT band are usually observed in short-duration GRBs. They are statistically softer than the emission in the main burst. We derive the X-ray flux in the XRT band by extrapolating the BAT data to the XRT band and make joint X-ray light curves from the BAT trigger to the late observational epochs by the XRT. Taking the peak time of the last X-ray flare as an indicator of the end of the internal energy dissipation processes, we show that the duration of the internal energy dissipation process of about two thirds of GRBs is much longer than T90 measured in the BAT band. Time intervals between bright episodes in the band range from tens of seconds to hundreds of seconds, and a long quiescent phase is shown for some GRBs. However, bright X-ray emission is detected during the BAT quiescent phase. These results suggest that what we have seen in the gamma-ray band may be only a small part of more extended underlying activities. The duration of the gamma-ray emission may be only a short period in the life time of the entire internal energy dissipation process.
The physical origin of the precursor is of great interest. Previously, some authors suggested an early photosphere emission origin or a shock breakout origin (Lyutikov & Usov 2000; Ramirez-Ruiz et al. 2002). Our analysis shows no significant difference between the precursor emission and the main emission episode, suggesting that it is very likely that precursors share the same physical origin as the prompt episode, which is directly related to the central engine activities.
One interesting question in GRB studies is whether there is emission prior to the GRB trigger time. The detection of precursors prior to the main burst indicates that the burst activities can in principle start prior to the main explosion. A GRB trigger is instrumentally dependent. The trigger probability of low S/N signals drops rapidly (e.g., Qin et al. 2013). An offline analysis of CGRO/BATSE data showed that about 1838 out of 3906 GRBs were detected but did not trigger BATSE (Stern et al. 2001). As shown in our analysis, only about 44% of precursors triggered BAT. In addition, our joint BAT and XRT light curves shown in Figure 10 indicate that bright X-ray emission may be detectable during the BAT quiescent phase. Currently, the XRT observations usually start at least tens of seconds after the GRB trigger. We do not have X-ray observations prior to the BAT triggers. On the other hand, based on XRT observations to the second peaks of GRBs 110709B and 121217A, one may suspect that bright X-ray emission may come prior to even the first episode that triggers BAT. The time interval of T90 would be only a short, violent episode of the bursts. Therefore, the exact starting time of a burst event could be (much) prior to the BAT trigger. This effect may also significantly affect our understanding of the temporal behaviors of the early shallow-decay X-ray emission (e.g., Yamazaki 2009; Liang et al. 2009; but see Birnbaum et al. 2012).
It is interesting that precursors preferably happen in Type II GRBs, which are produced by the collapse of massive stars. As discussed above, the precursors, main burst, and late flares would all come from the internal energy dissipation of a relativistic outflow powered by the GRB central engine. Popular GRB central engine models are related to a hyper-accreting black hole (e.g., Popham et al. 1999; Narayan et al. 2001; Di Matteo et al. 2002; Kohri & Mineshige 2002; Gu et al. 2006; Chen & Beloborodov 2007; Liu et al. 2007; Lei et al. 2009, Lei et al. 2013). The detection of precursors in Type II GRBs likely implies that the GRB central engine may have some weak activities prior to the main explosion during the collapse of a massive star. The lack of detection of a precursor in Type I GRBs, together with the fact that the light curves of Type I GRBs usually starts with extremely sharp and bright spikes, seem to suggest that compact star mergers may start with the most violent activities of the central engine.
The EE tails of about one third of GRBs in Table 2 are composed of some well-separated pulses, such as GRBs 100906A, 060814, 100814, 111008A, 060306, 100522, 100704A, 080509B, and 120514A. They seem to be part of the main bursts. However, the EE tails of about two thirds of GRBs are not clearly separated from the main bursts in their light curves. These GRBs are GRB 060614-like or GRB 061006-like. They may be produced by mergers of compact stars (e.g., Zhang et al. 2007). The detections of the EE tails and late X-ray flares indicate that the GRB central engine of Type I GRBs does not die rapidly. Different from the precursor emission, the EE tails are statistically softer than the main burst. Metzger et al. (2008) presented time-dependent models of the remnant accretion disks created during compact object mergers and showed that the late-time accretion can in principle provide sufficient energy to power the late time activities observed by Swift/BAT from some Type I GRBs. Liu et al. (2012) showed that the radial angular momentum transfer may significantly prolong the lifetime of the accretion process and multiple episodes may be switched by the magnetic barrier. Their numerical calculations based on the model of the neutrino-dominated accretion flows suggest that the disk mass is critical for producing the observed EE tails.
We appreciate helpful comments from the referee. This work made use of data supplied by the UK Swift Science Data Centre at the University of Leicester. It is supported by the National Basic Research Program (973 Program) of China (grant 2014CB845800), the National Natural Science Foundation of China (grants 11025313, 11163001, 11363002), Guangxi Science Foundation (2013GXNSFFA019001), Key Laboratory for the Structure and Evolution of Celestial Objects of Chinese Academy of Sciences, and the Strategic Priority Research Program "The Emergence of Cosmological Structures" of the Chinese Academy of Sciences, grant No. XDB09000000.
Footnotes
- 4
The short GRB 090510 detected by Fermi/Gamma-ray Burst Monitor shows evidence of a precursor (Troja et al 2010). The S/N of the precursor is only ∼3. Since it is a high-luminosity short GRB, the possibility that it is a Type II GRB is not ruled out (Zhang et al. 2009; Panaitescu 2011; Bromberg et al. 2013).
- 5
It was suggested that an EE tail presents in some short GRBs, such as 050724, 070223, 0507242, 050911, 051227, 061210, 070714B, 071227, 090715A, and 090916 (e.g., Barthelmy 2007; Zhang et al. 2007, 2009). Our analysis shows a low-S/N block after the main burst in the light curves of these GRBs, but the S/N is lower than 3σ. We therefore do not include these GRBs in our analysis, in order to keep a uniform criterion for both precursors and extended emission tails.