


ABSTRACT
We find that infalling dark matter halos (i.e., the progenitors of satellite halos) begin losing mass well outside the virial radius of their eventual host halos. The peak mass occurs at a range of clustercentric distances, with median and 68th percentile range of  for progenitors of z = 0 satellites. The peak circular velocity for infalling halos occurs at significantly larger distances (
 at z = 0). This difference arises because different physical processes set peak circular velocity (typically, ∼1:5 and larger mergers which cause transient circular velocity spikes) and peak mass (typically, smooth accretion) for infalling halos. We find that infalling halos also stop having significant mergers well before they enter the virial radius of their eventual hosts. Mergers larger than a 1:40 ratio in halo mass end for infalling halos at similar clustercentric distances (∼1.9 Rvir, host) as the end of overall mass accretion. However, mergers larger than 1:3 typically end for infalling halos at more than four virial radial away from their eventual hosts. This limits the ability of mergers to affect quenching and morphology changes in clusters. We also note that the transient spikes which set peak circular velocity may lead to issues with abundance matching on that parameter, including unphysical galaxy stellar mass growth profiles near clusters; we propose a simple observational test to check if a better halo proxy for galaxy stellar mass exists.
Export citation and abstract BibTeX RIS
1. INTRODUCTION
In the lambda cold dark matter (ΛCDM) paradigm, galaxies form in the centers of dark matter halos, and the growth of the galaxy stellar mass and halo mass are strongly correlated (e.g., More et al. 2009; Yang et al. 2009; Leauthaud et al. 2012; Reddick et al. 2013; Tinker et al. 2013). Dark matter halos may be classified into two types depending on whether the center is contained within a larger halo (satellite halos or subhalos) or not (host halos). Similarly, galaxies may be divided into centrals and satellites, depending on whether they reside in the center of a host halo or in the center of a smaller, satellite halo.
It is well known both that satellite dark matter halos rapidly lose mass due to tidal forces (e.g., Tormen et al. 1998; Kravtsov et al. 2004; Knebe et al. 2006) and that satellite galaxies quench (i.e., stop forming stars) after accretion onto a cluster (see recently, e.g., Yang et al. 2007; Kimm et al. 2009; Prescott et al. 2011; Wetzel et al. 2012; Woo et al. 2013 and references therein). Because halo mass accretion is strongly connected to gas accretion (van de Voort et al. 2011), it is not surprising that a diminishing fuel supply correlates with the end of star formation. However, it has been known for over a decade that enhanced galaxy quenching exists well past the virial radius of clusters (Balogh et al. 2000; Verdugo et al. 2008; Braglia et al. 2009; Wetzel et al. 2013). It is also not clear to what extent quenching is triggered by a single external event (such as a merger), or whether it happens due to more gradual harassment (Croton et al. 2006; Somerville et al. 2008; Tecce et al. 2010; Book & Benson 2010; Lu et al. 2011; Kimm et al. 2011; Wetzel et al. 2012). Recently, Hahn et al. (2009), Reddick et al. (2013), and Bahé et al. (2013) noted that halos can also lose mass beyond the virial radii of clusters. Less attention has been given to the distances where infalling halos experience their last mergers. In this paper, we investigate the range of clustercentric distances at which subhalos start to be dynamically influenced by their hosts, evaluating the radii characterizing the beginning of mass loss and the last merger for a range of mass ratios. We discuss the implications of these results for satellite quenching and abundance matching models.
It is often assumed that maximum circular velocity ( ), in addition to halo mass, is highly correlated with galaxy stellar mass (Colín et al. 1999; Conroy et al. 2006; Wetzel & White 2010; Trujillo-Gomez et al. 2011; Klypin et al. 2011; Reddick et al. 2013). vmax may in fact be a better halo proxy for stellar mass than is halo mass for host halos, because vmax directly measures the gravitational potential close to the galaxy center (Colín et al. 1999; Conroy et al. 2006; Klypin et al. 2011; Trujillo-Gomez et al. 2011). Conroy et al. (2006) suggested using vmax measured at the epoch of accretion for satellite halos, because vmax also decreases after infalling halos become satellites, although it does so significantly less than halo mass. By abundance matching galaxies rank-ordered by luminosity to halos rank-ordered by vmax (measured at accretion for satellites) in equal volumes, Conroy et al. (2006) found that the halos matched the galaxy clustering statistics at a range of redshifts. However, Reddick et al. (2013) found that abundance matching galaxies to halos by peak vmax (i.e., the highest vmax ever reached in a halo's accretion history) may give a better match to more recent clustering constraints. In this paper, we calculate clustercentric distances at which halos reach peak vmax to determine if there is a physical reason for peak vmax to be a better stellar mass proxy than vmax at accretion. We note that here we use the term "clustercentric" distance to refer to the distance to the halo that a satellite will eventually fall into, regardless of the mass of the host halo.
For all results, we use dark matter-only simulations; however, we test with several different combinations of simulation codes, halo finders, and cosmological parameters. We provide details on the simulations, halo finding, and merger trees in Section 2. Quantitative results for where infalling halos reach their peak masses and circular velocities, as well as have their last mergers, are presented in Section 3. Finally, we discuss how the results impact satellite galaxy quenching, satellite morphologies, and abundance matching in Section 4, and conclude in Section 5. Our main results in this paper assume a flat, ΛCDM cosmology with parameters ΩM = 0.27, h = 0.7, ns = 0.95, and σ8 = 0.82. Halo masses are defined using the virial spherical overdensity criterion of Bryan & Norman (1998).
2. METHODS
We here briefly overview the simulations (Section 2.1), halo finders (Section 2.2), and merger tree code (Section 2.3) which we have used.
2.1. Simulations
We make use of the Bolshoi simulation (Klypin et al. 2011), which follows 20483 dark matter particles in a (250 h−1 Mpc)3 volume using the art code (Kravtsov et al. 1997). Its excellent mass (1.94 × 10⁸ M☉ per particle) and force resolution (1 h−1 kpc) make it ideal for studying halos from 1010 M☉ to 1015 M☉. The assumed ΛCDM cosmology is close to the WMAP9 best-fit cosmology (Hinshaw et al. 2012), with parameters ΩM = 0.27,  , h = 0.7, ns = 0.95, and σ8 = 0.82. Snapshots were saved at 180 timesteps between z = 14 and z = 10, spaced at intervals between 40–95 Myr. As most of our analysis requires resolved merger trees (as opposed to only resolved halos), we report results only for halos with peak masses larger than 3 × 10¹⁰ M☉ (150 particles).
We also make use of the Consuelo simulation (C. M. McBride et al., in preparation; see also Behroozi et al. 2013d, 2013e; Wu & Huterer 2013) to verify that our results are not sensitive to the above choice of simulation code or cosmology. Consuelo follows 14003 dark matter particles in a larger (420 h−1 Mpc)3 volume using the gadget code (Springel 2005). Its force and mass resolution are 8 h−1 kpc and 2.7 × 10⁹ M☉, respectively, which allow resolving halos from 1011 M☉ to 1015 M☉. The assumed flat ΛCDM cosmology has parameters ΩM = 0.25,  , h = 0.7, ns = 1.0, and σ8 = 0.8. Snapshots were saved at 100 timesteps between z = 12.3 and z = 0, spaced equally in log (a). For the Consuelo simulation, we report results only for halos with peak masses larger than 3 × 10¹¹ M☉ (111 particles).
2.2. Halo Finders
Both simulations were analyzed using the Rockstar halo finder (Behroozi et al. 2013d). This halo finder is a fully phase-space temporal (seven-dimensional) algorithm featuring excellent recovery of major merger and satellite halo properties (Knebe et al. 2011; Onions et al. 2012, 2013; Behroozi et al. 2013e). The method uses adaptively shrinking phase-space linking lengths to find density peaks in phase space. Particles that share a common closest density peak in phase space are grouped into a single halo or satellite halo, whose position is the location of the density peak. Then, particles with positive total energy are removed using a tree-code calculation and full-halo properties (including velocities, virial masses, and maximum circular velocities) are calculated. When determining host halo/satellite halo relationships in ambiguous cases (such as major mergers), the hierarchy from the previous timestep (if available) is preserved.
To verify that our results are not sensitive to the halo finder used, we also have run the bound density maxima (BDM) halo finder (Klypin et al. 1999; Riebe et al. 2013) on the Bolshoi simulation. This halo finder is a position-space (three-dimensional) algorithm which calculates densities for each particle via a top-hat filter over the nearest 20 particles. Around each density maxima, BDM grows spherical shells until the enclosed mass corresponds to a specified density threshold Δ (in this case, Δvir; Bryan & Norman 1998). By definition, this means that all halo centers will correspond to density maxima. These spherical regions are converted to halos in order of deepest central gravitational potential; satellite mass profiles are truncated if they exceed the distance to the nearest larger halo center by a tunable overshoot factor (1.1–1.5). For satellite halos only, iterative unbinding using spherically averaged potentials is performed before determining halo properties.7
2.3. Merger Trees
Merger trees for all simulations were generated using the Consistent Trees algorithm of Behroozi et al. (2013e). This approach simulates the gravitational motion of halos given their positions, velocities, and mass profiles as returned by the halo finder. From information in a halo catalog at a given simulation snapshot, the expected positions and velocities of halos at an earlier snapshot may be calculated. In cases where there is an obvious inconsistency between the expected halo positions and the actual ones as returned by the halo finder, the halo catalog can be repaired by substituting the expected halo properties. This process repairs defects such as missed satellite halos (e.g., satellite halos which pass too close to the center of a larger halo to be detected) and spurious mass changes (e.g., satellite halos which suddenly increase in mass due to temporary misassignment of particles from the host halo). This process is very important to ensure accurate mass accretion histories for satellite and host halos; full details of the algorithm as well as tests of the approach applied to both Bolshoi and Consuelo simulations may be found in Behroozi et al. (2013e).
3. RESULTS
In this section, we trace merger histories of satellite dark matter halos to determine the clustercentric distances where they reach peak vmax and mass, as well as where they had their last mergers. For infalling halos, their peak mass is expected to occur around  times the radius of their eventual host (Rvir, host; Hahn et al. 2009). This is the distance at which stable orbits at the radius of the infalling halo no longer exist; i.e., it is where the Hill (also known as "Roche" or "tidal") radius coincides with the virial radius of the infalling halo.8 To better compare clustercentric distances across different host masses, we normalize all distances by the host halo's virial radius, measured at the time the satellite last entered the host; i.e., letting tacc be the most recent time that the satellite became accreted, we normalize by Racc, host = Rvir, host(tacc). We have checked that our results do not change appreciably if we normalize by the host's virial radius at a different time (e.g., at the time the infalling halo reached peak mass or vmax).
We first present mass, vmax, and concentration histories for a typical infalling halo in Section 3.1 in order to motivate the analysis that follows. We discuss results for the radius at which satellite halos reach peak vmax (Rpeak, vmax) in Section 3.2 and identify the connection to the last >1:5 merger in Section 3.3. We then compare Rpeak, vmax to the radius of peak mass (Rpeak, mass) in Section 3.4. We examine the percentage of satellites which reach peak mass and vmax after "backsplash" (i.e., after passing temporarily through the virial radius of a larger halo) in Section 3.5. Finally, we compare results across different halo finders and simulations in Section 3.6.
3.1. Example
We show the halo mass, vmax, merging, and concentration histories for a typical infalling halo in Figure 1. As time proceeds, the halo has monotonic growth in mass, but its vmax growth is marked by temporary spikes. These spikes in vmax often correspond to mergers (gray triangles in Figure 1) as well as to spikes in concentration, suggesting that a merging satellite passing by the halo's center is causing a temporary boost in central density. The vmax peaks are generally larger for larger merger ratios, such as the major 1:3 merger at z = 1.78, as compared to the mostly ∼1:10 events at higher redshifts for this halo. This halo's peak vmax is set during a ∼1:5 merger at z = 1.17, which occurs at ∼3 times the virial radius of its eventual host. After this peak, vmax declines immediately by 12%. For this halo, peak vmax does not correspond to peak mass. Instead, its mass continues to grow through smooth accretion until the halo reaches ∼2 times the virial radius of its eventual host. At this radius, tidal forces from the host are strong enough to halt accretion, even though severe stripping does not occur until after the infalling halo passes through the virial radius of its host.

Figure 1. Left panels show halo mass and vmax histories for a typical infalling halo; right panels show halo mass, vmax, and concentration histories for the same halo as a function of the distance to its eventual host (R), in units of the host virial radius at accretion (Racc, host). Peak mass and peak vmax occur at different times and distances. Peak vmax occurs first, when a merging satellite halo on its first pass through the infalling halo's center creates a temporary spike in concentration as well as vmax. This event is marked by a red dashed line in all plots. Peak mass occurs second, and is due to slow, steady accretion; this is marked by the blue dot-dashed line in all plots. However, the infalling halo reaches peak mass well outside of the virial radius of its eventual host (∼2 Racc, host, in this example). Steady tidal stripping leads to a slow decline in both mass and vmax; rapid mass loss does not occur until the infalling halo is well inside its host. Other >1:10 mergers are marked by gray triangles, specifically at the time of first turnaround of the merging satellite. These mergers all result in spikes in concentration and vmax, but the effect is more pronounced for more massive mergers. All quantities are calculated using the Rockstar halo finder on the Bolshoi simulation.
Download figure:
Standard image High-resolution imageAs shown in later sections, several aspects of this example apply to the halo population as a whole. Peak vmax tends to occur well outside the virial radius of the eventual host (Section 3.2), and is very often coincident with a >1:5 merging event (Section 3.3). Peak mass is often set instead by a different process—the tidal truncation of smooth accretion—and therefore occurs much closer to the virial radius of the eventual host halo (Section 3.4). We demonstrate each of these findings on large statistical samples in the next sections.
3.2. The Radius of Peak Satellite Halo vmax
Figure 2 demonstrates that most satellites reached their peak vmax well outside the host halo in which they currently reside. The median Rpeak, vmax for z = 0 satellites is at 3.7 times Racc, host, as shown in the upper panel of Figure 2; the 68th percentile range is extremely large: 1.5–7 Racc, host. At higher redshifts, infalling halos reach peak vmax much closer to their final hosts; we defer the explanation of this to Section 3.3. The halos which reach peak vmax after becoming satellites are those which experience satellite–satellite mergers, as well as major (>1:3) mergers.
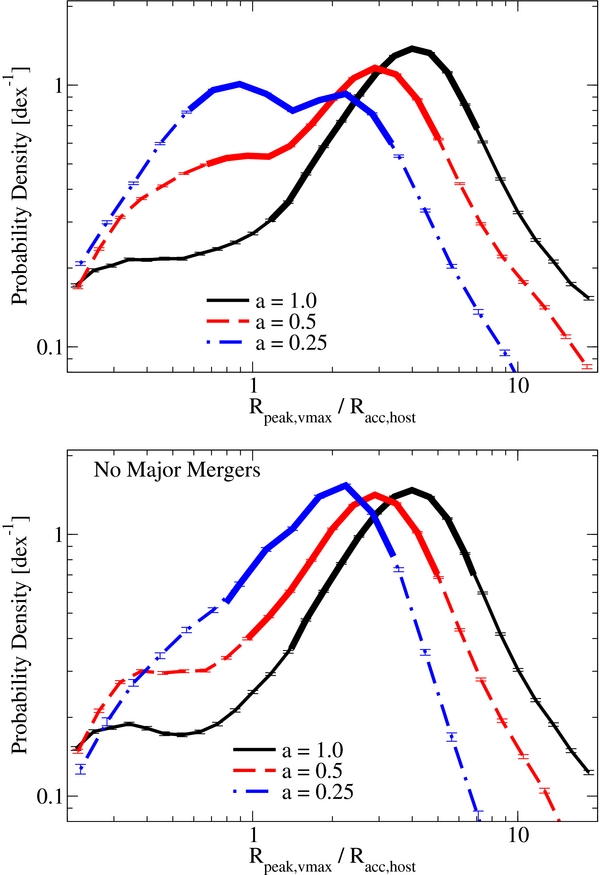
Figure 2. Top panel: the distribution of Rpeak, vmax/Racc, host for subhalos at several redshifts in the Bolshoi simulation with the Rockstar halo finder. Rpeak, vmax is the distance from the host halo at which the satellite halo progenitor had its maximum vmax; Racc, host is the virial radius of the host halo at the epoch of the satellite halo's accretion. Double-width lines correspond to the middle 68% of the probability distributions. At higher redshifts, satellites which are major mergers make up a larger percentage of the satellite population studied; major mergers tend to reach their peak vmax within the radius of their host halo. Bottom panel: same as top panel, excluding major (>1:3) mergers.
Download figure:
Standard image High-resolution imageMajor mergers are unique because the merging halos can continue to accrete weakly bound material even after they pass within the host halo's virial radius. These mergers account for a satellite mass dependence in Rpeak, vmax (Figure 3, top panel). Major mergers are more common for satellite halo masses above 1013 M☉; this is because of the exponential decline in the host halo mass function toward higher masses—i.e., the rarity of host halos for which a >1013 M☉ satellite would not be considered a major merger. If the distribution of Rpeak, vmax is instead plotted as a function of host halo mass (Figure 3, lower panel), the small percentage of major mergers in the overall merger ratio spectrum means that no strong mass trends are apparent.
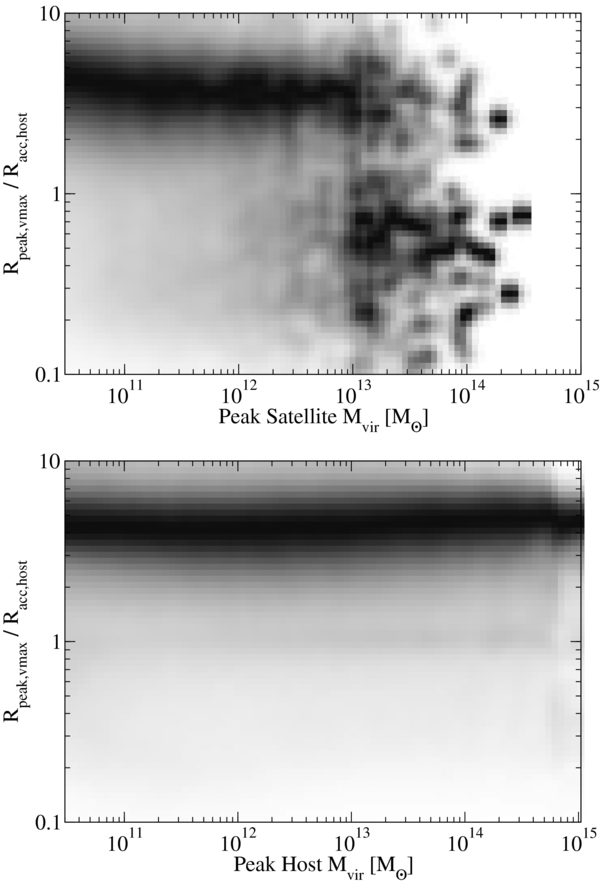
Figure 3. Conditional density plot of Rpeak, vmax/Racc, host as a function of satellite halo mass (top panel) and host mass (bottom panel) at z = 0 in Bolshoi with the Rockstar halo finder. As in Figure 2, Rpeak, vmax is the distance from the final host at which the satellite halo progenitor had its maximum vmax; Racc, host is the radius of the host halo at the epoch of the satellite halo's accretion. The region below a ratio of unity is largely populated by major (>1:3) mergers and halos which undergo satellite–satellite mergers (see Section 3.2). Otherwise, no strong mass trends are evident. A smoothing kernel with a FWHM of 0.12 dex has been applied to both plots; individual high-mass satellite halos therefore appear as round blobs.
Download figure:
Standard image High-resolution imageWe find that at higher redshifts, more surviving satellites are major mergers, meaning that a larger proportion of halos reach peak vmax within the virial radius of their host halos. Excluding major mergers, the probability distributions for peak vmax are more similar in shape (Figure 2, bottom panel).
3.3. The Relationship Between Peak vmax and the Last Minor Merger
The fact that peak vmax for satellite progenitors occurs at such a large distance from their hosts cannot be explained by tidal stripping. Indeed, as shown in Sections 3.1 and 3.4, infalling halos can continue accreting mass well after peak vmax is reached. Instead, we find that peak vmax is highly correlated with the last >1:5 merger, as shown in Figures 4 and 5. This is because vmax is generally set by the average density near the halo center. If a halo experiences a merger, the merger will temporarily boost the central density of the halo as it makes its first pass near the halo's center. This will in turn temporarily boost both vmax and the concentration of the halo, as seen in Figure 1 (see also Ludlow et al. 2012). Once the merging halo orbits and tidally dissipates, it raises the velocity dispersion of its host, which lowers both vmax and concentration again. For this reason, minor and larger mergers introduce a temporary spike in vmax for the infalling halo, typically about 14% (Appendix). Because vmax is roughly proportional to the cube root of halo mass, the mass of the halo would have to grow by 42% before the halo would again reach the peak vmax set by the merging event. The fact that mergers can easily set peak vmax applies equally well for host halos, as shown in Appendix.
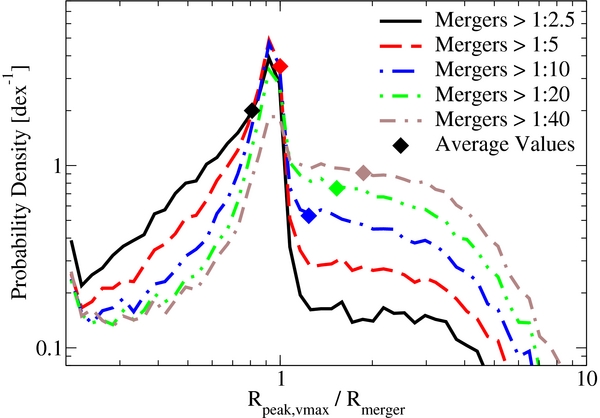
Figure 4. Histograms of Rpeak, vmax/Rmerger for satellites at z = 0; several different merger mass ratio thresholds are shown. Rpeak, vmax greater than Rmerger almost always implies that the merger occurred after peak vmax was reached; Rpeak, vmax less than Rmerger implies the opposite. While major mergers almost always lead to a new peak in vmax (see, e.g., the line corresponding to >1:2.5 mergers), smaller mergers can sometimes cause vmax to peak as well. The average of Rpeak, vmax/Rmerger (marked by diamonds for each merger threshold) is closest to 1 when Rmerger refers to the last >1:5 merger (see also Section 3.3). Less massive mergers are much less likely to set peak vmax, and so continue to occur after peak vmax is set (i.e., Rpeak, vmax > Rmerger). More massive mergers almost always set peak vmax, but later 1:5 mergers have some chance of setting peak vmax, resulting in Rpeak, vmax < Rmerger. This suggests that a >1:5 merger event is the best proxy for peak vmax among the options considered here. To avoid mass resolution limits, these values were calculated only for halos larger than 4 × 10¹¹ M☉ for Bolshoi with the Rockstar halo finder.
Download figure:
Standard image High-resolution image
Figure 5. Conditional density plot of Rpeak, vmax/Rmerger as a function of host mass for satellite halos at z = 0 in the Bolshoi simulation. Rmerger is the radius at which the satellite halo had its last minor (1:5) merger.
Download figure:
Standard image High-resolution imageThe probability for a merger event to set peak vmax depends strongly on the merger ratio: mergers with higher mass ratios are more likely to pass closer to the center, and will also lead to larger density increases. However, the infrequency of major mergers means that it is possible for smaller, more frequent minor mergers to set a new peak vmax after the last major merger event. We find that the radius at which the last >1:5 merger occurred is on average the same as Rpeak, vmax (Figure 4).
We can then understand why peak vmax occurs at large clustercentric distances by comparing the gravitational timescale for free-fall (i.e., the dynamical timescale) to the timescale for >1:5 mergers. As shown in Figure 6, the time between mergers is much longer than the dynamical timescale at z = 0, meaning that infalling halos will travel for significant distances (relative to the host's virial radius) between mergers. This ratio becomes less at higher redshifts, meaning that the travel distance will be shorter relative to the host's radius. While a direct quantitative comparison cannot be made—e.g., infalling halos do not start from rest at the time of their last merger, and tidal forces will reduce the merger rate close to the host halo (Binney & Tremaine 2008)—it is instructive to calculate the expected radial distances for the last >1:5 merger based on the ratio of the time between mergers to the dynamical time. For free-falling orbits, the travel distance is proportional to the travel time to the two-thirds power, so we can very roughly estimate
where Tmerger is the average time between mergers, Tdyn is the dynamical time ((Gρvir)−1/2), and ρvir is the virial overdensity. The expected distances are then 4.4, 3.4, and 2.5 Racc, host at z = 0, 1, and 3, respectively. Despite the crudeness of this calculation, these values capture the redshift scaling and normalization of the average Rpeak, vmax found in our simulations when major mergers are excluded (e.g., Figure 2, bottom panel).

Figure 6. Comparison between the dynamical time ((Gρvir)−1/2) and the average time between 1:5 or larger mergers, from Behroozi et al. (2013c). As the dynamical time is much shorter than the merger time at low redshifts, infalling halos will tend to travel longer distances between experiencing mergers; this qualitatively explains the high values of Rpeak, vmax/Racc, host seen in Figures 2 and 3.
Download figure:
Standard image High-resolution image3.4. The Radius of Peak Infall Mass
The radius of peak infall mass is simpler to interpret than the radius of peak vmax. We show the distribution and redshift evolution of Rpeak, mass in the top panel of Figure 7. At z = 0, the median Rpeak, mass is 1.8 Racc, host, with a 68th percentile range of 0.8–4.1 Racc, host. This is broadly consistent with where the infalling halo's Hill radius shrinks to its virial radius, i.e., at 31/3 ∼ 1.4 times Racc, host (see, e.g., Hahn et al. 2009). The radius of peak infall mass becomes smaller relative to Racc, host at higher redshifts partially due to the increased likelihood of surviving satellites being major mergers (Section 3.2) and partially due to the effect of cosmological expansion on the gravitational force law, which makes it more difficult for dark matter to escape from the infalling halo at higher redshifts (Behroozi et al. 2013a).
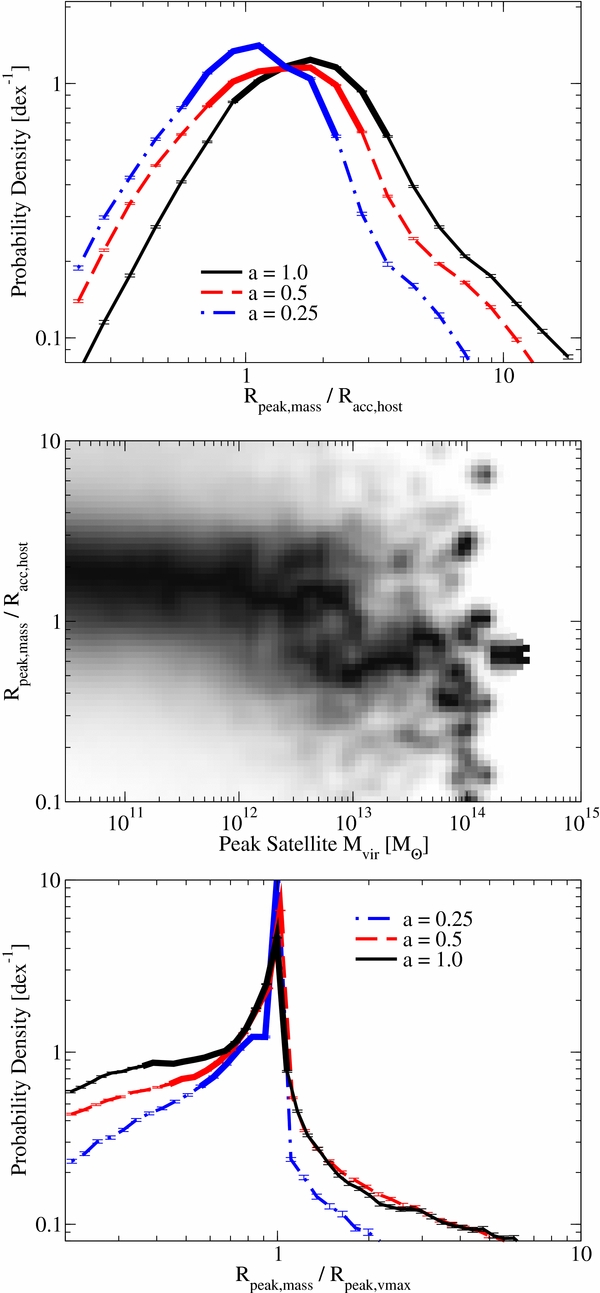
Figure 7. Top panel: the evolution of Rpeak, mass/Racc, host with redshift for the Bolshoi simulation with the Rockstar halo finder (analogous to Figure 2). Double-width lines correspond to the middle 68% of the probability distributions. Middle panel: conditional density plot of Rpeak, mass/Racc, host as a function of satellite halo peak mass. As with Figure 3, more massive satellites are more likely to be major mergers, which can keep accreting even after they are within the host's virial radius. A smoothing kernel with a FWHM of 0.12 dex has been applied; individual high-mass satellite halos therefore appear as round blobs. Bottom panel: histograms of Rpeak, mass/Rpeak, vmax from z = 0 to z = 3. Both radii are calculated as the distance to the satellite's host's most massive progenitor at the time of peak mass and vmax, respectively. The central peak (Rpeak, mass within 10% of Rpeak, vmax) corresponds to ∼20% of all halos; about 80% of halos have Rpeak, mass < Rpeak, vmax, regardless of redshift.
Download figure:
Standard image High-resolution imageWe show the conditional density plot of Rpeak, mass/Racc, host at z = 0 as well as the probability distribution of Rpeak, mass/Rpeak, vmax in the bottom panels of Figure 7. While a fraction of halos (∼20%) reach peak mass close to peak vmax, the vast majority (80%) have Rpeak, mass less than Rpeak, vmax. That said, we find that the halo mass increases by only 20% on average after the time of peak vmax (for satellites at z = 0). This provides additional evidence that significant mergers after peak vmax are uncommon; otherwise, the mass would increase by a larger amount. The peak mass is therefore most often set by smooth accretion and minor or very minor mergers (see also Figure 1).
3.5. First Approach Versus Backsplash (Flyby) Halos
The plots in the previous sections do not specify whether infalling halos reach peak vmax or mass on their first approach or whether they pass through the virial radius of their eventual host and reach peak vmax/mass afterward. These "backsplash" halos (also sometimes called "flyby" halos) would have very different mass accretion histories than halos on their first approach, which could have an important effect on their galaxy properties. The typical backsplash radius (2.5 Rvir, host at z = 0; Gill et al. 2005; Sinha & Holley-Bockelmann 2012; Oman et al. 2013; Wetzel et al. 2013) is smaller than the typical radius of peak vmax, but larger than the typical radius of peak mass. We find that the fraction of halos which reach peak vmax after backsplash is always less than 10% (regardless of satellite mass, host mass, and redshift); for peak mass, this fraction is always less than 15%. These fractions are small, presumably because mass loss within the virial radius is very severe (Tormen et al. 1998; Kravtsov et al. 2004; Knebe et al. 2006).
3.6. Different Halo Finders and Simulations
As shown in the top panel of Figure 8, there is excellent agreement between all halo finders and simulations for the probability distribution of Rpeak, vmax, except in the low-probability tails of the distribution. The largest minor difference comes between the Rockstar and BDM halo finders; because BDM turns on unbinding for satellite halos only, a disproportionate number of infalling halos peak in vmax just outside the virial radius of the larger host halo.
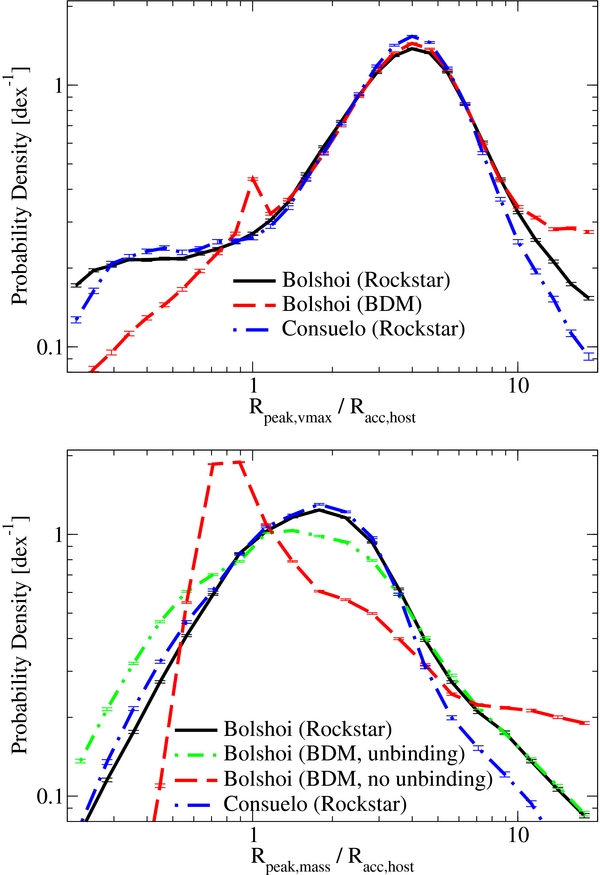
Figure 8. Top panel: comparisons of the Rpeak, vmax/Racc, host distribution for different combinations of simulations and halo finders at z = 0. There is universal agreement that the median Rpeak, vmax is near 4 Racc, host. The differences within Racc, host between BDM and Rockstar are due to the different techniques used for determining satellite particle membership; BDM applies a more conservative selection near the center of the host. Bottom panel: comparison of Rpeak, mass/Racc, host for different combinations of simulations and halo finders at z = 0. The main differences arise due to the gravitational unbinding choices for the different halo finders. The current version of BDM does not do gravitational unbinding for host halos, meaning that infalling halos continue growing up to the virial radius of their eventual host due to increased overlap with its matter distribution. On the other hand, Rockstar performs unbinding for all halos, more effectively separating the mass profile of the infalling halo from the mass profile of the host. An older version of BDM which performed unbinding for all halos gives results which are more similar to Rockstar; however, this older version occasionally misassigned host particles to satellites, resulting in excess peak masses at low radii. For this reason, we only discuss the Rockstar results for Rpeak, mass in this paper.
Download figure:
Standard image High-resolution imageHalo mass is more ambiguous to determine than circular velocity, especially for satellite halos (Knebe et al. 2011; Onions et al. 2012; Knebe et al. 2013). While the different simulations agree very well on the probability distribution for Rpeak, mass, the bottom panel of Figure 8 suggests that different halo finders can give different results. As mentioned in Section 2.2, the Rockstar halo finder performs unbinding for all halos, whereas BDM performs unbinding only for satellite halos. Because the mass distribution of the eventual host halo extends well beyond its virial radius (e.g., Busha et al. 2003), particles within the virial radius of the infalling halo can include significant contamination from the host mass distribution (Behroozi et al. 2013a). This difference means that infalling halos in BDM will "accrete" unbound matter all the way into the virial radius of the eventual host. As our primary concern in this study is the effect on galaxy formation, and because the much hotter host halo gas is unlikely to be accreted onto the galaxy in the infalling halo, we have only presented results from the Rockstar halo finder in the remainder of this section. Nonetheless, when using an older version of BDM which performs unbinding on all halos, we find results which are more similar to Rockstar for the probability distribution of Rpeak, mass (Figure 8, bottom panel).
4. DISCUSSION
In this section, we discuss how our results (Section 3; summarized in Figure 9) affect interpretations of galaxy quenched fractions in Section 4.1, galaxy morphologies in clusters in Section 4.2, and abundance matching on peak vmax in Section 4.3.
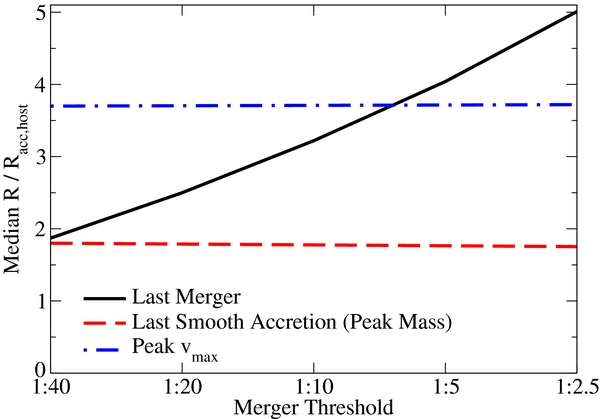
Figure 9. Median clustercentric distance (R/Racc, host) for infalling halos' last mergers as a function of the minimum merger ratio threshold, compared to median clustercentric distances for peak vmax and mass. The last merger larger than 1:40 typically happens before peak mass, i.e., the end of smooth accretion. However, peak vmax is often set by the last ∼1:5 merger, and smaller mergers continue after the infalling halo reaches peak vmax.
Download figure:
Standard image High-resolution imageIn translating the results on halos to effects on visible galaxies, some care is required. Galaxies are deeply embedded in halo potential wells, so satellite galaxies may not exhibit changes (e.g., in their color or star formation rate) until much of their surrounding dark matter halo is gone. Secondly, halo mass merger ratios are not the same as galaxy mass merger ratios. Due to the shape of the stellar mass–halo mass relation (e.g., Behroozi et al. 2013c), merger ratios are compressed for galaxies above 1010.5 M☉ in stellar mass—i.e., minor mergers in halo mass will be major mergers in galaxy mass. On the other hand, merger ratios are expanded for galaxies below 1010.5 M☉ in stellar mass, so that major mergers in halo mass become minor mergers in galaxy mass. Finally, Bahé et al. (2013) find that halos may lose gas due to ram pressure stripping before they lose dark matter from tidal stripping, although this may be sensitive to feedback mechanisms (Scannapieco et al. 2012). To be conservative, we treat the tidal stripping radius as a lower limit on the gas stripping radius in the following discussion.
4.1. Interpretation of Quenched Fraction Profiles Near Clusters
As discussed in Section 1, it is an open question whether satellite quenching is triggered by mergers or gas stripping. We find that these processes happen at different clustercentric distances (Figure 9), which means that the radial profile of galaxy quenching around clusters contains information about the satellite quenching process.
Wetzel et al. (2013) find that the observed radial galaxy quenching profile is consistent with infalling galaxies becoming quenched at the virial radius of clusters. If this quenching radius is accurate, the fact that >1:5 mergers end beyond 4 Rvir, host for most halos argues against merger-triggering satellite quenching. This is especially true for galaxies smaller than 1010.5 M☉ (stellar mass), where a 1:5 merger in halo mass would be smaller than a 1:15 merger in galaxy mass.
Of course, merger-triggered active galactic nucleus activity with a significant time delay between a galaxy merger and the onset of feedback may also be able to explain the Wetzel et al. (2013) radial quenched fractions. We consider this unlikely, however. Most satellite galaxies today had their last major merger well beyond 4 Rvir, host (Figure 9), so unless halos at that distance know in advance whether they will fall into clusters or not, merger-triggered quenching would imply that a significant quenching enhancement should appear at >4 Rvir, host regardless of the time delay.
4.2. Galaxy Morphologies in Clusters
Satellite galaxies are more likely to be ellipticals or spheroidals than are field galaxies (see, e.g., Blanton & Moustakas 2009 for a review). Numerous physical explanations have been proposed to explain this observation. These include the possibility that dry mergers within groups and clusters convert spirals into ellipticals (see extensive references in Taranu et al. 2013); that pseudobulge formation or passive fading of disk stars could convert some spirals into spheroidal/S0 galaxies (Kormendy & Kennicutt 2004; Weinmann et al. 2009; Kormendy & Bender 2012 and references therein), and the possibility that spiral disks may be heated and dispersed more easily in clusters (Kormendy & Bender 2012). It is also possible that these trends are primarily driven by correlations between formation time and environment (Wechsler et al. 2002; Watson et al. 2014).
Although there have been numerous studies on the dependence of morphology and environment, it is still somewhat unclear how these morphological trends scale in the transition region between clusters and the field, e.g., at 1–4 Rvir, as a function of galaxy luminosity. Because significant mergers in halo mass end well outside the virial radius of the cluster, we expect any merger-induced morphology changes to affect a broad region around clusters. As with quenching, this is especially true for galaxies less than 1010.5 M☉ in stellar mass; based on the stellar mass–halo mass relation in Behroozi et al. (2013c) and Figure 9, we expect 1:40 and larger mergers in galaxy mass to end at 3.2 Rvir. This is significantly before the end of mass accretion and star formation (as inferred by the quenched fraction of galaxies near clusters) for these galaxies. By contrast, passive fading (following quenching) and disk heating should only occur within or near the cluster virial radius, leading to a smaller region showing morphology changes. Further study of morphology fractions from 1–4 Rvir around clusters should help distinguish these two cases.
4.3. Implications for Abundance Matching
Recently, Reddick et al. (2013) found that vpeak is a better proxy for stellar mass than most other halo properties (including vmax at accretion, peak mass, and mass at accretion) for modeling autocorrelation and conditional luminosity functions. However, interpreting why vpeak is the best proxy of those considered is more difficult. As shown in Section 3.3 and Appendix, vpeak is often set by a merger, which results in only a transient increase in vmax. Indeed, galaxies continue to accrete gas (Section 3.4) and form stars well within the distance where vpeak is set (Wetzel et al. 2013).
The main effect of changing the halo proxy is a change in the satellite fraction at fixed stellar mass; this in turn affects the correlation function and the conditional luminosity function (Reddick et al. 2013). However, the satellite fraction also depends on the simulation resolution and the halo finder (Onions et al. 2012; Behroozi et al. 2013d); the premature loss of satellite halos and the effects on clustering are well documented (Klypin et al. 1999; Kitzbichler & White 2008). Thus, while the use of vpeak gives a reasonable satellite fraction (Reddick et al. 2013), it is unclear whether this is association is physical, or whether vpeak simply compensates better for missing satellites than other halo proxies.
This degeneracy may be broken by noting that abundance matching on vpeak gives different implications for mean galaxy growth near clusters as compared to, e.g., abundance matching on peak mass (see also Appendix). Thus, testing abundance matching models against galaxy number counts in annuli around clusters (e.g., Rvir, host < R < 2Rvir, host) where premature satellite halo loss in simulations is less significant may better constrain which halo properties best correspond to galaxy properties.
We note, however, that no proxy for stellar mass which is fixed at a single epoch (e.g., peak mass or vpeak) will capture the orbit-dependent effects of mass stripping (both gas and dark matter) from satellite galaxies. These effects will strongly influence the star formation rates of individual satellite galaxies. Instead, it may be worthwhile for future abundance matching studies to model satellites' stellar mass growth according to their unique mass accretion/stripping histories (Behroozi et al. 2013b).
5. CONCLUSIONS
We have investigated the radii at which host halos begin to influence their nearby environment, quantifying the range of distances from the host center that infalling halos experience their last mergers, peak mass, and peak circular velocity. The main results may be summarized as follows.
- 1.
- 2.Peak vmax for infalling halos occurs at a median distance of 3.7 times the virial radius (Rvir) of the eventual host halo at z = 0 (Section 3.2); at higher redshifts, it occurs closer relative to the host radius (∼3 Rvir at z = 1 and ∼2 Rvir at z = 3).
- 3.Peak mass for infalling halos occurs at ∼1.8 Rvir of the final host halo at z = 0, which is near the radius at which tidal forces from the host make orbits at the virial radius of the infalling halo unstable (∼1.4 Rvir; Section 3.4). Peak mass corresponds to the end of smooth accretion and very minor mergers (Section 3.4).
- 4.Halo finders which do not perform gravitational unbinding on all halos will find that infalling halos "grow" until they become satellites (Section 3.4). This is due to increasing contamination from particles associated with the eventual host halo; the associated gas would likely be too hot to condense onto the infalling halo's central galaxy.
- 5.It is very unlikely for halos to reach peak mass or vmax after passing within the virial radius of a larger halo (Section 3.5).
- 6.Based on the radial profile of quenched fractions near clusters in Wetzel et al. (2013), it is plausible that galaxy quenching near clusters is correlated with mass stripping. Merger-induced quenching would likely result in more extended quenching profiles than seen in (Wetzel et al. 2013; Section 4.1).
- 7.For low stellar mass (<1010.5 M☉) satellite galaxies in clusters, it is likely that morphological transitions from spiral to spheroidal or elliptical shapes are not due to dry mergers (Section 4.2).
- 8.
P.B. and R.H.W. received support from the Hubble Space Telescope (HST) Theory program; support for program numbers HST-AR-12159.01-A and HST-AR-12838.01-A was provided by NASA through a grant from the Space Telescope Science Institute, which is operated by the Association of Universities for Research in Astronomy, Incorporated, under NASA contract NAS5-26555. P.B. was also partially supported by a Giacconi Fellowship through the Space Telescope Science Institute. O.H. acknowledges support from the Swiss National Science Foundation (SNF) through the Ambizione fellowship. We also appreciate many helpful discussions and comments from Charlie Conroy, Andrew Hearin, Avi Loeb, Andrey Kravtsov, Houjun Mo, and Ramin Skibba. Finally, we thank the anonymous referee for constructive suggestions.
APPENDIX: TIMING OF MERGERS, PEAK MASS, AND PEAK vmax
As noted in Section 3.3, the radius of the last >1:5 merger is highly correlated with the radius of peak vmax. It is interesting to test whether host halos also experience a similar effect. Because the clustercentric distance is less meaningful for host halos, we compare the redshift of the last merger to the redshift of peak vmax for host and satellite halos at z = 0 in the top-left panel of Figure 10. Compared to the probability distribution for satellites only (Figure 10, top-right panel), the correlation between mergers and peak vmax seems slightly stronger for all halos than it does for satellite halos alone.
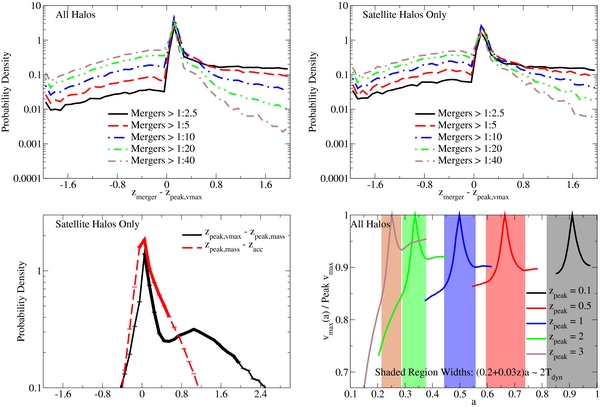
Figure 10. Top-left panel: redshift of last merger compared to redshift of peak vmax for all halos, as a function of merger threshold, for all halos. A very similar effect is seen in Figure 4, where mergers are highly correlated with peak vmax. Top-right panel: same, but counting satellite halos only. If anything, satellite halos show a slightly weaker correlation than all halos taken together. Bottom-left panel: comparisons between redshifts of peak vmax (zpeak, vmax), peak mass (zpeak, mass), and first accretion (zacc) for satellite halos. Accretion follows soon after peak mass; however, a significant fraction of infalling halos have large delays between peak vmax and peak mass. Double-width lines show the middle 68% of the probability distributions. Bottom-right panel: median ratios of vmax to peak vmax for all halos which have a peak in vmax occurring at z = 0.1, 0.5, 1, 2, or 3 (see text). These peaks in halo vmax histories last for roughly two dynamical times. All panels show results from the Bolshoi simulation with the Rockstar halo finder.
Download figure:
Standard image High-resolution imageIt is also interesting to consider the timing for when infalling halos reach peak vmax, peak mass, and the virial radius of their eventual host halos, as shown in the bottom-left panel of Figure 10 for satellite halos at z = 0. Infalling halos generally become accreted shortly after reaching peak mass (Δz < 0.5), but it takes them much longer after peak vmax to reach peak mass (68th percentile range: 0 < Δz < 2). As noted in Figure 9, infalling halos reach peak vmax at much larger clustercentric distances than they reach peak mass. Because infalling halos accelerate as they approach their eventual host halos, infalling halos will spend much more time at large radii than they will at smaller ones. This implies that halo peak vmax will remain fixed for much longer than peak mass, which will result in different stellar populations for galaxies near clusters as inferred from abundance matching on peak vmax compared to abundance matching on peak mass (Section 4.3).
We also consider how long transient peaks in vmax last. We first select all halos from the Bolshoi simulation which have a transient peak in their vmax history, defined as reaching a vmax which is not exceeded for the next five timesteps. Then, for these halos, we record the ratio of vmax to the transient peak vmax for 20 timesteps before and after the peak. To ensure that the vmax history is well resolved even at high redshifts, we exclude halos with masses below 5 × 10¹⁰ M☉. The bottom-right panel of Figure 10 shows the median ratio of vmax to the transient peak vmax for halos as a function of the transient peak redshift.
From these ratios, we find that the peak halo vmax during a transient is typically 14% higher than the average of the halo's vmax before and after the transient, regardless of redshift. In addition, we find that the following fitting formula matches the typical width of transient peaks in halo vmax histories:

where Δa is the difference in scale factor between the beginning and end of the transient, zpeak is the redshift of the transient peak, and apeak is (1 + zpeak)−1. For z ∼ 0.5 to z ∼ 3, Δa is approximately two dynamical times; however, higher-redshift transients typically last for slightly more dynamical times than lower-redshift ones. Smoothing vmax histories over several dynamical times will reduce the significance of these peaks; future work will test if these smoothed histories yield more physically realistic results for, e.g., abundance matching techniques.
Footnotes
- 7
Earlier versions of BDM performed iterative unbinding on all halos, not just satellites.
- 8
More generally, this ratio applies for any two spheres with the same average density. This means that for any given spherical overdensity Δ, the peak mass
 for an infalling halo will happen near times the eventual host halo's radius measured at the same overdensity (i.e., RΔ, host).

