


ABSTRACT
Terahertz absorption spectroscopy was employed to detect the ground-state inversion transitions of the hydronium ion (H3O+). The highly excited ions were created with an extended negative glow discharge through a gas mixture of 1 mtorr of H2O, 2 mtorr of H2, and 12 mtorr of Ar, which allowed observation of transitions with J and K up to 12. In total, 47 transitions were measured in the 0.9–2.0 THz region and 22 of these were observed for the first time. The experimental uncertainties range from 100 to 300 kHz, which are much better than the range 0.3–1.2 MHz reported in previous work. Differences of up to 25.6 MHz were found between the observed positions and the catalog values that have been used for Herschel data analysis of observations of Sagittarius B2(N), NGC 4418, and Arp 220. The new and improved measurements were fit to experimental accuracies with an updated Hamiltonian, and better H3O+ predictions are reported to support the proper analysis of astronomical observations by high-resolution spectroscopy telescopes, such as Herschel, SOFIA, and ALMA.
Export citation and abstract BibTeX RIS
1. INTRODUCTION
Herschel (Pilbratt 2010), SOFIA (Young et al. 2012; Heyminck et al. 2012), ALMA (Wootten 2008), and JWST (Gardner et al. 2006) have been or will be investigating the terahertz and far-infrared spectral region with unprecedented sensitivity, frequency coverage, and spectral resolution. These advanced capabilities necessitate new or better laboratory line parameters that are used as fixed input in modeling and interpreting astrophysical observations. In this region, laboratory rest frequencies with uncertainties of 1 MHz or less are required for proper analysis of velocity-resolved astrophysical observations, i.e., distinguishing between the components along the line of sight. Uncertainties of the interpolated line positions from analysis of laboratory infrared and visible spectra typically are on the order of 100 MHz, which are marginally adequate for identifications of the carriers.
One of Herschel's many surprising observations was the detection of highly excited metastable hydronium ions (H3O+). Lis et al. (2012) reported the discovery of its rotational transitions with J = K up to 11 toward Sagittarius B2(N) by Herschel/HIFI. González-Alfonso et al. (2013) presented observations of J = K up to 12 toward NGC 4418 and Arp 220 by Herschel/PACS. Our previous laboratory work (Yu et al. 2009) enabled the identifications of Herschel's observation of highly excited H3O+ metastable transitions, which revealed (M. Gerin & E. A. Bergin 2013, private communication) that (1) these transitions were already observed by ESO's Atacama Pathfinder Experiment telescope (APEX) a few years ago but were classified as unidentified lines and (2) H3O+ column densities were previously underestimated by a factor up to 10 because the population in the metastable states was ignored. In Yu et al. (2009), eight H3O+ rotation transitions were measured in 0.9–1.6 THz with an uncertainty of 300 kHz and a multistate analysis was carried out for H3O+, which included all available submillimeter transitions and infrared data on all four vibrational fundamental bands. Accurate molecular parameters were obtained by taking into account the strong Coriolis interaction between ν1 and ν3. Frequency predictions, particularly for high-J transitions in the ground state and in the ν1 and ν3 fundamental bands, have been greatly improved by including in our analysis about 200 more high-J transitions, which were excluded in previous literature analyses. The results were incorporated into the JPL Spectral Line catalog and have been used for Herschel data analysis in Gerin et al. (2010), Gupta et al. (2010), Lis et al. (2012), and González-Alfonso et al. (2013).
The results from our previous laboratory work (Yu et al. 2009), although it has significant improvements, were not ideal for analyzing velocity-resolved astrophysical H3O+ observations by Herschel. The accuracy of the high-J frequencies was mainly determined by the only available infrared measurements and is on the order of 100 MHz. Measurements with experimental accuracy better than 1 MHz are required for transitions involving highly excited metastable levels. In the current work, we employed an extended negative glow discharge to generate a high concentration of H3O+ which enabled the observation of high-J transitions with experimental accuracy ranging from 100 to 300 kHz.
2. EXPERIMENTAL DETAILS
The frequency multiplier submillimeter spectrometer used in our previous study of H3O+ (Yu et al. 2009) was employed for the current experiment, with four additional new multiplier chains covering the 1300–2000 GHz region. The new 1305–1480 GHz multiplier chain was home-built at the Jet Propulsion Laboratory (JPL) with a peak power of 50 μW and was described in Drouin et al. (2013). A nonupler (×9) and three separate doublers purchased from Virginia Diode, Inc., were used in combination with JPL-built power amplifiers to produce three multiplier chains with broad coverage from 1395 to 1590, 1616 to 1850, and 1750 to 2010 GHz. The peak power of these three sources is about 10 μW.
The highly excited ions were created with an extended negative glow discharge through a gas mixture of 1 mtorr of H2O, 2 mtorr of H2, and 12 mtorr of Ar. The discharge cell is 1.2 m in length and 5 cm in diameter, and is equipped with a solenoid coil which generates an axial magnetic field of about 150 G. Typical discharge currents were 10 mA and the voltage across the electrodes was about 3 kV. The discharge was cooled by flowing methanol through the cooling jacket, and the temperature of the methanol bath was set to 190 K. A single pass of the terahertz radiation through the discharge cell was used in our experiment. The Doppler shift of the line positions due to ion drift is expected to be much less than the experimental uncertainties due to the very weak electric field of the negative glow zone (von Engel 1965).
Compared to our previous study in 2009 in which eight H3O+ transitions were observed (Yu et al. 2009), our current work detected 47 H3O+ lines. There are two factors contributing to this significant improvement. First, we were able to achieve extended negative glow discharge to generate highly excited H3O+ ions in the current work. The extended negative glow discharge enhanced the H3O+ production by a factor of about 10, compared to the regular positive column discharge used in our previous work. Second, our new frequency multiplier chains provided us with more power and frequency coverage.
3. RESULTS AND DISCUSSION
Forty-seven ground state inversion transitions of H3O+ have been directly detected. The highest metastable level observed was J = K = 12, and the inversion transition at 1953372.305(100) MHz is shown in Figure 1. An experimental uncertainty of 100 kHz was assigned to the measured line position. The J = K = 13 metastable transition is beyond our detection limit because it is predicted to be four time weaker than the J = K = 12 one and occurs at 2013905 MHz which is above the useful range of our terahertz source.

Figure 1. Observed J = K = 12 metastable transition between the ground state inversion doublet of H3O+. The lower state energy is 999 cm−1 and the logarithm of intensity in nm2 × MHz at 300 K is −1.18. The integration time was 6 s on each point. An experimental uncertainty of 100 kHz was assigned to the measured line position, which was found to differ by 25.6 MHz from the catalog value that was used for Herschel data analysis in Lis et al. (2012) and González-Alfonso et al. (2013).
Download figure:
Standard image High-resolution imageTable 1 lists the observed position, experimental uncertainty, and difference from the current model and the model in Yu et al. (2009) for all laboratory-measured ground state inversion transitions of H3O+. We measured 22 new transitions in the current work, with an estimated experimental uncertainty ranging from 100 to 300 kHz. We also re-measured 25 previously measured transitions and improved their experimental accuracy from 0.3–1.2 MHz to 0.1–0.3 MHz. It was found that the experimental uncertainty for seven of eight transitions measured in our previous work (Yu et al. 2009) was overestimated; the actual accuracy is 100 kHz instead of the claimed 300 kHz.
Table 1. Observed Position, Experimental Uncertainty, Difference from the Current Model, and Difference from the Model in Yu et al. (2009) for all Laboratory Measured Ground State Inversion Transitions of H3O+ (All in MHz)
 |
ν' |  |
ν'' | Observed | Unc. | O. − C.a | O. − C.b | Ref |
|---|---|---|---|---|---|---|---|---|
| 11 | 0− | 21 | 0+ | 307192.410 | 0.050 | 0.002 | 0.002 | 1 |
| 32 | 0+ | 22 | 0− | 364797.427 | 0.100 | 0.095 | −0.003 | 2 |
| 31 | 0+ | 21 | 0− | 388458.641 | 0.080 | 0.085 | 0.095 | 2 |
| 30 | 0+ | 20 | 0− | 396272.412 | 0.060 | −0.009 | −0.036 | 2 |
| 00 | 0− | 10 | 0+ | 984711.888 | 0.100 | 0.024 | 0.081 | This work |
| 00 | 0− | 10 | 0+ | 984711.907 | 0.300 | 0.043 | 0.099 | 6 |
| 00 | 0− | 10 | 0+ | 984712.218 | 0.900 | 0.354 | 0.410 | 3 |
| 43 | 0+ | 33 | 0− | 1031293.719 | 0.100 | −0.067 | −0.156 | This work |
| 43 | 0+ | 33 | 0− | 1031293.738 | 0.300 | −0.048 | −0.137 | 6 |
| 43 | 0+ | 33 | 0− | 1031293.700 | 0.900 | −0.086 | −0.175 | 3 |
| 42 | 0+ | 32 | 0− | 1069826.484 | 0.100 | −0.091 | 0.007 | This work |
| 42 | 0+ | 32 | 0− | 1069826.632 | 0.300 | 0.057 | 0.155 | 6 |
| 42 | 0+ | 32 | 0− | 1069826.415 | 0.900 | −0.160 | −0.062 | 3 |
| 41 | 0+ | 31 | 0− | 1092523.071 | 0.100 | −0.096 | −0.356 | This work |
| 41 | 0+ | 31 | 0− | 1092523.136 | 0.300 | −0.031 | −0.291 | 6 |
| 96 | 0− | 96 | 0+ | 1440361.333 | 0.300 | −0.171 | −0.169 | This work |
| 85 | 0− | 85 | 0+ | 1453139.018 | 0.300 | 0.216 | 1.415 | This work |
| 62 | 0− | 62 | 0+ | 1454568.921 | 0.300 | −0.172 | 6.377 | This work |
| 74 | 0− | 74 | 0+ | 1470429.727 | 0.300 | 0.503 | 3.368 | This work |
| 63 | 0− | 63 | 0+ | 1492522.061 | 0.300 | −0.262 | −5.881 | This work |
| 63 | 0− | 63 | 0+ | 1492523.887 | 1.500 | 1.565 | −5.055 | 4 |
| 52 | 0− | 52 | 0+ | 1519412.346 | 0.300 | −0.013 | 2.572 | This work |
| 86 | 0− | 86 | 0+ | 1537336.334 | 0.300 | −0.303 | −1.417 | This work |
| 86 | 0− | 86 | 0+ | 1537337.703 | 1.500 | 1.066 | −0.048 | 4 |
| 97 | 0− | 97 | 0+ | 1539291.860 | 0.300 | −0.236 | −1.486 | This work |
| 97 | 0− | 97 | 0+ | 1539293.309 | 1.500 | 1.213 | −0.038 | 4 |
| 75 | 0− | 75 | 0+ | 1539892.327 | 0.300 | −0.105 | −0.371 | This work |
| 75 | 0− | 75 | 0+ | 1539894.693 | 1.500 | 2.260 | 1.995 | 4 |
| 108 | 0− | 108 | 0+ | 1545713.210 | 0.300 | −0.105 | −0.692 | This work |
| 64 | 0− | 64 | 0+ | 1547025.613 | 0.100 | 0.029 | 0.695 | This work |
| 64 | 0− | 64 | 0+ | 1547026.396 | 1.500 | 0.812 | 1.479 | 4 |
| 41 | 0− | 41 | 0+ | 1551454.600 | 0.300 | 0.017 | 1.414 | This work |
| 119 | 0− | 119 | 0+ | 1556577.699 | 0.300 | 0.128 | −0.762 | This work |
| 119 | 0− | 119 | 0+ | 1556578.413 | 1.500 | 0.842 | −0.048 | 4 |
| 53 | 0− | 53 | 0+ | 1558945.454 | 0.100 | −0.034 | 3.115 | This work |
| 53 | 0− | 53 | 0+ | 1558946.294 | 1.500 | 0.806 | 3.955 | 4 |
| 42 | 0− | 42 | 0+ | 1575493.883 | 0.300 | 0.168 | 0.796 | This work |
| 31 | 0− | 31 | 0+ | 1597067.355 | 0.300 | 0.049 | 0.188 | This work |
| 54 | 0− | 54 | 0+ | 1615591.770 | 0.100 | −0.068 | 0.034 | This work |
| 54 | 0− | 54 | 0+ | 1615592.071 | 0.300 | 0.233 | 0.335 | 6 |
| 54 | 0− | 54 | 0+ | 1615593.188 | 2.000 | 1.350 | 1.452 | 4 |
| 43 | 0− | 43 | 0+ | 1616266.706 | 0.100 | 0.097 | −0.426 | This work |
| 43 | 0− | 43 | 0+ | 1616266.622 | 0.300 | 0.013 | −0.510 | 6 |
| 43 | 0− | 43 | 0+ | 1616268.291 | 2.000 | 1.682 | 1.159 | 4 |
| 65 | 0− | 65 | 0+ | 1619699.056 | 0.100 | −0.071 | −0.355 | This work |
| 65 | 0− | 65 | 0+ | 1619699.131 | 0.300 | 0.004 | −0.280 | 6 |
| 65 | 0− | 65 | 0+ | 1619700.405 | 2.000 | 1.278 | 0.994 | 4 |
| 32 | 0− | 32 | 0+ | 1621739.375 | 0.100 | −0.014 | 0.101 | This work |
| 32 | 0− | 32 | 0+ | 1621739.352 | 0.300 | −0.036 | 0.078 | 6 |
| 32 | 0− | 32 | 0+ | 1621738.993 | 2.000 | −0.395 | −0.281 | 4 |
| 76 | 0− | 76 | 0+ | 1628558.116 | 0.100 | −0.038 | −0.588 | This work |
| 76 | 0− | 76 | 0+ | 1628560.891 | 2.000 | 2.737 | 2.188 | 4 |
| 21 | 0− | 21 | 0+ | 1632090.861 | 0.100 | −0.082 | −0.119 | This work |
| 87 | 0− | 87 | 0+ | 1642178.621 | 0.100 | 0.048 | −0.268 | This work |
| 87 | 0− | 87 | 0+ | 1642178.993 | 2.000 | 0.420 | 0.103 | 4 |
| 11 | 0− | 11 | 0+ | 1655835.109 | 0.100 | 0.018 | 0.261 | This work |
| 11 | 0− | 11 | 0+ | 1655833.910 | 1.500 | −1.180 | −0.938 | 4 |
| 22 | 0− | 22 | 0+ | 1657248.807 | 0.100 | 0.001 | 0.422 | This work |
| 98 | 0− | 98 | 0+ | 1660591.864 | 0.100 | 0.035 | 0.440 | This work |
| 33 | 0− | 33 | 0+ | 1663588.058 | 0.100 | 0.054 | 0.716 | This work |
| 44 | 0− | 44 | 0+ | 1674865.039 | 0.100 | 0.017 | 0.542 | This work |
| 44 | 0− | 44 | 0+ | 1674866.114 | 1.500 | 1.092 | 1.618 | 4 |
| 109 | 0− | 109 | 0+ | 1683851.422 | 0.300 | 0.169 | 0.480 | This work |
| 109 | 0− | 109 | 0+ | 1683850.894 | 1.500 | −0.359 | −0.048 | 4 |
| 55 | 0− | 55 | 0+ | 1691133.925 | 0.100 | −0.024 | 0.158 | This work |
| 55 | 0− | 55 | 0+ | 1691134.262 | 1.500 | 0.313 | 0.496 | 4 |
| 54 | 0+ | 44 | 0− | 1692316.915 | 0.100 | 0.033 | −1.022 | This work |
| 1110 | 0− | 1110 | 0+ | 1712031.010 | 0.100 | −0.027 | -4.662 | This work |
| 66 | 0− | 66 | 0+ | 1712459.803 | 0.100 | −0.025 | −0.320 | This work |
| 66 | 0− | 66 | 0+ | 1712460.988 | 1.500 | 1.160 | 0.865 | 4 |
| 77 | 0− | 77 | 0+ | 1738936.020 | 0.100 | 0.013 | −0.569 | This work |
| 77 | 0− | 77 | 0+ | 1738935.510 | 1.500 | −0.497 | −1.078 | 4 |
| 53 | 0+ | 43 | 0− | 1745127.371 | 0.100 | −0.005 | 0.240 | This work |
| 88 | 0− | 88 | 0+ | 1770678.554 | 0.100 | 0.017 | −0.353 | This work |
| 88 | 0− | 88 | 0+ | 1770678.615 | 1.500 | 0.077 | −0.292 | 4 |
| 52 | 0+ | 42 | 0− | 1781805.268 | 0.100 | 0.034 | 0.665 | This work |
| 51 | 0+ | 41 | 0− | 1803407.189 | 0.100 | 0.102 | −0.196 | This work |
| 99 | 0− | 99 | 0+ | 1807825.367 | 0.100 | −0.019 | 0.163 | This work |
| 99 | 0− | 99 | 0+ | 1807825.508 | 1.500 | 0.122 | 0.304 | 4 |
| 50 | 0+ | 40 | 0− | 1810454.545 | 0.100 | −0.065 | −0.202 | This work |
| 1010 | 0− | 1010 | 0+ | 1850535.194 | 0.100 | −0.005 | −0.391 | This work |
| 1111 | 0− | 1111 | 0+ | 1898985.800 | 0.300 | 0.008 | −6.116 | This work |
| 1212 | 0− | 1212 | 0+ | 1953372.305 | 0.100 | 0.004 | −25.582 | This work |
| 75 | 0+ | 65 | 0− | 3077891.800 | 2.000 | −1.169 | 0.797 | 5 |
Notes. aDifference between the observed value and the calculated one from the model of this work. bDifference between the observed value and the calculated one from the JPL catalog (Yu et al. 2009). References. (1) Plummer et al. 1985; (2) Bogey et al. 1985; (3) Verhoeve et al. 1988; (4) Verhoeve et al. 1989; (5) Stephenson & Saykally 2005; (6) Yu et al. 2009.
The newly measured and re-measured positions were added to the fit of our previous analysis of H3O+. We refer readers to our previous work (Yu et al. 2009) for details on the Hamiltonian and data sets for the data analysis. The following ΔK = ±6 interaction was necessary to be added to the Hamiltonian to fit the newly measured and improved positions to experimental accuracy:
with ν = 0+ and 0−. Note that η is also known as h3 in non-tunneling near-spherical rotors. The operator code for this interaction is 600vv in the SPFIT/SPCAT programs (Pickett 1991). The SPFIT/SPCAT input and output files are provided in the tar.gz package available in the online journal or at http://spec.jpl.nasa.gov. For the updated H3O+ catalog file, all possible transitions up to J = 25 were predicted. We refer readers to Yu et al. (2009) for details on the dipole moments used for the calculations of the intensities. Note that our analysis included experimental data with Jmax = 12 for the ground state inversion transitions, 10 for ν1, 15 for ν2, 16 for ν3, and 7 for ν4.
Our new measurements included Jmax = 12 and Kmax = 12 for the ground vibrational states, 0+ and 0−, while previous literature work observed Jmax = 11 and Kmax = 9. With our new measurements added to the data analysis, most molecular parameters agree within 3σ with previous values obtained in Yu et al. (2009) and only the high-order 8th centrifugal distortion constants, L, were affected. Table 2 lists the spectroscopic constants obtained of 0+ and 0− from the current work and from Yu et al. (2009). For the 0+ vibrational state, LJJJK is 4.114(210)E-6 versus 7.50(113)E-06 and LJJKK is −0.01025(47)E-03 versus −0.01927(224)E-03. For the 0− vibrational state, LJKKK is −6.318(264)E-06 versus −0.01161(118)E-03. Yu et al. (2009) achieved an overall reduced rms of 1.6, a microwave rms of 1.22 MHz for the ground-state inversion transitions, and an IR rms of 0.019 cm−1 for the fundamental data. The current fit obtained the same overall reduced rms and IR rms, and a microwave rms of 0.62 MHz. The overall reduced rms and IR rms remained unchanged due to the fact that the IR data sets dominate the fits. It was found that the added ΔK = ±6 interaction decreased the microwave rms from 1 MHz to 0.62 MHz. Table 1 shows the fit residuals of the two fits. With the current Hamiltonian model, most of previously measured frequencies were fit with slightly smaller residuals; all the newly measured frequencies were fit with significantly reduced residuals. The J = K = 12 metastable transition at 1953372.305(100) MHz was fit with a residual of 4 kHz in the current work, and the corresponding residual was −25.6 MHz in Yu et al. (2009). With all microwave transitions taken into account, the microwave rms is 0.62 MHz versus 3.27 MHz for the current model versus our Yu et al. (2009) model; the reduced microwave rms is 0.6 versus 29.0.
Table 2. Obtained Spectroscopic Parameters (in MHz) for H3O+
| IIIl | OC | 0− (This Work) | 0− (Yu et al. 2009) | 0+ (This Work) | 0+ (Yu et al. 2009) |
|---|---|---|---|---|---|
| E | vv | 1659350.714(78) | 1659350.48(36) | 0a | 0a |
| B | 1vv | 331411.7516(245) | 331411.766(107) | 337400.3181(295) | 337400.203(115) |
| C−B | 10vv | −144585.3(226) | −144575.0(240) | −153043.1(226) | −153032.5(240) |
| −DJ | 2vv | −30.45448(185) | −30.4531(102) | −40.47501(216) | −40.4623(83) |
| −DJK | 11vv | 56.3522(52) | 56.3446(295) | 83.7618(54) | 83.7270(262) |
| −DK | 20vv | −31.42(36) | −31.67(38) | −49.88(36) | −50.13(39) |
| HJ | 3vv | 5.148(40)E-03 | 4.872(184)E-03 | 0.014223(42) | 0.013890(207) |
| HJJK | 12vv | −0.014456(152) | −0.01375(63) | −0.051041(148) | −0.05066(86) |
| HJKK | 21vv | 0.013203(244) | 0.01370(87) | 0.060509(243) | 0.06219(129) |
| HK | 30vv | ... | ... | −0.019650(46) | −0.02037(44) |
| LJJJK | 13vv | ... | ... | 4.114(210)E-06 | 7.50(113)E-06 |
| LJJKK | 22vv | ... | ... | −0.01025(47)E-03 | −0.01927(224)E-03 |
| LJKKK | 31vv | −6.318(264)E-06 | −0.01161(118)E-03 | ... | ... |
 b b |
2300vv' | 8.4743(56)c | 8.506(62)c | 8.4743(56)c | 8.506(62)c |
| η | 600vv | −0.0912(65)E-03 | ... | −0.0487(61)E-03 | ... |
Notes.
aThe vibrational energy of the ν = 0+ state is fixed to zero in our fit. In addition, the energies of all rotational levels are systematically shifted by a constant value so that the absolute energy of J = K = 1 of ν = 0+, the lowest allowed rotational level of H3O+, is zero.
bNote that α is also known as  : α is more common or exclusively used in tunneling problems whereas is more common in non-tunneling near-spherical rotors.
cThe off-diagonal parameter connecting the ΔK = ±3 rotational levels of the 0− and 0+ vibrational states (see Equation (8) in Yu et al. 2009 for details).
: α is more common or exclusively used in tunneling problems whereas is more common in non-tunneling near-spherical rotors.
cThe off-diagonal parameter connecting the ΔK = ±3 rotational levels of the 0− and 0+ vibrational states (see Equation (8) in Yu et al. 2009 for details).
Download table as: ASCIITypeset image
Figures 2 and 3 show the obtained rotational energy level diagram of H3O+ in its lowest vibrational state. H3O+ is a closed-shell ion whose ground state has a permanent dipole moment of 1.438 D (Botschwina et al. 1983). It has a pyramidal structure and is iso-electronic to ammonia (Yu et al. 2010). NH3 has a well-known radio frequency (24 GHz) inversion splitting due to the tunneling of the nitrogen atom through the plane of the hydrogen atoms. Like NH3, H3O+ undergoes inversion, and it has an inversion splitting of 1.6 THz, which leads to inversion transitions occurring in the submillimeter and terahertz region. H3O+ is oblate. Due to the hydrogen nuclear spin statistics, levels with K = 3n are ortho (I = 3/2), and those with K = 3n + 1 and 3n + 2 are para (I = 1/2). The ortho and para levels are also known as the A and E levels, respectively. Figures 2 and 3 show the ortho and para energy levels in ν = 0+ of H3O+, the symmetric inversion state of the ground vibrational state. The levels of ν = 0−, the asymmetric inversion state, which are not shown in Figures 2 and 3, have similar patterns and are systematically ∼55 cm−1 higher in energy than their counterparts in ν = 0+, except that only J = 0, 2, 4, ... are allowed for K = 0 of ν = 0−. The energy of J = 0 and K = 0 in ν = 0− is 32.8 cm−1 higher than that of J = 1 and K = 0 in ν = 0+. Within the ortho manifold and within the para manifold, radiative transitions between ν = 0− and ν = 0+ ("+"↔ "−") with ΔK = 0 and ΔJ = 0, ±1 are to first order allowed and very strong, and those with ΔK ≠ 0 are to first order forbidden, resulting in a population cascading down and being trapped in the levels at the bottom of the K ladders and therefore the metastable character of the J = K levels of ν = 0+.

Figure 2. H3O+ ν = 0+ ortho energy levels and ΔK = 3 ("+"↔ "+") forbidden transitions involving the J = K metastable levels (thick black line denotes the lowest rotational ortho level; red lines indicate metastable levels; energies are relative to the lowest para level, J = K = 1 of ν = 0+). The rotational quantum numbers J = K, K + 1, K + 2, ... for all K ladders with the exception that only J = 1, 3, 5, ... are allowed for K = 0 of ν = 0+.
Download figure:
Standard image High-resolution image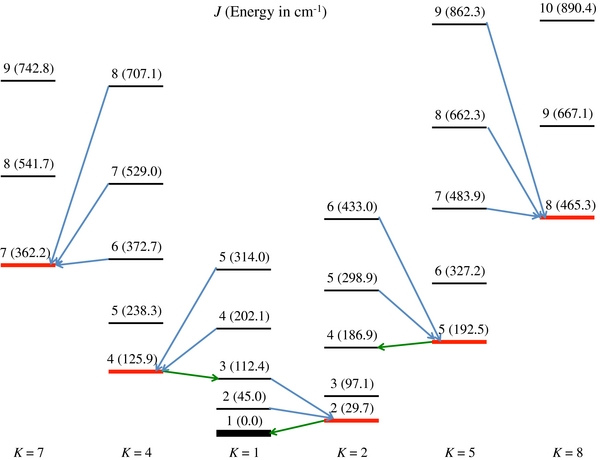
Figure 3. H3O+ ν = 0+ para energy levels, and ΔK = 3 ("+"↔ "+") forbidden transitions involving the J = K metastable levels (thick black line denotes the lowest rotational para level, red lines indicates metastable levels, energies are relative to the lowest para level, J = K = 1 of ν = 0+). The rotational quantum numbers J = K, K + 1, K + 2, ... for all K ladders.
Download figure:
Standard image High-resolution image
Radiative transitions within ν = 0− ("−"↔ "−") and within ν = 0+ ("+"↔ "+") with ΔK = 3 and ΔJ = 0 or ±1 are to first order forbidden but second order (distortion) allowed but generally very weak. Figures 2 and 3 show such ΔK = 3 forbidden transitions that involves the metastable J = K levels of ν = 0+. Within the ortho manifold as indicated in Figure 2, the J = K levels always have lower energies than their corresponding J − 1, J, and J + 1 levels of K − 3, i.e., the J = K = 6 level has an energy of 271.2 cm−1, compared to 273.7, 407.9, and 564.0 cm−1 of J = 5, 6, and 7 of K = 3. The same applies to the J = K ⩾ 7 levels within the para manifold shown in Figure 3. However, the J = K = 2, 4, and 5 levels have higher energies than their corresponding J − 1 level of K − 3, so that population can exit the J = K = 2, 4, and 5 metastable levels through such ΔK = 3 forbidden transitions.
H3O+ can be formed by mainly two pathways in the interstellar medium. In higher density gas it is formed by the reaction of H with H2O and can be used as a proxy for water vapor from the ground (Phillips et al. 1992). In the diffuse medium H3O+ is the end product of a series of highly exothermic reactions of O+ with H2 (González-Alfonso et al. 2013) that add one proton per reaction. The population trapped in the J = K levels in the low density gas is almost certainly a remnant of the formation process. Understanding H3O+ in the low density gas requires observing the metastable transitions, both above and below J = K = 6 of the lower symmetric inversion state.
In conclusion, in this work we employed terahertz absorption spectroscopy and extended negative glow discharge to study highly excited H3O+ transitions between the ground state inversion doublet. In the 0.9–2.0 THz region, we measured 22 new transitions and re-measured 25 previously measured transitions, with experimental uncertainties ranging from 100 to 300 kHz. We fit the new and improved measurements to experimental accuracies with an updated Hamiltonian and provide improved predictions for H3O+.
We would like to thank professor Takayoshi Amano for helpful discussions on the topic of extended negative glow discharge. The research described in this paper was performed at the Jet Propulsion Laboratory, California Institute of Technology, under contract with the National Aeronautics and Space Administration.