


ABSTRACT
We describe the evolution of the magnetic and velocity fields in the annular zone around a pore a few hours before the formation of its penumbra. We detected the presence of several patches at the edge of the annular zone, with a typical size of about 1''. These patches are characterized by a rather vertical magnetic field with polarity opposite to that of the pore. They correspond to regions of plasma upflow up to 2.5 km s−1 and are characterized by radially outward displacements with horizontal velocities up to 2 km s−1. We interpret these features as portions of the pore magnetic field lines returning beneath the photosphere being progressively stretched and pushed down by the overlying magnetic fields. Our results confirm that the penumbra formation results from changes in the inclination of the field lines in the magnetic canopy overlying the pore, until they reach the photosphere.
Export citation and abstract BibTeX RIS
1. INTRODUCTION
The formation of the penumbra in a sunspot is a common phenomenon in solar active regions, but there are few observations of this process that have been carried out with high spatial, spectral, and temporal resolution. Therefore, many open questions about the penumbra and its formation are still unsolved. For example, there is an issue regarding the bolometric brightness of the penumbra, which is ∼75% of the quiet solar surface on average, although at the moment the observed plasma velocities are not consistent with transport in the photosphere of sufficient heat to justify this brightness (Schlichenmaier & Solanki 2003). In fact, the plasma velocities are mostly horizontal, with small upward motion along the bright components of the penumbra fine structure (see, e.g., Langhans et al. 2005). It is also unknown whether or not the crucial flux content and inclination angle of the magnetic field in the pore exist for the formation of a penumbra (see, e.g., Leka & Skumanich 1998; Keppens & Martínez Pillet 1996).
Other controversial aspects are related to the Evershed flow observed along the penumbral filaments: the connection between the large-scale outflows and the intensity structure is not yet clear, and neither are the depth profile and the evolution of this flow. Schlichenmaier et al. (2005) and Ichimoto et al. (2007) found a positive correlation in the inner penumbra and a negative correlation in the outer penumbra between the flow and the intensity variations.
From analysis of a unique high quality spectropolarimetric data set taken at the German Vacuum Tower Telescope, Schlichenmaier et al. (2010a, 2010b) and Rezaei et al. (2012) deduced several constraints leading to the formation of sunspot penumbrae. They found that the penumbra forms in segments and that, initially, it cannot settle down on the side toward the opposite polarity, due to the ongoing flux emergence. They also found that while the penumbra forms, the umbral area and the magnetic field remain constant and the new magnetic flux joining the spot, in the form of granular-scale bipoles, is linked to the process of penumbra formation. Further analyses of Schlichenmaier et al. (2012) showed that the early stages of penumbral formation seem to be associated with a plasma flow that has the opposite sign of the typical Evershed flow.
Recent observations suggest that the magnetic canopy overlying the region surrounding the umbra at the chromospheric level may play an important role in the formation of the penumbra in the photosphere. Lim et al. (2013) proposed a possible scenario in which the penumbra forms when the emerging flux is trapped at the photospheric level by the overlying chromospheric canopy fields. Instead, Shimizu et al. (2012) and Romano et al. (2013, hereafter Paper I) detected a 3''–5'' width annular zone around pores, before the formation of their penumbra, in the Ca ii H 396.8 nm line and Ca ii 854.2 nm line, respectively. They interpreted this signature as evidence that the magnetic canopy, already existing at the higher level of the solar atmosphere, may evolve into the highly inclined penumbral fields at the photospheric level. Paper I shows evidences of the signature of the forming penumbra not only at the chromospheric level, but also in photospheric Fe i 650.3 nm line observations. In particular, Romano et al. (2013) found that in the annular zone, the magnetic field strength and its inclination were about 1 kG and 80°, respectively. They also observed several sectors characterized by almost horizontal values of inclination and some characterized by more vertical field lines. This field pattern has been interpreted as an uncombed state of the magnetic field around the pore. Moreover, in the Ca ii 854.2 nm line, the plasma seemed to flow according to the inclination and the azimuth of the uncombed magnetic field, with downflow and upflow in the inner and outer parts of the annular zone, respectively.
In this paper, we describe the evolution of the annular zone observed around a pore of the active region NOAA 11490 at photospheric and chromospheric levels using the spectropolarimetric data set already presented in Paper I, whose results are derived from the best quality scan, taken at around 13:59 UT with the best seeing conditions. Here we show the results obtained from the whole time series available for the Fe i 630.25 nm and Ca ii 854.2 lines taken on 2012 May 28, lasting 32 minutes. The analysis of these data allows us to describe the variations of the plasma velocities along the line of sight (LOS) and of the intensity, azimuth, and inclination angle of the magnetic field a few hours before the formation of the penumbra. Section 2 summarizes and discusses the observations and the analysis. The results are presented in Section 3, while Section 4 presents the interpretation.
2. OBSERVATIONS AND ANALYSIS
We analyzed observations of the active region NOAA 11490 (μ ∼ 0.95) acquired on 2012 May 28, from 13:39 UT to 14:12 UT, by the Interferometric Bidimensional Spectrometer (IBIS; Cavallini 2006) operating at the NSO/Dunn Solar Telescope (DST). In particular, the results presented therein are derived from analysis of the observations of the field of view (FOV) A indicated in Figure 1 of Paper I (upper panel). This FOV is characterized by the presence of a pore, which developed a penumbra in about 10 hr. The data set essentially consists of 30 scans of the Fe i 630.25 nm line, observed in spectropolarimetric mode, and of the Ca ii 854.2 nm line, observed without polarimetric measurements. The Fe i and Ca ii lines have been sampled with a FWHM = 2 pm and an average step = 2 pm, corresponding to 30 and 25 wavelength points, respectively. The pixel scale in the data of both lines was 0 09, while the integration time per wavelength was 60 ms. A detailed description of the whole data set can be found in Paper I.
To deduce the evolution of the intrinsic magnetic field strength, inclination and azimuth angles, and the LOS velocity in the photosphere, we performed a single-component inversion of the Stokes profiles of all the available scans of the Fe i 630.25 nm line using the SIR code (Ruiz Cobo & del Toro Iniesta 1992). For further details about the inversion method we refer to Paper 1.
We also estimated the LOS velocity of the plasma in the chromosphere from the analysis of the Ca ii line scans. Since there is no absolute wavelength reference in IBIS observations, we considered the median of the Ca ii line centroid in the whole FOV as wavelength reference. Then we estimated the plasma velocity from the Doppler shift of the centroid of the line profile in each spatial point with respect to this median.
3. RESULTS
From the analysis of all the available scans, we confirm the presence of the annular zone around a pore of AR NOAA 11490, as already described in Paper I; we also found the persistence of its main magnetic and dynamics characteristics during the whole observation time interval of IBIS observations lasting 32 minutes. In the continuum of the Fe i 630.25 nm line, the pore shows a slight variation of its shape and boundaries (compare the top left and top right panels of Figure 1, where the contours correspond to 0.67 of the intensity normalized to the average intensity of a region of quiet Sun present in the FOV). However, the magnetic flux content of the pore computed inside the contour of Figure 1 is about 1.1 × 10²¹ Mx: this value does not show any variation during the observation time interval. Only a slight intensification of the magnetic field strength in the annular zone around the pore is visible when comparing the two middle panels of Figure 1, taken, respectively, at the beginning (13:48 UT) and at the end (14:12 UT) of the observation time interval, although it is not possible to discriminate between a real increase of the magnetic field due to flux emergence and the effect of the seeing improvement.
Figure 1. Snapshots of the intensity (top panels), strength(middle panels), and inclination (bottom panels) maps of the magnetic fields obtained from the Fe i 630.25 nm line taken by IBIS at the beginning (13:40 UT) (left column) and end (14:12 UT) (right column) of the observation time interval. The green and black crosses indicate the location of the patch barycenters at the beginning and end of the observation time interval, respectively. North is at the top, west is to the right.
(An animation and a color version of this figure are available in the online journal.)
Download figure:
Video Standard image High-resolution imageThe bottom left and bottom right panels of Figure 1 show the maps of the magnetic field inclination acquired at 13:48 UT and 14:12 UT, respectively, with 0° corresponding to the outgoing magnetic field normal to the solar surface. In these maps and in the movie available in the online journal, we measured an average inclination of the field in the annular zone of about 60°. At its external edge, we detected the presence of some regions characterized by an inclination of the magnetic field larger than 135° and by a typical size of about 1''. These regions, which are characterized by a circular shape, according to their inclination angle, correspond to regions with a polarity opposite to that of the pore. In order to understand their role in the penumbra formation process, we analyzed in detail their dynamics and the magnetic field properties of these patches.
We identified four groups of patches.
- 1.In the northern part of the pore, where the uncombed structure of the magnetic field is more evident due to the presence of some sectors of the annular zone characterized by a different inclination, we note some patches of negative polarity located corresponding to the more horizontal sectors of the magnetic field, between sectors of more vertical field (see the yellow tongues corresponding to an inclination of about 45° in the bottom right panel of Figure 1).
- 2.The second group of patches is located in the southeast part of the annular zone. These patches show a complex evolution and strong interaction, as these regions with an inclination larger than 135° mix with each other in some cases.
- 3.The third group consists of a single patch located in the southwest part of the annular zone.
- 4.Finally, the fourth group of patches is located at the east border of the pore, and thus on the side toward the opposite polarity of the AR. These patches are probably the signatures of a sea-serpent configuration, typical of the ongoing flux emergence (Harvey & Harvey 1973), as already shown in Paper I. We defer the study of the flux emergence between the pore and the opposite polarity to future work.
We studied in detail the patches visible during the whole observation time interval, numbering them from 1 to 6 in the bottom left panel of Figure 1. All of these patches correspond to regions of magnetic field strength larger than 400 G, i.e., above the threshold corresponding to the polarimetric sensitivity achieved by the instrument (the average noise level for Stokes V is 3 × 10⁻³ in units of the continuum intensity). We neglected patch 4 from this analysis because its evolution was very complex and characterized by merging with other neighboring patches. Most of the analyzed patches show a clear decrease of their size during the analyzed time interval, but the duration of the available observations does not allow us to estimate their lifetime. In some cases, new patches appear near the location where the previous patches were located at the beginning of the observations (see the new patch visible in the bottom right panel of Figure 1 at 14:12 UT in the northern part of the annular zone).
Table 1 summarizes the average magnetic field strength (second column), the area (third column), the magnetic flux (fourth column), and the inclination of the magnetic field (fifth column) over the whole observing time interval for the analyzed patches. We found that all of the patches are characterized by an average magnetic flux greater than 0.5 × 10¹⁸ Mx and by an average inclination higher than 140°. This means that their field lines are rather vertical with respect to the solar photosphere.
Table 1. Properties of the Analyzed Patches
| Patch | Average Field | Area | Magnetic Flux | Inclination | LOS Velocity |
|---|---|---|---|---|---|
| Strength (G) | (1015 cm2) | (1018 Mx) | (deg) | (km s−1) | |
| 1 | 1030 | 1.9 | 2.1 | 140 | 0.7 |
| 2 | 850 | 4.5 | 3.9 | 143 | 0.7 |
| 3 | 420 | 2.1 | 0.9 | 152 | 2.5 |
| 5 | 560 | 1.5 | 0.9 | 145 | 0.5 |
| 6 | 730 | 0.6 | 0.5 | 145 | 1.3 |
Download table as: ASCIITypeset image
From the movie of the inclination maps available in the online journal, we note that all of the patches move radially outward. We measured the horizontal displacements of the barycenter of each patch, i.e., of each group of pixels with an inclination larger than 135°. We indicate in Figure 1 (middle and bottom panels) with the green and black crosses the position of the barycenter of each patch at the beginning and end of the observation time interval, respectively. From the comparison of these images, we deduce that all patches move radially by about 1'' or 2'' in 32 minutes, corresponding to horizontal velocities between 1 and 2 km s−1. Figure 2 shows the distance between the barycenter of patch 5 and the barycenter of the pore for all the inclination maps obtained from the SIR inversion. We estimated the error in the determination of the barycenter to be 2σ, with σ corresponding to the pixel scale of IBIS data. We note that the outward displacement is almost continuous: a linear fit corresponding to a velocity of about 2 km s−1 can be overplotted within the errors in the central frames of the observation time interval, i.e., during the best seeing conditions.

Figure 2. Plot of the distance between the barycenters of the patch N. 5 and the pore in different magnetic field inclination maps. The continuum line indicates the best linear fit corresponding to a velocity of about 2 km s−1
Download figure:
Standard image High-resolution imageFrom the inversion of the Stokes profiles of the Fe i 630.25 nm line, we estimated the LOS velocity of the plasma in the same FOV (top panels of Figure 3). The annular zone was characterized by a lack of plasma upflow and by an average downflow lower than 1 km s−1. The comparison of the photospheric velocity maps obtained at the beginning (top left panel of Figure 3) and end (top right panel of Figure 3) of the observation time interval shows an increase of the width of the annular zone, characterized by this velocity pattern, from 3'' to 5''. Moreover, from the location of the crosses indicating the position of the barycenter of the patches, we note that the patches correspond to areas of persistent upflow plasma motions (blue areas in the top panels of Figure 3). In the sixth column of Table 1, we list the average LOS velocities inside the patches deduced from the analysis of all available observations. We found that the upward plasma velocity is between 0.5 and 2.5 km s−1.
Figure 3. Map of the LOS velocities derived from photospheric observations at the Fe i (top panels) and chromospheric observations at the Ca ii line (bottom panels) at the beginning (13:40 UT) (left column) and end (14:12 UT) (right column) of the observation time interval. The crosses indicate the location of the patch barycenters. The blue (negative) and red (positive) velocities indicate upflow and downflow, respectively. North is at the top, west is to the right.
(An animation and a color version of this figure are available in the online journal.)
Download figure:
Video Standard image High-resolution imageThe Doppler velocity of the plasma deduced from the time series of Ca ii observations shows a pattern in the annular zone that recalls the inclination and the azimuth of an uncombed magnetic field with radial elongated regions of upflow and downflow around the pore (see the bottom panels of Figure 3 and the movie of the Doppler maps available in the online journal). In particular, we found that the patches are located at the outer edge of the annular zone and mostly in the same azimuthal direction of the elongated regions characterized by the strongest chromospheric downflow (see the red tongues around the pore contour in the bottom panels of Figure 3 and the location of the patches). Only patch 1 seems to correspond at 14:13 UT (bottom right panel of Figure 3) to an elongated region of strong upflow, but it is worth noting that this patch is going to disappear at that time. On the other hand, at the end of the observation time interval, a new patch appears at the East side of patch 1 (see the bottom right panel of Figure 1). We see that this new patch is in the azimuthal direction of elongated regions of about null velocity between two regions of upflow. Unfortunately, we cannot say anything about the subsequent evolution of the chromospheric velocity during this patch development due to the temporal limitation of the IBIS data set. However, it is evident that there are not patches in the west side of the pore where elongated regions of chromospheric upflow prevail.
4. DISCUSSION AND CONCLUSIONS
In this paper, we studied the evolution at the photospheric and chromospheric levels of the magnetic field and the plasma LOS velocity of an annular zone observed before the formation of a penumbra in one of the leading polarity sunspots of active region NOAA 11490. This zone has a 3''–5'' width similar to the zone revealed in another AR by Shimizu et al. (2012).
In our previous work (Paper I), from the inversion of a single scan of the Fe i 630.25 nm observations, we found that an uncombed pattern of the magnetic field characterized the annular zone, already visible some hours before the penumbra formation. Here we presented the results obtained from the inversion of all the available polarimetric scans, with particular emphasis on the analysis of the variation of the magnetic field inclination in time.
The results of this study confirm the previous findings of Paper I. The observed annular zone is characterized in the photosphere by a magnetic field strength larger than 1 kG and an average inclination of about 60°, although the inclination is not constant around the pore. We also found that the LOS velocity field at the photospheric level in the annular zone is characterized by a lack of upflow motion, probably indicating a suppression of the granulation. Moreover, from the Doppler maps of the Ca ii, it was possible to distinguish at the chromospheric level several elongated structures characterized by downflows and upflows in the inner and outer parts of the annular zone, respectively. The main characteristics of these structures do not vary during the observation time interval, although other important changes are noteworthy. In particular, the sequence of the magnetic field inclination maps shows the presence and evolution of patches characterized by an inclination higher than 135°, located at the external edge of the annular zone. The positions of most of these patches, in the north and southwest parts of the annular zone, correspond to the regions where the penumbra starts to form (see the bottom left panel of Figure 1 in Paper I). The observed patches have a typical size of the order of 1'', with a magnetic flux of the order of 1018 Mx. The location of these patches and their inclination suggest that we interpret them as the footpoints of the magnetic field lines starting from the pore and returning to the photosphere, as Rempel (2011) observed in his magnetohydrodynamic simulations of the fine structure of an already formed penumbra.
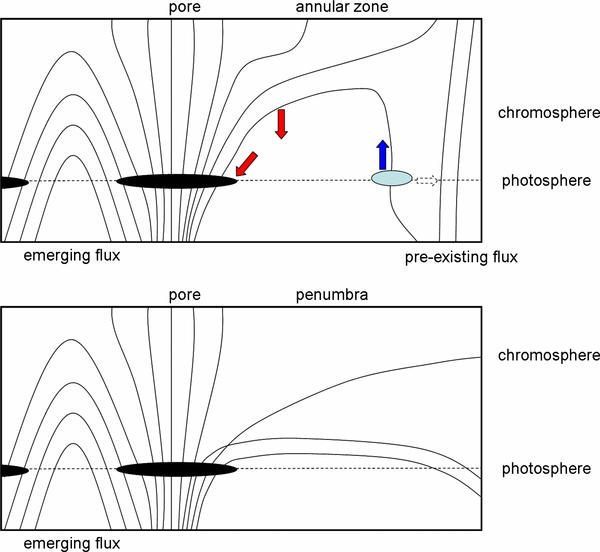
In addition, we found that these patches move radially outward with a velocity of about 1 km s−1, up to 2 km s−1. These displacements can be interpreted as the horizontal displacements of the footpoints of the field lines stretching and lying down on the photosphere. We did not find any variation of the magnetic flux in the pore and in the annular zone during our observation time interval. The most evident evolution in the analyzed FOV regards the patches and their displacements: this fact allows us to argue that in this case the field lines around the pore may become penumbral fields as they coalesce and become more inclined (Leka & Skumanich 1998). Another finding that further supports this scenario is that the patches are located near the regions characterized by the strongest downflow velocities at the chromospheric level in the annular zone. This indicates that the patches may correspond to the footpoints of the field lines of the uncombed configuration that are reclining from the chromosphere to the photosphere. Moreover, during the analyzed time interval, we observed that while the patches move radially outward, the width of the whole annular zone, characterized by a pattern of the LOS velocity different form that of the quiet Sun, increases from 3'' to 5''. We interpreted this evolution as a further signature of the field lines that, going down to the photosphere, modify progressively the photospheric plasma motions and develop the penumbra. A sketch of this process is presented in Figure 4, where the magnetic field lines of the magnetic canopy overlying the pore change their inclination and reach the photosphere. In the top panel of Figure 4, the blue oval represents one of the patches observed in the inclination maps and the dashed arrow indicates its radial outward displacements. The red arrow at the chromospheric level represents the regions characterized by the strongest downflow velocities observed in the Ca ii Doppler maps, while the arrows at the photospheric level describe the velocity field observed from the SIR inversion of the Fe i line observations. The uncombed configuration of the magnetic field after the penumbra formation is represented in the bottom panel of Figure 4.
Figure 4. Sketch of the magnetic field configuration before (top panel) and after (bottom panel) the penumbra formation. The colored arrows indicate the prevalent motions observed at the photospheric and chromospheric levels, while the dashed arrow indicates the radially outward displacement of the patches (blue oval).
Download figure:
Standard image High-resolution image
However, it is worth noting that in the SDO/AIA images, we did not observe any brightenings that could be interpreted as signatures of some reconnection process causing a magnetic reconfiguration and a variation of the field line inclination. Therefore, the mechanism that pushes down the magnetic field lines from the overlying atmospheric layers to the photosphere remains unclear and should be further investigated, from both a theoretical and observational point of view, for a more complete understanding of the penumbra formation process.
An additional result obtained from the analysis of the whole data set is the persistent photospheric plasma upflow observed at the same location of the patches and represented by the blue arrows in Figure 4. The combination of this result with the velocities of the inner part of the annular zone, already described in Paper I (see their Figure 4) and indicated by the red arrows in Figure 4, may be interpreted as the signature of an inflow from the edge of the annular zone to the pore. In fact, taking into account the field line curvature deduced from the inclination maps and the downflow velocities observed near the pore edge, a plausible interpretation is that the plasma is flowing inward prior to the formation of the penumbra, which only later transforms into the Evershed outflows. This interpretation is in agreement with the observations discussed by Schlichenmaier et al. (2012) and Bellot Rubio et al. (2008), supporting the point that the early stages of penumbral formation and the late stages of decay are sometimes associated with a counter-Evershed flow.
The authors thank the DST staff for its support during the observing campaigns. The research leading to these results has received funding from the European Commission's Seventh Framework Programme under the grant agreements eHEROES (project No. 284461) and SOLARNET (project No. 312495). This work was also supported by the Istituto Nazionale di Astrofisica (PRIN INAF 2010), and by the Università degli Studi di Catania. The National Solar Observatory is operated by the Association of Universities for Research in Astronomy, Inc. (AURA), for the National Science Foundation.
Facilities: Dunn (IBIS) - Dunn Solar Telescope, SDO (HMI, AIA) - Solar Dynamics Observatory