


ABSTRACT
We examine the spatial distribution of C2, C3, and NH radicals in the coma of comet Encke in order to understand their abundances and distributions in the coma. The observations were obtained from 2003 October 22–24, using the 2.7 m telescope at McDonald Observatory. Building on our original study of CN and OH, we have used our modified version of the vectorial model, which treats the coma as one large cone, in order to reproduce Encke's highly aspherical and asymmetric coma. Our results suggest that NH can be explained by the photodissociation of NH2, assuming that NH2 is produced rapidly from NH3 in the innermost coma. Our modeling of C2 and C3 suggests a multi-generational photodissociation process may be required for their production. Using the results of our previous study, we also obtain abundance ratios with respect to OH and CN. Overall, we find that Encke exhibits typical carbon-chain abundances, and the results are consistent with other studies of comet Encke.
Export citation and abstract BibTeX RIS
1. INTRODUCTION
Studies of comet chemistry are important for learning more about the conditions in which they formed. Cometary nuclei are known to contain many C–H–O and N-bearing volatiles that suggest formation in the outer solar system and thus provide constraints on models of solar system formation (Bockelée-Morvan et al. 2004). Among the current goals in cometary chemistry today is identifying the similarities and differences between the chemistry of comets and the chemistry of the interstellar medium in order to determine what fraction of observed phenomena in comets are primordial versus evolutionary in nature. Furthermore, multiple efforts to complete the chemical taxonomy of comets using both native (Mumma & Charnley 2011) and fragment species (A'Hearn et al. 1995; Fink 2009; Langland-Shula & Smith 2011; Cochran et al. 2012a) have been undertaken in order to solidify the connection between cometary properties and the processes involved in solar system formation.
One important aspect of the studies of cometary versus interstellar chemistry is the nature of nitrogen chemistry in comets, for which evidence suggests that it is depleted with respect to solar values in comets (Wyckoff et al. 1991; Iro et al. 2003). One of the most important nitrogen-bearing species in comets is NH3. It is thought to be the grandparent of the NH radical, which is observed spectroscopically at 3345–3375 Å, the A3Πi − X3Σ− transition (Cochran 1986). Although relatively few studies have been done on high-resolution spectra of NH in comets, evidence suggests that NH3 photodissociates relatively quickly upon release from the nucleus to form NH2, which in turn photodissociates to NH (Meier et al. 1998; Guineva & Werner 2007). This is further supported by the similarities in measured production rates of NH2 and NH (Cochran et al. 2012a). NH was first positively identified by Swings et al. (1941) in the spectra of comet C/1940 R2 (Cunningham), providing sufficient spectral resolution to observe the Swings effect. Since then, the A3Πi − X3Σ− transition has been identified in the spectra of many other comets and is used to gauge the production of NH3, owing to the difficulty of measuring directly the spectral transitions of NH3 itself (Kawakita & Watanabe 2002; Hatchell et al. 2005).
Carbon-bearing species in comets are also valuable for studies of cometary origins. In the compilations of results from optical spectroscopy (Cochran et al. 2012a) and narrowband photometry (A'Hearn et al. 1995), significant fractions of the Jupiter family of comets and a subset of the nearly isotropic comets exhibit depletions of C2 and/or C3 with respect to the larger sampled comet population. It is thought that the observed radicals C2 and C3 come from one or more larger native hydrocarbons. Observations of the Swan Bands of C2, with bandheads at 4800 Å and 5165 Å, have been made for many comets due to their prominence in optical spectra. Likewise, the Comet Head Group of C3 ( ) has bands spanning the wavelength range of 3440–4100 Å and is also regularly observed in comet spectra. However, the molecular parentage of both C2 and C3 is still uncertain. C2 often exhibits a flat (constant) distribution in the inner comae of many comets (Combi & Fink 1997), and the likely photochemical parents of C3, such as C3H4, have yet to be detected in comet spectra (Feldman et al. 2004).
Comet Encke, a Jupiter family comet with an orbital period of only 3.3 yr, is an ideal comet for studying the relationship of radicals to their photodissociative parent molecules due to its extremely low dust content: Q(Afρ)/Q(OH) = 4.27 × 10⁻²⁷ (A'Hearn et al. 1984, 1995). However, Encke's prominent sunward-facing fan, which is visible on nearly every recorded apparition since 1896 (Sekanina 1988a, 1988b), renders the traditional free expansion models (which assume a spherical coma) impractical for studies of the spatial distribution of gases in its coma (Ihalawela et al. 2011). Continuing with our original line of study, we have used the model described in Ihalawela et al. (2011) to once again examine Encke's coma. It is a modified version of the vectorial model of Festou (1981) that has been altered to treat the coma as one large cone whose base is pointed toward the Sun, and we have already used it to successfully reproduce the spatial distribution of CN and OH. Here, we finish this investigation by examining the spatial distribution of C2, C3, and NH.
2. OBSERVATIONS
Comet Encke was observed on 2003 October 22–24 with the 2.7 m telescope at McDonald Observatory. At the time of observations, comet Encke was 1.40 AU from the Sun and 0.45 AU from Earth. The wavelengths in our spectra ranged from 3000 to 5600 Å, with a resolving power of 500. The 150 arcsec × 2 arcsec slit was oriented in several different position angles over the comet nucleus for each night of observations, allowing us to sample two position angles simultaneously (each 180° opposite each other). Each night, six to seven position angle orientations were sampled, and two 1800s observations were made in each of these orientations. Reduction of the spectra began with bias correction, flat fielding, and flux calibration, followed by removal of the sky spectrum and the (weak) solar continuum. Integrated fluxes were then converted into column densities using g-factors for C2, C3, OH, NH, and CN, all of which have transitions falling in the sampled wavelength range. More details about these observations are described in Ihalawela et al. (2011), which details the results of our CN and OH observations.
We have discussed in detail the sources of uncertainties in the data reduction and analysis of the long-slit spectra in Cochran et al. (2012a; therein referred to as LCS). In this paper, we have reduced the observations in a similar manner but use different model parameters (and model) so the systematics of errors in the scale lengths do not apply. Each column density at individual positions is affected by the signal-to-noise ratio of the data, our ability to identify and remove the continuum, and the noise relative to the strength of the band. Thus, CN, which is a very strong band and quite distinct from the continuum, has relatively accurate column densities. Small errors in continuum placement are unimportant to the overall column density. OH is similar in strength to CN, but errors in the extinction removal can cause problems due to the proximity of the OH transition to the atmospheric extinction window (3080 Å). C3 and C2 are moderate-strength bands spread over a large range in wavelength. For these bands, continuum placement is more of an issue, as is deciding what constitutes the band and what is continuum. The weak features of NH have decidedly larger errors due to several factors. First, continuum placement can have a substantial impact on the band measurement. Also, noise affects them more severely since the bands are weak compared with continuum. NH further suffers from the increasing extinction and decreasing detector response at its very blue wavelength. Therefore, near the optocenter, we estimate that the CN uncertainties are 5%, C2, C3, and OH are 8%, and NH are 10%–15%. However, since the data discussed in this paper are long-slit spectra, the errors in individual data points do not change the fits significantly because there are so many data points constraining each fit, as we showed with Monte Carlo simulations in Cochran et al. (2012a).
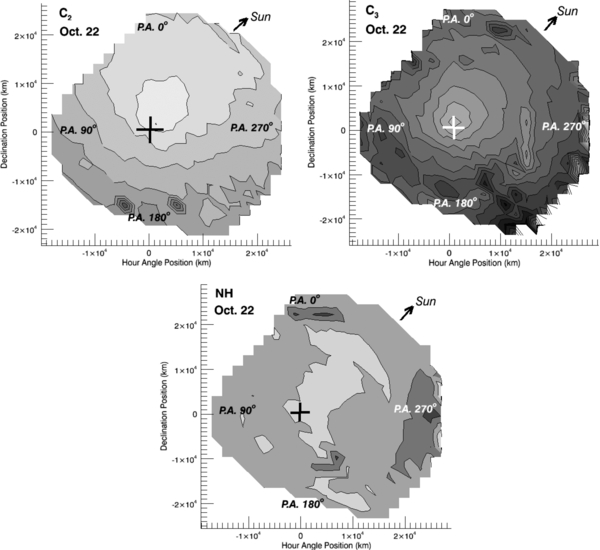
Using the position data along the slit and the column densities for C2, C3, and NH that we derived from our data, we assembled crude contour maps of their spatial distributions in Encke's coma. These contour maps are shown in Figure 1. The sunward-facing fan can be seen for position angles greater than 270°. Based on observations from previous apparitions, the origin of the fan is subsolar, and its axis is oriented along the comet-sun line at position angle 330°, with an uncertainty of 5% due to non-sampling of all 360° of coma. Although the solar vector is oriented to the upper right (position angle 330°) in the images, the solar vector also has a significant component pointed out of the page toward the reader (63°). Thus, the line of sight is close to, but not exactly, down the axis of the fan. The large fan was also visible in the CN and OH maps from our previous study.
Download figure:
Standard image High-resolution image
Figure 1. Maps of the spatial distributions of C2, C3, and NH in the coma of comet Encke, derived from long-slit spectra obtained on 2003 October 22–24. In all images, lighter shades indicate higher column densities (given as log cm−2), the optocenter is indicated by the cross, the solar vector is shown, and the position angles of 0°, 90°, 180°, and 270° are indicated. The solar vector is oriented to the upper right (near position angle 330°). However, the solar vector also has a significant component pointed out of the page toward the reader (63°). Thus, the line of sight is close to, but not exactly, down the axis of the fan.
Download figure:
Standard image High-resolution image3. MODEL
The vectorial model of Festou (1981) is useful for studying cometary radicals, particularly for species with scale lengths considerably larger than the collisional radius. However, this model assumes a spherical and symmetrical coma, which makes its use impractical for this study because of Encke's prominent sunward-facing fan, which is easily visible without need for any coma enhancement techniques. Instead, a modified version of this code was used, which was designed for our original study of the CN and OH coma of comet Encke. The primary difference between the original version and our version of the model is the line-of-sight integration routine. While the standard version assumes a spherical coma, our version assumes that the outgassing is essentially within a large cone whose base is oriented sunward. This code is described and tested in Ihalawela et al. (2011). Here, we have employed a version of the code that has been updated to include a more robust determination of the fit quality by calculating the standard deviation between the model and the observational data to determine the best-fit radial profile of the column density.
Prior to our efforts to model Encke's coma, a similar approach was undertaken by Festou & Barale (2000), who modeled the gas coma of Encke during its 1980 apparition by representing the coma as a large sunward-facing cone. Their results suggested that the gas coma can be reproduced from a small active area on the sunward side of the coma within the vicinity of the pole, and they concluded that the outgassing is strictly sunward and essentially confined to the cone shape. The results of our first paper on the CN and OH coma yielded similar conclusions. For the larger position angles, especially those between 270° and 360°, the lines of sight from Earth cut through the thick central region of the sunward-facing cone. For smaller position angles, especially those between 90° and 180°, the lines of sight from Earth essentially graze the cone edge.
The modified vectorial model was applied to our study of the spatial distribution of C2, C3, and NH in Encke's coma. Studies of C2 assume a parent of C2H2, studies of C3 assume a parent of C3H2, and studies of NH assume a parent of NH2. Although the ultimate source of NH is most likely NH3, we assume that NH2 comes directly from the nucleus due to the short lifetime of NH3 (5600 s; Huebner et al. 1992), similar to the approach taken by Meier et al. (1998) in their study of NH in comet Hyakutake (C/1996 B2). Likewise, C3H2 likely comes from C3H4, which is also thought to photodissociate relatively quickly upon release from the nucleus. The basic parameters used in our modified vectorial model are essentially the same as those used in the original vectorial model, except we have added additional parameters for the cone half-angle and line-of-sight geometry from Earth. In the process of comparing our model results to the observed spatial distribution, we tested a range of parent and daughter velocities in 0.10 km s−1 intervals between the extremes of 0.10 km s−1 and 10 km s−1. Furthermore, we re-examined the cone half-angle for each species in 10° increments between 10° and 90°. The values used for the model parameters of our best-fit model results are presented in Table 1.
Table 1. Parameters for the Modified Vectorial Model
| Parameter | Valuea |
|---|---|
| Lifetimeb of C2H2 | 1.8 × 10⁶ s |
| Lifetimeb of C2 | 1.1 × 10⁶ s |
| Lifetimec of C3H2 | 5.3 × 10⁵ s |
| Lifetimec of C3 | 5.0 × 10⁴ s |
| Lifetimed of NH2 | 5.3 × 10⁴ s |
| Lifetimed of NH | 1.56 × 10⁵ s |
| Phase angle (Ψ)e | 27° |
| Best-fit parent velocity | 1 km s−1 |
| Best-fit daughter velocity | 1 km s−1 |
| Best-fit cone half angle (Θ)e | 45° |
Notes. aPhoto rates apply to 1 AU. They scale as r−2 elsewhere. bFrom Huebner et al. (1992). cFrom Helbert et al. (2005). dFrom Krasnopolsky & Tkachuk (1991). eDefined in Ihalawela et al. (2011).
Download table as: ASCIITypeset image
Because some of our data sets for NH are fairly noisy, one could question the need to use our modified vectorial model for all of the observed species. However, even with the considerable scatter in our data, the modified approach to the original vectorial model of Festou is justified. In Figure 2, we compare the results of our modified vectorial model with the best-fit result of the original vectorial model for two position angles sampled on 2010 October 22.

Figure 2. Comparison of best-fit model results of the original vectorial model (Festou 1981) and our modified vectorial model (Ihalawela et al. 2011) for two position angles of Encke's NH coma sampled on 2010 October 22. The sunward position angle is shown with positive distances with respect to the nucleus, and the anti-sunward profile is shown with negative distances. Despite the scatter in the data, the original vectorial model produces the wrong shape to reproduce the sunward and anti-sunward profiles. Our modified vectorial model, which assumes that the nucleus is one large sunward-facing cone, generates profile shapes more consistent with the observed radial profiles.
Download figure:
Standard image High-resolution image4. RESULTS AND DISCUSSION
The modified vectorial model was used to obtain best-fit radial profiles of the C2, C3, and NH column densities for each position angle sampled spectroscopically. Here, we discuss our best-fit model profiles for each species along with the corresponding observed column density profiles. For all three species, our best-fit profiles all use a cone half-angle of 45°. This is the same value that we used to generate our best-fit model results in our previous study on CN and OH, suggesting that the outgassed material comes from one specific region on the nucleus.
4.1. C2
Figures 3–5 show our best-fit model profiles along with the observed column density profiles, with respect to distance from the nucleus. The quality of the model fits to the data are quite high for most of the position angles. The primary place where the model deviates most notably from the observed data is in the very innnermost coma for position angles in the range of 300°–360°. This could be due to C2H2 formation over a range of inner-coma distances from a larger hydrocarbon parent, or it could be due to one or more inner-coma structures not easily reproducible within the simplifying assumptions of the model. The quality of the fits to position angles 90°–180° is particularly notable. In contrast to the more sunward-oriented opposing side, the inner coma fit is generally improved. This could be due to sampling a region of the coma where the outflow is more closely matched to the model assumptions and to the possibility that the region of the coma sampled is outside the region over which C2H2 could be formed from a larger hydrocarbon.

Figure 3. Comparison of best-fit model results with our observations of C2 for 2003 October 22, showing the following sampled position angles: (a) 0° and 180°, (b) 30° and 210°, (c) 60° and 240°, (d) 90° and 270°, (e) 120° and 300°, (f) 150° and 330°. For each graph, the position angles containing the fan are plotted with positive distances, while anti-fanward position angles are plotted with negative distances.
Download figure:
Standard image High-resolution image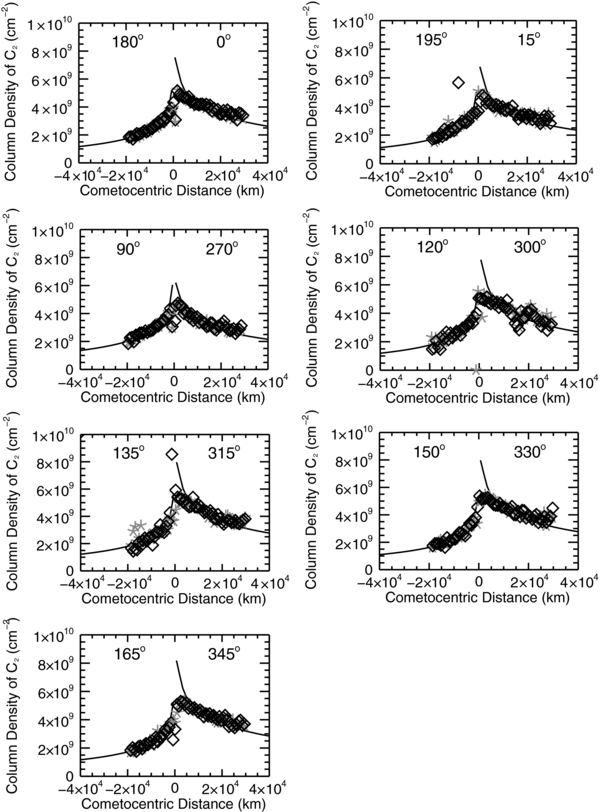
Figure 4. Comparison of best-fit model results with our observations of C2 for 2003 October 23, showing the following sampled position angles: (a) 0° and 180°, (b) 15° and 195°, (c) 90° and 270°, (d) 120° and 300°, (e) 135° and 315°, (f) 150° and 330°, (g) 165° and 345°. For each graph, the position angles containing the fan are plotted with positive distances, while anti-fanward position angles are plotted with negative distances.
Download figure:
Standard image High-resolution image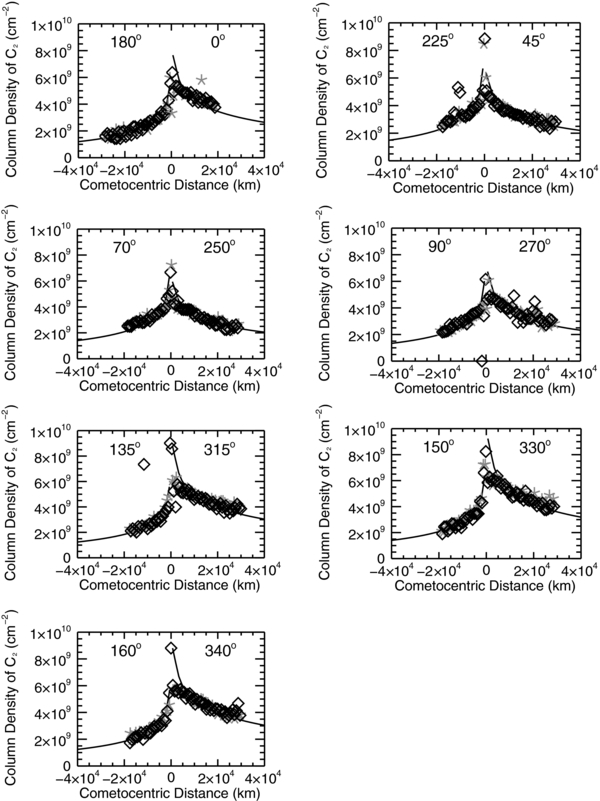
Figure 5. Comparison of best-fit model results with our observations of C2 for 2003 October 24, showing the following position angles: (a) 0° and 180°, (b) 45° and 225°, (c) 70° and 250°, (d) 90° and 270°, (e) 135° and 315°, (f) 150° and 330°, (g) 160° and 340°. For each graph, the position angles containing the fan are plotted with positive distances, while anti-fanward position angles are plotted with negative distances.
Download figure:
Standard image High-resolution image4.2. C3
Figures 6–8 show our best-fit model profiles along with the observed column density profiles, with respect to distance from the nucleus. The quality of the model fits to the data differs considerably among position angles, but they are generally better for lower (more anti-sunward) position angles. Similar to C2, the primary place where the model deviates most notably from the observed data is in the innnermost coma for position angles in the range of 300°–360°. As with C2, this could be due to the C3H2 formation over a range of inner-coma distances from C3H4 or C3H8, and/or one or more inner coma structures. The quality of the fits to position angles 90°–180° is higher and could be due to sampling a region of the coma where the outflow is more closely matched to the model assumptions and to sampling outside the region over which the C3 parent is formed in a complex manner.
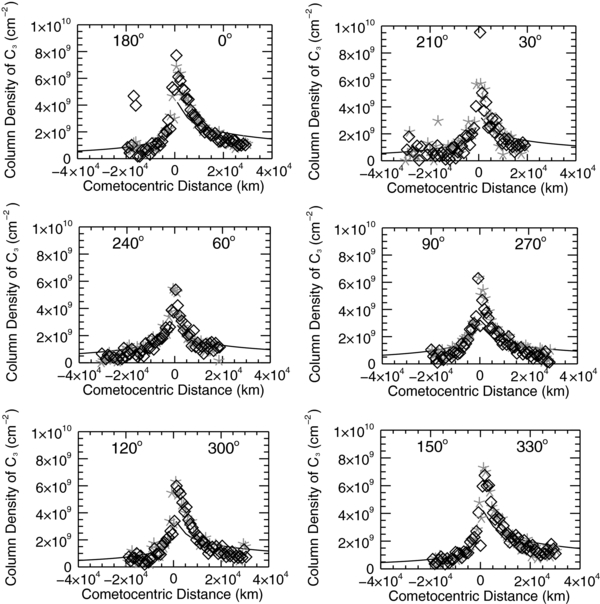
Figure 6. Comparison of best-fit model results with our observations of C3 for 2003 October 22, showing the following sampled position angles: (a) 0° and 180°, (b) 30° and 210°, (c) 60° and 240°, (d) 90° and 270°, (e) 120° and 300°, (f) 150° and 330°. For each graph, the position angles containing the fan are plotted with positive distances, while anti-fanward position angles are plotted with negative distances.
Download figure:
Standard image High-resolution image
Figure 7. Comparison of best-fit model results with our observations of C3 for 2003 October 23, showing the following sampled position angles: (a) 0° and 180°, (b) 15° and 195°, (c) 90° and 270°, (d) 120° and 300°, (e) 135° and 315°, (f) 150° and 330°, (g) 165° and 345°. For each graph, the position angles containing the fan are plotted with positive distances, while anti-fanward position angles are plotted with negative distances.
Download figure:
Standard image High-resolution image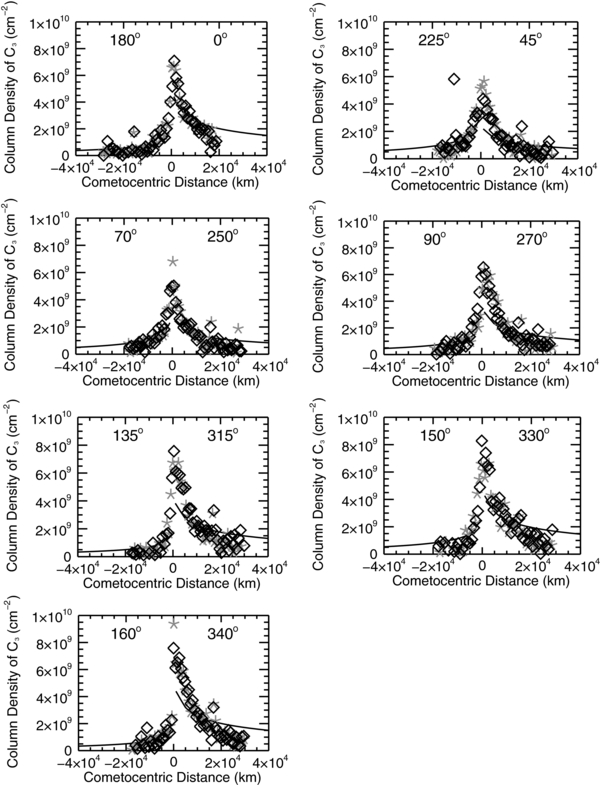
Figure 8. Comparison of best-fit model results with our observations of C3 for 2003 October 24, showing the following position angles: (a) 0° and 180°, (b) 45° and 225°, (c) 70° and 250°, (d) 90° and 270°, (e) 135° and 315°, (f) 150° and 330°, (g) 160° and 340°. For each graph, the position angles containing the fan are plotted with positive distances, while anti-fanward position angles are plotted with negative distances.
Download figure:
Standard image High-resolution image4.3. NH
Figures 9–11 show our best-fit model profiles along with the observed column density profiles, with respect to distance from the nucleus. Within the scatter of our data, our fits are consistent with a sole parent of NH2, using known photodissociation lifetimes and assuming that NH2 is produced very rapidly in the innermost coma. The observed NH/OH ratio drops considerably beyond 50,000 km, further suggesting that our chosen lifetime is appropriate for reproducing the NH profile. Furthermore, our best-fit profiles all use a cone half-angle of 45°. This is the same value that we found in our previous study, and this suggests that there is essentially no heterogeneity in the corresponding active region on the surface.
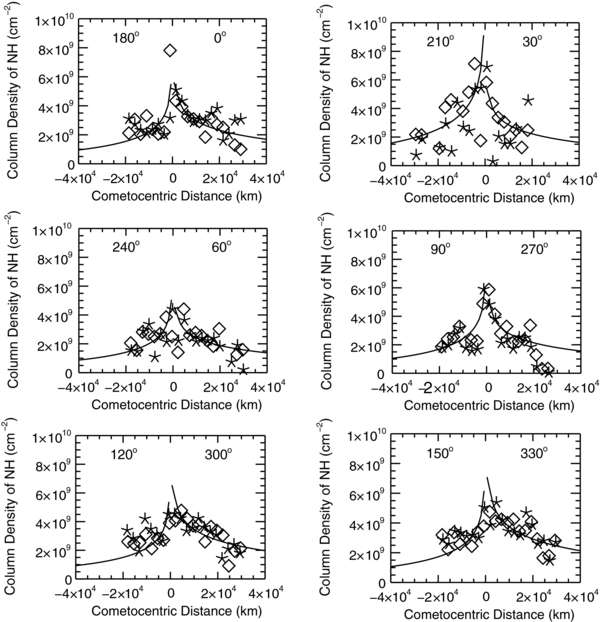
Figure 9. Comparison of best-fit model results with our observations of NH for 2003 October 22, showing the following sampled position angles: (a) 0° and 180°, (b) 30° and 210°, (c) 60° and 240°, (d) 90° and 270°, (e) 120° and 300°, (f) 150° and 330°. For each graph, the position angles containing the fan are plotted with positive distances, while anti-fanward position angles are plotted with negative distances.
Download figure:
Standard image High-resolution image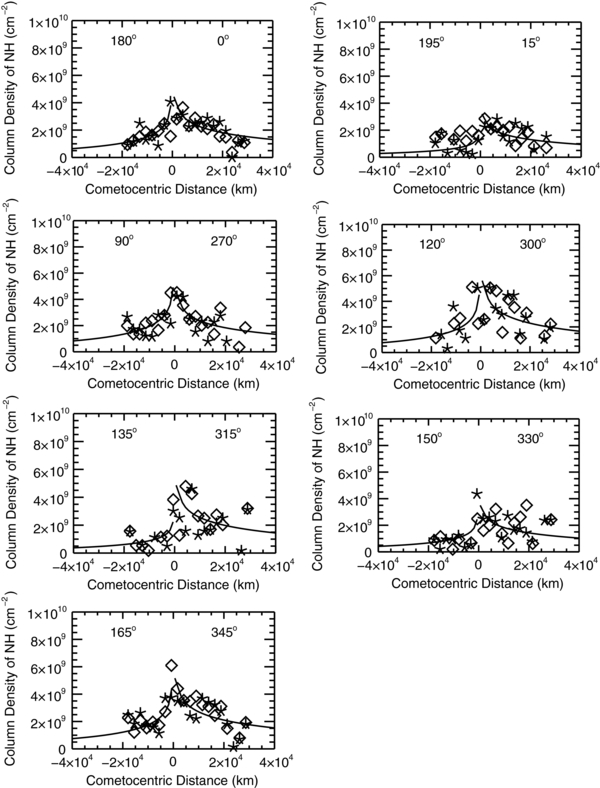
Figure 10. Comparison of best-fit model results with our observations of NH for 2003 October 23, showing the following sampled position angles: (a) 0° and 180°, (b) 15° and 195°, (c) 90° and 270°, (d) 120° and 300°, (e) 135° and 315°, (f) 150° and 330°, (g) 165° and 345°. For each graph, the position angles containing the fan are plotted with positive distances, while anti-fanward position angles are plotted with negative distances.
Download figure:
Standard image High-resolution image
Figure 11. Comparison of best-fit model results with our observations of NH for 2003 October 24, showing the following position angles: (a) 0° and 180°, (b) 45° and 225°, (c) 70° and 250°, (d) 90° and 270°, (e) 135° and 315°, (f) 150° and 330°, (g) 160° and 340°. For each graph, the position angles containing the fan are plotted with positive distances, while anti-fanward position angles are plotted with negative distances.
Download figure:
Standard image High-resolution image
4.4. Comparison with Other Comets
Because our model assumes a conic coma, we must perform our model fits to individual position angles in the coma, and the production rate as assumed by the original vectorial code does not have the same meaning in our model (the production rate assumes uniform outgassing over the entire surface to generate a spherical coma). However, if we take what the model considers to be the production rate needed to obtain the best-fit profile with our modified code and divide it by the corresponding production rate needed to generate the OH profile for the same position angle, the constraints on the production rates should cancel in the ratio, allowing us to obtain abundance ratios along each position angle, which can in turn be averaged to yield overall abundance ratios for Encke. We have taken this approach to obtain the values presented in Table 2.
Table 2. Comparison of Abundance Ratios with Results from Studies of Comet Encke
| Ratio | A'Hearn et al. (1995) | Cochran et al. (2012a) | This Study |
|---|---|---|---|
| NH/OH | 0.0035 | 0.0048 | 0.0055 ± 0.0015 |
| NH/CN | 0.380 | 1.74 | 0.55 ± 0.17 |
| C2/OH | 0.0035 | 0.0041 | 0.0058 ± 0.0015 |
| C2/CN | 0.871 | 1.48 | 0.587 ± 0.107 |
| C3/OH | 0.0005 | 0.0007 | 0.0031 ± 0.0011 |
| C3/CN | 0.045 | 0.24 | 0.311 ± 0.041 |
Download table as: ASCIITypeset image
In general, our model reproduces the observed radial profiles under the assumption that the observed species are strictly produced by the photodissociation of larger species. Furthermore, our derived ratios are consistent with survey results of Jupiter family comets presented elsewhere. Table 2 shows our results as compared to observations of Encke conducted in other surveys. It should be noted that the survey results of A'Hearn et al. (1995) and Cochran et al. (2012a) yield somewhat different results from each other, as well as our study. This could be due to different activity levels at different apparitions and observation times, or it could be due to differences in observation technique (narrowband photometry versus long-slit spectral observations). Differences between our results and the other survey results may also be affected by the somewhat higher value and large error bar we reported for the CN/OH abundance ratio in our previous study (0.009 ± 0.004). Furthermore, A'Hearn et al. report a value of NH/OH in comet Encke of 0.003, a factor of two lower than the value we derive here. If we consider our assumption that all NH2 comes from NH3, we can also deduce that the mixing ratio of NH3 with respect to H2O is about 0.6%, which is consistent with the values reported for comets Hyakutake (0.5%; Palmer et al. 1996; Bockelée-Morvan 1997) and Hale–Bopp (0.7%; Bird et al. 1999), as well as the global value for comets of 0.5% as reported by Kawakita & Watanabe (2002). The abundance ratios of C2 and C3 that we derive suggest that Encke is "typical" among comets in terms of carbon abundance. This is consistent with the results of the previous findings of A'Hearn et al. (1995) and Cochran et al. (2012a).
Variations in the abundance ratios we obtained for individual position angles, which contribute to our error bars, could be due to several factors. First, there could have been non-radial outflow in the coma, which is not easily reproduced in our model (parents are forced to flow radially outward from the nucleus). Furthermore, long-slit spectra do not sample the entire coma simultaneously, and the morphology of the coma could have changed significantly over the course of a single night of observations due to the rotation of the nucleus, thus impacting our results, particularly the results for sampled position angles inside the fan. Previous studies of Encke's rotation period by Fernández et al. (2005), Woodney et al. (2007), and Lowry & Weissman (2008) suggest that Encke's rotation period is ∼11 hr. One night of our observations occurred over approximately 8 hr—nearly three-quarters of the derived rotation period. To get around this issue in future studies, we have started observing the comae of several comets with the George and Cynthia Mitchell Spectrograph (née VIRUS-P; Hill et al. 2008), an integral-field fiber optic spectrograph allowing us to sample the entire coma simultaneously for multiple species. The comets that we have observed with this instrument to date all display various degrees of asymmetry in their comae, and these observations could serve as an excellent future test of the robustness of our model.
5. CONCLUSIONS
Our modified vectorial model was used to examine the spatial distribution of C2, C3, and NH in comet Encke. Our model reproduces the spatial distribution of NH and reproduces most of the C2 and C3 spatial distributions. The abundance ratios we derive from our best-fit profiles are consistent with values reported from other studies of comet Encke and suggest that Encke is typical in terms of carbon abundance. Our ability to reproduce the spatial distributions of various species in Encke's coma serves as a further test of our modified vectorial model, suggesting that it can be used to model the spatial distribution of many radicals produced photochemically in aspherical and asymmetric cometary comae.
Future work on radical species in comets will include studying the spatial distribution of other radicals, including carbon- and nitrogen-bearing species of other comets with varying degrees of coma asymmetry that we have observed spectroscopically (Cochran et al. 2012a, 2012b) using the new integral-field unit spectrograph at McDonald Observatory (Hill et al. 2008).
We wish to thank the referee for valuable feedback, which helped us improve the quality of this paper. This research was supported by NASA's Planetary Astronomy program grant NNXG04G162G and predecessor grants, as well as the Office of the Vice President for Research and Economic Development at Mississippi State University. This paper includes data taken at the McDonald Observatory of the University of Texas at Austin.