


ABSTRACT
The 782 nm band of CO2, in a transparent window of Earth's atmosphere, was the first CO2 band observed 80 yr ago in the spectra of Venus. The band is very weak and therefore not saturated by the thick atmosphere of Venus, but its spectral parameters are still very limited due to the difficulty of detecting it in the laboratory. It is the highest overtone (ν1 + 5ν3) of CO2 given in widely used spectroscopy databases such as HITRAN and GEISA. In the present work, the band is studied using a cavity ring-down spectrometer with ultra-high sensitivity as well as high precision. The positions of 55 lines in the band were determined with an absolute accuracy of 3 × 10⁻⁵ cm−1, two orders of magnitude better than previous studies. The line intensities, self-induced pressure broadening coefficients, and the shift coefficients were also derived from the recorded spectra. The obtained spectral parameters can be applied to model the spectra of the CO2-rich atmospheres of planets like Venus and Mars.
Export citation and abstract BibTeX RIS
1. INTRODUCTION
Carbon dioxide is a major component in the atmospheres of the Earth-like planets Mars and Venus. It is also present in the atmospheres of other planets. Carbon dioxide has many vibrational bands with very different intensities throughout the infrared, which makes CO2 an important tracer for probing atmospheres to different depths. The band at 782 nm was the first CO2 band observed in the spectrum of Venus (Adams & Dunham 1932). The band has a moderate strength, thus it can be easily detected but not saturated due to the absorption of the CO2-dominated atmosphere of Venus. It also sits in a transparent window of Earth's atmosphere and can therefore be detected with ground-based instruments. The band was later confirmed to be the ν1 + 5ν3 band of CO2 by Adel & Slipher (1934), and then used to determine the temperature and CO2 abundance in the atmosphere of the planet (Adel 1937; Chamberlain & Kuiper 1956; Spinrad 1962; Young 1972). For the atmosphere of Mars, which has a lower CO2 density, a stronger band (5ν3) at 870 nm was used to retrieve the abundance and temperature of CO2 in the Martian atmosphere (Spinrad et al. 1966). Mandin (1977) analyzed a large number of CO2 lines in the 3900–10,000 cm−1 region using a spectrum of the solar light that penetrated the atmosphere of Venus.
High-accuracy spectroscopic parameters, including but not limited to positions, intensities, pressure-induced shifts, and broadening coefficients, are needed to achieve deeper insights from the high-quality spectra recorded by many satellite-based instruments from recent Mars Express, Venus Express, and Cassini-Huygens missions. In particular, the line parameters of numerous CO2 bands, including the very weak ones, are essential in extracting more accurate information on the very dense atmosphere of Venus (Pollack et al. 1993; Drossart et al. 2007).
In the latest versions of the HITRAN (Rothman et al. 2009) and GEISA (Jacquinet-Husson et al. 2011) databases, which are the most widely used in spectroscopic studies of terrestrial and planetary atmospheres, over 400,000 rovibrational CO2 lines in the 5–12,784 cm−1 range are included. The 782 nm band is the highest overtone of CO2 given in the databases. However, accurate line parameters, which can only be obtained from laboratory measurements, are still quite limited, particularly for weak bands. This fact is mainly due to the insufficient path lengths achieved in the laboratory. Herzberg & Herzberg (1953) conducted intensive spectroscopic studies of the overtones of CO2 using absorption path lengths of up to 5500 m. With the development of high sensitivity laser spectroscopy techniques, the ν1 + 5ν3 and 2ν2 + 5ν3 Fermi-resonating bands were studied using photoacoustic spectroscopy (Yang et al. 1993), diode laser absorption (Lucchesini & Gozzini 2005), intra-cavity laser absorption (Campargue et al. 1994, 1999), and cavity ring-down spectroscopy (Song et al. 2011). However, the accuracy of the reported rovibrational parameters remains limited.
Here we present a quantitative study of the well known 782 nm band of the main isotopologue of CO2, 12C16O2, using a cavity ring-down spectrometer with high precision as well as high sensitivity. This spectrometer has been previously used to determine the spectroscopic parameters of the extremely weak electric quadrupole band of H2 near 0.8 μm (Hu et al. 2012). High-precision, line-by-line parameters are retrieved from the recorded spectra; the uncertainty in the absolute line positions, referenced to precise atomic transitions, is reduced to 3 × 10⁻⁵ cm−1. This value represents two orders of magnitudes in improvement over previous studies (Campargue et al. 1999; Song et al. 2011). The strength, self-induced pressure shift, and broadening coefficients of each line are reported with a statistical relative uncertainty of 0.3% on average. The precise spectral parameters of the CO2 lines in this spectral window will be useful for quantitative studies of CO2-rich planetary atmospheres.
2. EXPERIMENTAL
The ν1 + 5ν3 band of 12C16O2 in the spectral range of 782–789 nm was measured at room temperature (296 ± 1 K). Carbon dioxide gas with a stated purity of 99.99% was bought from the Nanjing Special Gas Co. and further purified by a "freeze-pump-thaw" process before use. The sample pressure was measured with a capacitance gauge (MKS 627B; full range 1000 torr) with a stated accuracy of 0.12%.
The details of the cavity ring-down spectrometer have been presented elsewhere (Gao et al. 2010; Cheng et al. 2012). In brief, the spectrometer is composed of a continuous-wave Ti:Sapphire, a 1.4 m ring-down cavity, and a thermo-stabilized Fabry-Pérot interferometer (FPI) used for calibration. The ring-down cavity has two mirrors (Los Gatos Inc.) with a reflectivity of 99.995%. The length of the cavity is periodically modulated by a piezoelectric actuator to match the cavity mode to the laser frequency. The laser is run in a step-scan mode and on each step typically about 100 ring-down events are recorded. The decay time, τ, of each ring-down event is derived from a fit of the recorded signal to an exponential decay function. The absorption coefficient, α, can be derived from the equation
where c is the speed of light, ν is the laser frequency, and τ and τ0 are the decay times of the cavity with and without a sample, respectively. The minimum detectable (noise-equivalent) absorption coefficient αmin was about 2 × 10⁻⁵ km−1. The ultra-high sensitivity allows the detection of weak CO2 transitions using moderate sample pressures (50–300 torr in this study). For illustration, the spectra of the P(16) line at 783.79 nm recorded at different sample pressures are shown in Figure 1(a).
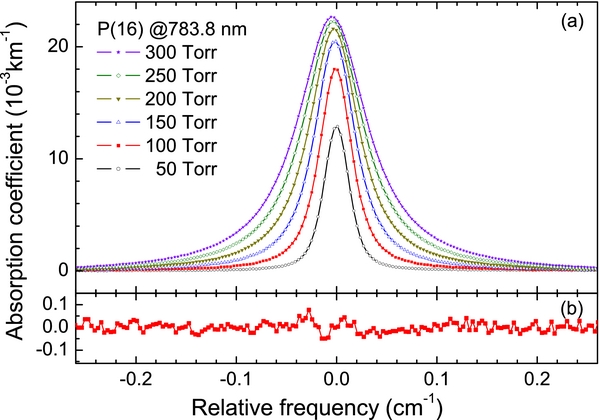
Figure 1. (a) P(16) line at 12758.485 cm−1 of the ν1 + 5ν3 band recorded with CO2 samples of 50, 100, 150, 200, 250, and 300 torr. (b) Fitting residuals of the spectrum (100 torr) using a GP function.
Download figure:
Standard image High-resolution imagePrecise calibration is accomplished using the longitudinal modes of the thermo-stabilized FPI made of ultra-low expansion (ULE) glass. The transmittance peaks of the ULE-FPI, with an interval of 1497.029 MHz, have been precisely determined using Rb transitions at 780 nm and 795 nm. The uncertainty of the absolute frequencies of the ULE-FPI peaks has been estimated to be 0.1–0.6 MHz in the 775–800 nm region and the long-term frequency drift is below 0.1 MHz (Cheng et al. 2012). Using the ULE-FPI peaks, the laser frequency can be calibrated with an accuracy better than 0.7 MHz (2 × 10⁻⁵ cm−1).
3. RESULTS AND DISCUSSION
In total, 55 lines in the 12,683–12,784 cm−1 range were recorded. Different line profiles, including the conventional Voigt profile (with a fixed or free Gaussian width), a "soft" collisional Galatry profile (GP; Galatry 1961), and a "hard" collisional Rautian profile (Rautian & Sobelman 1967), have been applied to fit the recorded spectrum. The GP gives the best fit. For illustration, Figure 1(b) shows the fitting residuals of the P(16) line recorded at 100 torr. These results agree with the conclusions of the study of the  band of CO2 by Casa et al. (2009). Long et al. (2011) concluded that the speed-dependent Nelkin–Ghatak profile (SDNGP; Nelkin & Ghatak 1964; Lance et al. 1997) gives the best fit of air-broadened CO2 lines in the pressure range of 6.7–33 kPa. These authors also addressed the fact that the line parameters, including the areas and the Lorentzian widths obtained from fitting using the GP, are very similar to those obtained from fitting the same spectrum using the SDNGP. In this case, we adopt here the GP in the line-by-line fitting of the recorded spectrum. The Gaussian width was fixed at the calculated Doppler broadening width value, while other line parameters, including the position, intensity, Lorentzian width (half-width at half-maximum), and Dicke narrowing coefficients, were derived from the fit.
The line parameters obtained for the recorded 55 lines in the ν1 + 5ν3 band of 12C16O2 are given in Table 1. The statistical uncertainties obtained from the fits are also given. The line positions listed in Table 1 are the values at the zero-pressure limit derived from a linear fit of the line centers at different sample pressures. For unblended lines, the uncertainty on the line positions is estimated to be 3 × 10⁻⁵ cm−1, consisting of the statistical uncertainty (2 × 10⁻⁵ cm−1) and the calibration uncertainty (2 × 10⁻⁵ cm−1). Blended lines are marked with an asterisk in Table 1. It should be noted that there can be systematic deviations in the parameters of the blended lines due to the spectral overlapping, as large as several times the given statistical uncertainties. For the heavily overlapped R(22), R(24), and R(26) lines, the pressure-induced line shifts and broadening coefficients cannot be well determined from the fits due to strong correlations; these values are therefore not listed in Table 1.
Table 1. Lines of the ν1 + 5ν3 Band of 12C16O2
| Position, νobs | Δa | S b | δc | γd | Position, νobs | Δa | S b | δc | γd | |||
|---|---|---|---|---|---|---|---|---|---|---|---|---|
| P(2) | 12773.13713 | 6 | 0.638(2) | −8.80(9) | 0.1194(5) | R(0) | 12775.47855 | −5 | 0.318(1) | −7.50(16) | 0.1243(7) | |
| P(4) | 12771.41958 | 9 | 1.233(3) | −9.76(12) | 0.1149(3) | R(2) | 12776.88264 | 4 | 0.958(2) | −8.60(10) | 0.1154(3) | |
| P(6) | 12769.57685 | 1 | 1.788(4) | −10.79(8) | 0.1123(2) | R(4) | 12778.16147 | 3 | 1.559(8) | −9.66(12) | 0.1142(5) | |
| P(8) | 12767.60878 | 4 | 2.243(6) | −11.44(6) | 0.1096(2) | R(6) | 12779.31496 | −3 | 2.037(12) | −10.78(11) | 0.1072(7) | |
| P(10) | 12765.51557 | 2 | 2.591(7) | −11.76(8) | 0.1073(2) | R(8) | 12780.34296 | 4 | 2.484(20) | −11.52(9) | 0.1052(8) | |
| P(12) | 12763.29736* | −12 | 2.924(3) | −13.70(8) | 0.1060(2) | R(10) | 12781.24571 | −3 | 2.870(15) | −12.50(7) | 0.1049(5) | |
| P(14) | 12760.95389 | −6 | 3.053(7) | −13.60(6) | 0.1039(1) | R(12) | 12782.02301 | 0 | 3.050(16) | −13.21(10) | 0.1010(3) | |
| P(16) | 12758.48543 | 0 | 3.120(4) | −13.57(4) | 0.1028(1) | R(14) | 12782.67499 | 3 | 3.210(16) | −13.40(10) | 0.1000(4) | |
| P(18) | 12755.89229* | −16 | 3.029(8) | −14.11(6) | 0.1016(1) | R(16) | 12783.20171 | 2 | 3.320(12) | −13.82(11) | 0.1003(2) | |
| P(20) | 12753.17423* | −20 | 2.913(4) | −14.54(7) | 0.1004(10) | R(18) | 12783.60318 | −1 | 3.290(7) | −14.20(11) | 0.0996(3) | |
| P(22) | 12750.33133 | −13 | 2.704(6) | −14.80(5) | 0.0982(3) | R(20) | 12783.87947 | −7 | 3.211(8) | −14.34(10) | 0.0982(2) | |
| P(24) | 12747.36393* | −17 | 2.472(3) | −15.23(6) | 0.0975(1) | R(22) | 12784.03313* | −265 | 3.163 | ... | ... | |
| P(26) | 12744.27197 | −12 | 2.201(5) | −15.39(9) | 0.0955(1) | R(24) | 12784.05702* | −56 | 2.238 | ... | ... | |
| P(28) | 12741.05580* | −24 | 1.917(7) | −15.88(12) | 0.0936(4) | R(26) | 12783.95660* | 83 | 2.317 | ... | ... | |
| P(30) | 12737.71508 | −5 | 1.626(10) | −16.52(7) | 0.0894(6) | R(28) | 12783.73344 | 1 | 2.151(8) | −15.58(15) | 0.0947(3) | |
| P(32) | 12734.25050 | −9 | 1.378(4) | −16.55(6) | 0.0906(5) | R(30) | 12783.38457 | 5 | 1.770(5) | −16.14(13) | 0.0918(5) | |
| P(34) | 12730.66192 | −9 | 1.131(2) | −17.27(7) | 0.0879(2) | R(32) | 12782.91095 | 8 | 1.436(9) | −17.12(12) | 0.0882(6) | |
| P(36) | 12726.94940 | 6 | 0.896(2) | −17.13(8) | 0.0854(2) | R(34) | 12782.31273 | 6 | 1.123(12) | −17.90(18) | 0.0834(11) | |
| P(38) | 12723.11350 | −4 | 0.716(2) | −18.27(4) | 0.0842(3) | R(36) | 12781.58984* | 17 | 1.029(23) | −18.19(18) | 0.0936(21) | |
| P(40) | 12719.15399 | 0 | 0.562(2) | −18.65(8) | 0.0844(4) | R(38) | 12780.74259* | 21 | 0.719(10) | −18.25(17) | 0.0815(12) | |
| P(42) | 12715.07116 | 9 | 0.419(2) | −19.10(12) | 0.0807(4) | R(40) | 12779.77121 | 10 | 0.552(13) | −19.45(14) | 0.0793(25) | |
| P(44) | 12710.86539 | 3 | 0.314(1) | −19.71(6) | 0.0793(4) | R(42) | 12778.67548* | 18 | 0.431(3) | −19.85(14) | 0.0801(9) | |
| P(46) | 12706.53649* | 19 | 0.239(9) | −19.43(13) | 0.0819(6) | R(44) | 12777.45592 | 9 | 0.365(8) | −20.51(18) | 0.0899(19) | |
| P(48) | 12702.08518* | 8 | 0.173(1) | −19.65(29) | 0.0787(10) | R(46) | 12776.11250 | 0 | 0.251(2) | −20.85(19) | 0.0752(6) | |
| P(50) | 12697.51149 | −13 | 0.118(1) | −21.12(24) | 0.0748(11) | R(48) | 12774.64532 | −3 | 0.174(1) | −21.20(16) | 0.0764(6) | |
| P(52) | 12692.81229* | 290 | 0.054(1) | −14.73(41) | 0.0862(20) | R(50) | 12773.05464* | −6 | 0.134(1) | −20.45(30) | 0.0821(7) | |
| P(54) | 12687.99859* | −159 | 0.102(1) | −19.84(42) | 0.0821(13) | R(52) | 12771.34060* | −8 | 0.099(2) | −19.77(61) | 0.0831(15) | |
| P(56) | 12683.05777* | −69 | 0.037(1) | −21.18(47) | 0.0705(27) |
Notes. Values in parentheses are the statistical deviations (1σ). Lines marked with "*" are blended lines and have not been included in the fit of the energies. aDifference between the calculated and observed line position, Δ = νcalc − νobs, in 10−5 cm−1. bLine strength at 296 K, in 10−27cm molecule−1. cSelf-induced pressure shift coefficient at 296 K, in 10−3 cm−1 atm−1. dSelf-induced pressure broadening coefficient at 296 K, in cm−1 atm−1.
Download table as: ASCIITypeset image
The upper vibrational eigenstate of the band is mainly the (1005)1 normal mode state using the notation ( , where Vi (i = 1–3) is the respective vibrational quantum number, ℓ is the corresponding vibrational angular momentum, and r is the ranking number of the vibrational state within the Fermi-resonance polyad. The rotational energies of the (1005)1 vibrational state can be interpreted with the usual energy level formula:

where Gv is the vibrational term and Bv, Dv, and Hv are the rotational and centrifugal distortion constants, respectively. The rovibrational constants can be derived from a fit of the line positions given in Table 1. The lower ground state rotational constants were constrained to their literature values (Miller & Brown 2004) in the fit. The upper state rovibrational constants obtained in this work are given in Table 2. For comparison, the literature values (Campargue et al. 1999; Song et al. 2011) are also given in the same table. The difference between the experimental and calculated line positions is given in Table 1. Note that the blended lines have not been included in the fit.
Table 2. Rovibrational Constants of the ν1 + 5ν3 Band of 12C16O2 (in cm−1)
| V | Gv | B | D × 106 | H × 1012 | rmsa | Reference |
|---|---|---|---|---|---|---|
| (0000)1 | 0.0 | 0.390218949(36) | 0.1334088(186) | 0.01918(250) | 0.044 | Miller & Brown (2004) |
| (1005)1 | 12774.72961(17) | 0.37454991(35) | 0.11249(13) | 0.0 | 0.66 | Song et al. (2011) |
| (1005)1 | 12774.729397(18) | 0.374550915(48) | 0.112905(23) | 0.074(13) | 0.066 | This work |
Notes. Values in parentheses are 1σ standard deviations at the last quoted digit. aRoot mean square deviation, in 10−3 cm−1.
Download table as: ASCIITypeset image
The deviation between the calculated and experimental line positions (rms value 6.6 × 10⁻⁵ cm−1) is larger than the experimental uncertainty (3 × 10⁻⁵ cm−1). This result indicates that some of the rotational levels may be shifted due to rovibrational interactions. The uncertainty of the ground state rotational energies, which were calculated from the spectroscopic parameters with an rms deviation of 4.4 × 10⁻⁵ cm−1 (Miller & Brown 2004), also contributed to the uncertainties of the upper state energies.
Figure 2 shows the self-induced pressure broadening widths and pressure shifts of the P(16) line observed at different molecular densities. The linear fits give the line position at the zero-pressure limit (shown as 0 in the figure), the pressure shift coefficient, and the pressure broadening coefficient, respectively. The coefficients obtained are given in Table 1 and shown in Figure 3. The self-induced pressure broadening coefficients are in the range of 0.08–0.12 cm−1 atm−1 and the pressure shift coefficients vary from −0.009 cm−1 atm−1 to −0.02 cm−1 atm−1. In comparison with the 2ν1 + ν3 and 3ν1 + ν3 polyads studied by Toth et al. (2006), the pressure broadening coefficients are close, but the pressure shift coefficients given here are about three times larger. This finding agrees with the results shown by Toth et al. (2006) in that the self-induced pressure broadening coefficients have little vibrational dependence, while the pressure shift coefficients have an apparent dependence on the upper vibrational states.

Figure 2. Observed self-induced pressure shifts (open circles) and pressure broadening widths (solid squares) of the P(16) line at different CO2 molecular densities. The lower panel shows the deviations (multiplied by a factor of 100) from the linear fits.
Download figure:
Standard image High-resolution image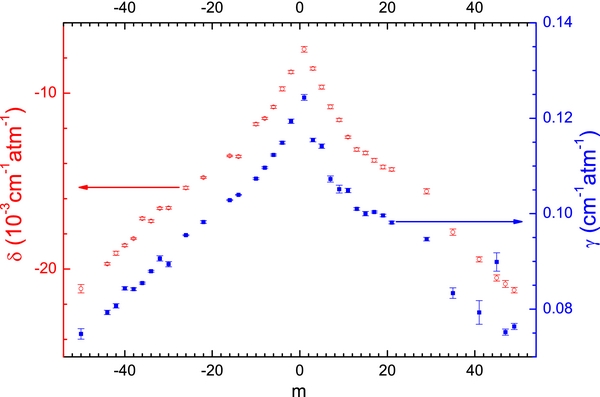
Figure 3. Self-induced pressure broadening coefficients (solid squares) and pressure shift coefficients (open circles) of the (1005)1–(0000)1 band of CO2 (296 K). m = −J for P(J) lines and m = J + 1 for R(J) lines.
Download figure:
Standard image High-resolution image
The Dicke narrowing parameters can also be derived from fits of the spectrum, but these parameters are not physically reasonable. The narrowing parameter β can also be calculated by the diffusion theory from the equation (Lepère 2004):
where kB is the Boltzmann constant, T is the temperature, m is the molecular mass, c is the speed of light, and D is the mass-diffusion coefficient of CO2, which can be found in the study by Boushehri et al. (1987). As for the P(16) line, the ratio between the values obtained from the fitting and the calculated ones varies from 1.3 to 2.7 when the pressure increases from 50 torr to 300 torr. Such a discrepancy agrees with that observed in the study of the  band of CO2 by Casa et al. (2009). As a comparison, we refit the spectrum of the P(16) line using the GP but with β fixed at the values calculated from Equation (3). The obtained line parameters are only slightly different from those given in Table 1: a −0.9% difference in the line strength and a −0.5% difference in the pressure-induced Lorentzian width. As for the line position (and therefore the pressure-induced shift coefficient), the difference is much smaller than the statistical uncertainty and is taken to be negligible. These results provide an estimation of the upper limit of the possible deviation on the obtained line parameters if the GP is insufficient to model the line shape of CO2.
Although the GP can fit the spectra obtained in this study well, more general profiles (Hartmann et al. 2013; Ngo et al. 2013) may be needed to model the spectra with better accuracy. However, the excellent linearity of the line positions and the Lorentzian widths with pressure in the region of 50–300 torr indicates that the respective coefficients are not affected much by the narrowing and the speed-dependent effects due to collisions. We have also measured the spectra of a few CO2 lines at a pressure of 760 torr. Analysis of the spectra shows that the linearity still holds well; the deviations are within the uncertainties given in Table 1. Noting that a pressure of 1 atm can be already regarded as "high pressure" since the Lorentzian width is almost one order of magnitude larger than the Doppler width, which implies that the parameters obtained in this work can be applied to simulate the spectrum of CO2 at higher pressures.
4. SUMMARY
The spectra of 55 lines in the (1005)1–(0000)1 band of 12C16O2 near 782 nm were recorded with a cavity ring-down spectrometer calibrated by precise atomic transitions. The line positions were determined to an accuracy of 3 × 10⁻⁵ cm−1 (2 × 10⁻⁵ cm−1 statistical and 2 × 10⁻⁵ cm−1 systematic). The line strengths, self-induced pressure broadening coefficients, and the shift coefficients were determined with relative uncertainties <1% for unblended lines. The uncertainty budget consists of the statistical uncertainty (given in Table 1), a 0.3% uncertainty from the measurements of pressure and temperature, and a possible deviation of less than 1% due to improper profiles applied to model the line shape. Taking into account that the band is in a transparent window of Earth's atmosphere, the spectral parameters obtained here can be used to model the atmospheres of Venus and Mars using spectroscopy data from both satellite-based and ground-based observations.
This work is jointly supported by the NSFC (21225314, 91221304, 20903085), the NBRPC (2013CB834602), and the FRFCU.