


ABSTRACT
We present results derived from the first multi-chord stellar occultations by the transneptunian object (50000) Quaoar, observed on 2011 May 4 and 2012 February 17, and from a single-chord occultation observed on 2012 October 15. If the timing of the five chords obtained in 2011 were correct, then Quaoar would possess topographic features (crater or mountain) that would be too large for a body of this mass. An alternative model consists in applying time shifts to some chords to account for possible timing errors. Satisfactory elliptical fits to the chords are then possible, yielding an equivalent radius Requiv = 555 ± 2.5 km and geometric visual albedo pV = 0.109 ± 0.007. Assuming that Quaoar is a Maclaurin spheroid with an indeterminate polar aspect angle, we derive a true oblateness of , an equatorial radius of km, and a density of 1.99 ± 0.46 g cm−3. The orientation of our preferred solution in the plane of the sky implies that Quaoar's satellite Weywot cannot have an equatorial orbit. Finally, we detect no global atmosphere around Quaoar, considering a pressure upper limit of about 20 nbar for a pure methane atmosphere.


1. INTRODUCTION
Since the discovery of (15760) 1992 QB1 (Jewitt & Luu 1993), about 1260 transneptunian objects (TNOs) have been discovered. Determining their physical and dynamical properties is key to understanding the origin and evolution of our solar system. They were possibly formed closer to the Sun (near the present Uranus's and Neptune's orbits), and displaced to their current location through gravitational perturbations during the migration of the giant planets (Gomes et al. 2005).
Their physical characteristics provide information about the primordial protoplanetary nebula. Moreover, the inferred chemical, thermal, and collisional processes that they underwent tell us something about the evolution of the outer solar system. Due to their large heliocentric distances, our knowledge about their sizes, shapes, albedo, densities, and atmospheres remains fragmentary (Stansberry et al. 2008).
Stellar occultations allow accurate determinations of those parameters. They provide sizes and shapes with accuracies that may reach the kilometer level, and detect atmospheres with a sensitivity of a few nanobars in surface pressure. Unfortunately, they are difficult to predict. To overcome this obstacle, we have undertaken systematic searches of stars that may be occulted by 10 of the largest TNOs, using the 2.2 m telescope of the European Southern Observatory (ESO) at La Silla (Assafin et al. 2010, 2012).
The first successful observation of a stellar occultation by a TNO (besides Pluto and Charon) was the 2009 October 9 occultation by 2002 TX300 (Elliot et al. 2010). Since then, the following objects have been measured by stellar occultations: Varuna (2010 February 19; Sicardy et al. 2010), the dwarf planet Eris (2010 November 6; Sicardy et al. 2011), 2003 AZ84 (2011 January 8; Braga-Ribas et al. 2011), Quaoar (2011 February 11; Person et al. 2011), the dwarf planet Makemake (2011 April 23; Ortiz et al. 2012), Quaoar (2011 May 4; 2012 February 17 and 2012 October 15, this paper), 2003 AZ84 (2012 February 3; Braga-Ribas et al. 2012), and 2002 KX14 (2012 April 24; Alvarez-Candal et al. 2012). More recently, our group and collaborators successfully predicted and detected occultations by Varuna (2013 January 8) and Sedna (2013 January 13), whose analyses are in progress.
The 2011 February 11 Quaoar occultation provided a single chord (Person et al. 2011), which only allowed the authors to put a lower limit to Quaoar's size. The first multi-chord stellar occultation by Quaoar was observed on 2011 May 4 (Figure 1), and is the main topic of this paper. The 2012 February 17 event provided two chords that complement the 2011 May 4 event, but it does not provide further constraints on Quaoar's shape as discussed herein. Finally, the 2012 October 15 event provided a single chord, hence preventing size determination, as briefly commented at the end of this paper.

Figure 1. Post-occultation reconstruction of Quaoar's shadow path on Earth for the 2011 May 4 event. The shadow moves from right to left; the red stars on the centerline are separated by 1 minute. The bigger red star symbol is the closest geocentric approach at 01:38:37 UT. The green dots are the sites where the occultation was detected. The blue dots are the sites that had obtained data but did not detect the event, and the white ones are the sites that were clouded out (Table 1).
Download figure:
Standard image High-resolution imageThe TNO (50000) Quaoar (also known as 2002 LM60) was discovered by Brown & Trujillo (2004) in 2002 June. Its diameter was estimated to be 1260 ± 190 km from direct Hubble Space Telescope (HST) imaging (Brown & Trujillo 2004). The Spitzer and new HST yielded a smaller diameter of about 850–890 km (Stansberry et al. 2008; Fraser & Brown 2010). With a semimajor axis of 43.51 AU, an orbital period of 287 yr, an orbital eccentricity of 0.035, and an inclination of 7 98, it is a classical object. Quaoar has a small moon, Weywot, which was discovered in 2007 (Brown & Suer 2007). Its orbital motion provides Quaoar's mass (Vachier et al. 2012; Fraser et al. 2013).
Quaoar has retained water ice in crystalline and amorphous phases, and volatiles such as methane on its surface (Jewitt & Luu 2004; Schaller & Brown 2007b). More tentative detections of ethane and molecular nitrogen are also reported (Guilbert et al. 2009; Dalle Ore et al. 2009). As such, and due to its size and mass, Quaoar might retain a tenuous atmosphere.
In this paper, we present results derived from the 2011 May 4 stellar occultation by Quaoar. Section 2 describes our prediction method and briefly presents the observations. Data analysis is described in Section 3. Quaoar's size and shape are discussed in Section 4, and their physical implications are presented in Section 5. In Section 6, we give upper limits for the pressure of possible atmospheres. Further constraints (search for satellites and brief comments on the 2012 February 17 and 2012 October 15 occultations) are given in Section 7, before concluding remarks in Section 8.
2. PREDICTIONS AND OBSERVATIONS
The 2011 May 4 occultation was identified in a systematic search for TNO occultation candidate stars, made at the 2.2 m telescope of ESO, using the Wide Field Imager (WFI). This yields local astrometric catalogs for 10 large TNOs for the period 2008–2015, and for stars with magnitudes as faint as R = 19. Further details can be found in Assafin et al. (2010, 2012).
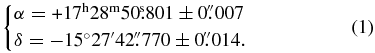
Astrometric updates were performed with several telescopes a few weeks before the event at Pic du Midi (1 m telescope), La Silla (TRAPPIST 0.6 m telescope; Jehin et al. 2011), San Pedro de Atacama (ASH2 0.4 m telescope), and Pico dos Dias (0.6 m telescope). On the last few nights prior to the occultation, both Quaoar and the star were observed in the same field of view. This reduced the effects of systematic errors from the reference catalog. In practice, the accuracy of the positions of the object relative to target star is then limited by the determination of the photocenters. This can be achieved with an accuracy of the order of 20 mas, or about half of Quaoar's angular diameter. Those updates confirmed that Quaoar's shadow would cross the southern part of South America. The occulted star, UCAC2 26257103, has a magnitude R = 15.8, and a compilation of our measurements provides the following ICRF/J2000 star position:
An alert was triggered at several potential sites, resulting in data collected with a large diversity of instruments (Table 1). Out of 16 stations distributed in Chile, Uruguay, Argentina, and Brazil, 13 could acquire data, and 6 of them obtained a positive detection of the occultation. Moreover, two stations, Salto/Uruguay and Pico dos Dias/Brazil, were close enough to the shadow to constrain Quaoar's size even though they did not detect the event (Figures 1 and 2).

Figure 2. Left panel: the six occultation light curves normalized to the unocculted star+Quaoar flux and vertically shifted by an integer value for better viewing. The solid black lines are the best fit of the square-well model to the data. The red lines and circles are the square-well model convoluted with the Fresnel diffraction, the star diameter, and the applied exposure time. The mid-times of the occultations do not coincide due to the propagation delays of the shadow due to the distinct longitudes of the sites (Figure 1). Right panel: all the observed chords showing the region around Quaoar covered by our observations. The red segments are the 1σ error bars on each occultation chord extremity, derived from the corresponding error bars on the occultation times (Table 1). The middle of each chord is marked with a red dot. East is right, north is up; the arrow shows the direction of the body motion, so the ingress at the right and egress at the left. No secondary occultation is observed, as could be caused by a satellite.
Download figure:
Standard image High-resolution imageTable 1. Circumstances of Observation for All Observing Stations
| Site | Longitude | Telescope | Exposure | Result | Observer |
|---|---|---|---|---|---|
| Latitude | Aperture | Readout Overhead | Ingress | ||
| Altitude | Camera | S/N | Egress | Note | |
| Brasília/BRA | 47° 54' 41'' W | 8.0 s | |||
| 15° 53' 29'' S | 0.254 m | 2.0 s | Clouds | P. Cacella | |
| 1072 m | |||||
| Belo Horizonte | 43° 59' 51'' W | 6.0 s | C. Jacques | ||
| CEAMIG-REA/BRA | 19° 49' 49'' S | 0.30 m | 3.0 s | No occ. | E. Pimentel |
| 825 m | 21 | B. Giacchini | |||
| Pico dos Dias-Brasópolis/BRA | 45° 43' 58'' W | B & C | ⋅⋅⋅ | Instrument | V. Magalhães |
| 22° 32' 08'' S | 0.60 m | ⋅⋅⋅ | problems | C. Montaña | |
| 1864 m | Andor/Ixon | C. Rodrigues | |||
| Pico dos Dias-Brasópolis/BRA | 45° 43' 58'' W | Carl Zeiss | 0.95 s | No occ. | M. Assafin |
| 22° 32' 08'' S | 0.60 m | 1.05 s | Start 2:26:10a | L. Almeida | |
| 1864 m | Andor/Ixon | 85 | End 2:58:20a | Thin clouds | |
| São José | 45° 51' 44'' W | C11 | 7.5 s | ||
| dos Campos-INPE/BRA | 23° 12' 33'' S | 0.275 m | 2 s | Humidity | A. Milone |
| 617m | SBIG ST7XE | ||||
| Ponta Grossa-UEPG/BRA | 50° 05' 56'' W | RCX 400 | 14 s | Positive | M. Emilio |
| 25° 05' 22'' S | 0.40 m | 4.25 s | 2:41:47.2 ± 2.7 | C. Neves | |
| 909 m | SBIG STL6E | 20 | 2:42:42.1 ± 3.1 | Filter = V | |
| Florianópolis-UFSC/BRA | 48° 31' 21'' W | CM-1100 | 10 s | Positive | W. Schoenell |
| 27° 36' 12'' S | 0.254 m | 2.75 s | 2:41:28.7 ± 3.6 | A. Amorim | |
| 20 m | SBIG ST7 | 12 | 2:42:31.9 ± 3.8 | Humidity | |
| San Pedro de | 68° 10' 48'' W | Harlingten | 3.0 s | Positive | Remotely |
| Atacama/CHL | 22° 57' 12'' S | 0.5 m | 1.1 s | 2:42:33.1 ± 0.13 | operated |
| 2397 m | Apogee U42 | 52 | 2:43:31.4 ± 0.15 | by N. Morales | |
| San Pedro de | 68° 10' 48'' W | ASH2 | 9.0 s | Positive | Remotely |
| Atacama/CHL | 22° 57' 12'' S | 0.4 m | 7.1 s | 2:42:32.5 ± 1.0 | operated |
| 2397 m | SBIG STL1100 | 22 | 2:43:30.3 ± 4.3 | by N. Morales | |
| Armazones/CHL | 70° 11' 46'' W | OCA | 7.0 s | Positive | E. Unda-Sanzana |
| 24° 35' 52'' S | 0.84 m | 2.4 s | 2:42:41.5 ± 1.2 | J.P. Colque | |
| 2706 m | SBIG STL6E | 42 | 2:43:26.3 ± 1.8 | ||
| Rivera/URY | 55° 36' 00'' W | LX200 | 4.0 s | Positive | S. Roland |
| 30° 51' 48'' S | 0.305 m | 2.3 s | 2:41:58.2 ± 0.4 | L. Almenares | |
| 200 m | SBIG ST7 | 26 | 2:42:32.5 ± 0.4 | A. Bergengrue | |
| Salto-OLASU/URY | 57° 58' 43'' W | LX200 | 4.0 s | No occ. | S. Bruzzone |
| 31° 23' 33'' S | 0.305 m | 2.7 s | Start 2:20:29a | ||
| 37 m | QSI 516wsg | 18 | End 2:54:04a | ||
| La Silla/CHL | 70° 44' 22'' W | TRAPPIST | 6.0 s | Remotely | |
| 29° 15' 17'' S | 0.60 m | 1.55 s | No occ. | operated | |
| 2315 m | 50 | by E. Jehin | |||
| Los Molinos | 56° 11' 25'' W | 4.0 s | R. Salvo | ||
| OALM/URY | 34° 45' 19'' S | 0.35 m | 1.0 s | No occ. | M. Martinez |
| 80 m | 10 | J. Capeche | |||
| CASLEO/ARG | 69° 17' 45'' W | J. Sahade | 6.0 s | ||
| 31° 47' 56'' S | 2.15 m | 4.5 s | No occ. | R. Gil-Hutton | |
| 2492 m | 250 | ||||
| Santa Martina/CHL | 70° 32' 04'' W | 1.0 s | R. Leiva | ||
| 33° 16' 09'' S | 0.40 m | 0.0 s | No occ. | L. Vanzi | |
| 1450 m | 4 | I. Toledo |
Notes. For the sites that detected the event (or were very close to it), the ingress and egress times are given in UT with the 1σ level error bars. aTime of the start/end of observations.
Download table as: ASCIITypeset image
3. ANALYSIS
3.1. Occultation Light Curves
All light curves were normalized to the unocculted star flux by applying a linear or second-degree polynomial fit to the observed flux before and after the event. The resulting light curves are shown in Figure 2. The mid-exposure time of each frame was extracted from the image headers. Only four stations (out of the six that detected the event) have an internal accuracy of a few hundredths of a second: Harlingten and ASH2 (at San Pedro de Atacama), Armazones, and UEPG. On the other two sites, only the integer part of the second is available due to the acquisition software used. In order to retrieve the fraction of a second, a linear fit was performed to the set of points (i, ti), where i is the image number and ti is the corresponding header time. This allowed us to retrieve the time of each image with relative accuracies of about 0.05 s. All sites except one set up their clocks using robust internet servers for time synchronization, and absolute errors larger than 1 s are not expected (Deeths & Brunette 2001). The exception is the Rivera station, where the computer clock was manually set up 1 hr before the event by looking at a Global Positioning System (GPS) display due to the lack of internet access. This point is discussed further in Section 4.3.
3.2. Occultation Timing
The start and end times of the occultation were obtained for each light curve by fitting a sharp edge occultation model. This model is convolved by Fresnel diffraction, the CCD bandwidth, the stellar diameter in kilometers, and the finite integration time; see Widemann et al. (2009).
The Fresnel scale () for the present Quaoar's geocentric distance D = 42.4 AU =6.34 × 10⁹ km is 1.4 km for a typical wavelength of λ = 0.65 μm. The star diameter is estimated using the formulae of van Belle (1999). Its B, V, and K apparent magnitudes are 16.5, 15.8, and 12.8, respectively, in the NOMAD catalog (Zacharias et al. 2004). This yields a diameter of about 0.5 km projected at Quaoar's distance. The smallest integration time used in the positive observations was 3 s, which translates to almost 55 km in the celestial plane. Therefore, the occultation light curves are largely dominated by the integration times, not by Fresnel diffraction or star diameter.
The occultation fits consist in minimizing a classical χ2 function for each light curve, as described in Sicardy et al. (2011; Section S3). The free parameter to adjust is the ingress (disappearance) or egress (re-appearance) time tocc, which provides the minimum value of χ2, denoted as .

The best fits to the occultation light curves are shown in Figure 2, and the derived occultation times are listed in Table 1. The error bars are not necessarily symmetric due to the presence of gaps (caused by readout time intervals) between images. No information is gathered during those gaps, causing local plateaux in the χ2 function, and hence asymmetric error bars.
3.3. Limb Fitting
The occultation times provide the chords shown in Figure 2. The most general shape for Quaoar's limb that we considered here is an ellipse characterized by five adjustable parameters: the coordinates of the body center, relative to the star in the plane of the sky (fc, gc); the apparent semimajor axis a'; the apparent oblateness  ' = (a' − b')/a' (where b' is the apparent semiminor axis); and the position angle P of the semiminor axis b'. The quantities fc and gc, expressed in kilometers, are positive toward the local celestial east and north, respectively. They are calculated using the JPL#21 Quaoar's ephemeris (Giorgini et al. 1997) at each site, and the star position is given in Equation (1). The position angle P is counted positively from the direction of local celestial north to celestial east.
The six positive observations provide N = 12 chord extremities, whose positions are denoted as fi, obs, gi, obs. Among the six chords, two were obtained at San Pedro de Atacama with the Harlingten and ASH2 telescopes. Although consistent with the Harlingten results, the ASH2 timing has significantly higher error bars due to longer exposure time (Table 1), so that we kept only N = 10 independent points along the limb and M = 5 free parameters to be adjusted. The elliptical fit to the N = 10 chord extremities is found by minimizing the relevant χ2 function (see, for instance, Sicardy et al. 2011). In that case, the value of χ2 per degree of freedom (or unbiased χ2) is given by .

As discussed later, in the hypothesis of hydrostatic equilibrium and in the small angular momentum regime, the apparent oblateness ' is the result of the projection of an oblate Maclaurin spheroid with semi-axes a = b > c, where a and c are the true equatorial and polar radii, respectively.29 The true oblateness = 1 − (c/a) is then related to the apparent oblateness through

where ζ is the angle between the polar c-axis and the line of sight. We will call this quantity the "polar aspect angle," with ζ = 0 (resp. ζ = 90°) corresponding to the pole-on (resp. equator-on) geometry.
To explore the parameter space, we have fitted the chord extremities with ellipses, imposing prescribed values of the position angle P and oblateness '. We have then varied P between 0° and 180° by steps of 3°, and ' from 0 to 0.5 by steps of 0.004. For each pair of prescribed values (P, '), we have adjusted and stored the parameters a', fc, gc, and the resulting χ2. This allowed us to construct two-dimensional colored maps (see Figures 4 and 5), where the χ2 value is shown as a function of oblateness ' and apparent equivalent radius (instead of a'). This quantity is defined by , and is the radius of the disk that has the same area as that enclosed by the apparent limb. The 1σ error bars on Requiv and are obtained by varying χ2 from its minimum value to .


We note that the colored points are confined inside a V-shaped boundary. This is because the longest occultation chords impose that a' be larger than some value L, which is close to the lengths of those longest chords. Also, those chords are roughly aligned with the longer axis of the fitted ellipse (Figure 4), which imposes that b' be smaller than ∼L. Thus, we must have , corresponding to the V-shaped domain seen in Figures 4 and 5. The value of L depends on the particular model considered to fit the chords, and varies in a range from about 500 to 680 km; see the next section.

4. QUAOAR'S SHAPE
It is expected that objects with diameters on the order of 1000 km or more have reached the hydrostatic equilibrium, assuming Maclaurin spheroidal or Jacobi ellipsoidal shapes (Chandrasekhar 1987). The critical diameter to reach equilibrium can be determined under some assumptions, as shown in Tancredi & Favre (2008). Nevertheless, the formation scenario and collisional history of individual objects are not known, so that we cannot discard solutions that diverge somewhat from the equilibrium figure. We examine here possible ranges of sizes and oblateness for Quaoar, making various extreme assumptions.
As seen in Figures 2 and 3, the chords provide a shape that has a significant departure from the ellipse. We consider two extreme possibilities here: (1) all the timings are correct, implying that Quaoar possesses significant topographic features (craters or mountains), a result that is not expected for such a big object (Section 4.2), or (2) Quaoar is a spheroid in hydrostatic equilibrium (a Maclaurin object), which implies that there were timing problems at some stations (Section 4.3). We now discuss these two possibilities and their implications.

Figure 3. Nominal solution. The best elliptical fit to the occultation chords, using the timings of Table 1. The elliptical limb model does not satisfactorily fit the observed data. The sites that detected the event are indicated as UEPG: Ponta Grossa; UFSC: Florianópolis; SPA: San Pedro de Atacama; ARM: Armazones; RIV: Rivera.
Download figure:
Standard image High-resolution image4.1. Nominal Solution
The nominal solution uses the ingress and egress occultation times at face value, and fits an elliptical shape to the chord extremities, accounting for the 1σ error bar of each of them; see Figure 3. The best fit returns a best value = 9.1, clearly indicating that an overall elliptical limb shape is not satisfactory. This is obvious from Figure 3, and at this point it is meaningless to interpret the physical parameters derived from this fit and to discuss their error bars. We thus examine possible extreme solutions in which Quaoar has large topographic features, i.e., a deep crater or a high mountain.

4.2. Large Topographic Features
The first solution we examine is the crater solution. It consists of an overall oblate object from which a part has been excavated; see Figure 4. An elliptical limb shape is again fitted to the chord extremities, except for the San Pedro de Atacama egress point, so that we now have N = 9 data points to fit. This solution provides the most elongated shape of all those obtained in this work. It has a position angle P = 21°, an apparent oblateness ' = 0.29, an equivalent radius of Requiv = 557 km, and (and ), better than the nominal solution, but still indicating significant departures from the model. This can be seen by the large radial residual of about −200 km at the San Pedro de Atacama station; see Figure 4.


Figure 4. Crater solution. Left: a two-dimensional map of χ2 obtained from various apparent oblateness ' and equivalent radius Requiv in the crater case (see Section 3.3 for details). The darker regions correspond to better solutions (smaller χ2). The value of χ2 is coded not only in colors (see the vertical bar at the right of the panel), but also in size: the larger the value of χ2, the smaller the dot. Right: the best fit for the crater solution, where the San Pedro de Atacama egress point (left) has been discarded from the fit. It has P = 21°, ' = 0.29, and Requiv = 557 km.
Download figure:
Standard image High-resolution imageThe limit Dc to the diameter of a possible crater on an icy (resp. rocky) body, without shattering it, is Dc, icy ∼ 1.2R (resp. Dc, rocky ∼ 1.6R), where R is the radius of the body (Leliwa-Kopystyński et al. 2008). So, considering the derived equivalent radius, the largest possible crater has a diameter of about Dc, icy ∼ 670 km (Dc, rocky ∼ 890 km). In the right panel of Figure 4, the depression related to the San Pedro de Atacama chord has a diameter of about 430 km. However, Leliwa-Kopystyński et al. (2008) give a maximum value of 0.25 for the ratio depth/diameter of a crater in case of an H2O–ice body, and 0.3 for a CO2–ice body (and 0.26 for a rocky body). Thus, the 430 km crater yields a maximum depth of about 110–130 km, depending on composition. But, the depression in Figure 4 has a depth of roughly 200 km, about 45% of the crater diameter. Consequently, such a crater appears to be too deep, unless Quaoar has unexpected cohesion properties.
Another solution consists of a less oblate object, but with an important prominence on its eastern limb (Figure 5). To obtain this solution, which will be referred to as the mountain solution, we have discarded the egress extremity of Rivera, the southernmost positive chord. So, again we have N = 9 data points to fit. The elliptical fit has a position angle of 7°, an oblateness of 0.138, an equivalent radius of 525 km, and a (), indicating a fit quality comparable to the crater solution.


Figure 5. Mountain solution. The same as in Figure 4, but for the mountain solution, where the southernmost egress point (from the Rivera station) has been discarded from the fit.
Download figure:
Standard image High-resolution imageThe Rivera egress chord extremity has a residual of more than 140 km, or 24% of the equatorial radius (587 km) obtained here. This can be compared to the much smaller topographic features, ∼20 km at most, expected on an icy body (Johnson & McGetchin 1973). A rocky body could support higher features, about ∼150 km, comparable to the value we obtain here. However, the density of this solution would be around 2 g cm−3 (see Table 3), implying a significant fraction of ice. Thus, the mountain solution seems physically implausible, as the mountain is too big to be sustained at Quaoar surface.
4.3. Maclaurin Solution
Although we do not expect large absolute timing errors at the various stations (Section 3.1), it is difficult to assess timing errors after the fact, as some of the observations are not repeatable. In view of the physically implausible Quaoar shape obtained in the previous section, we now allow for time shifts at each station, except San Pedro de Atacama. For this site, we have two observations with independent and consistent ingress and egress times (Table 1) so that a systematic timing error is not expected for the two corresponding occultation chords.
It is known that, in an ellipse, the midpoint of a set of parallel chords should be aligned, i.e., a straight line must go through all the midpoints of the chords. So, as a first exercise, we slide the various chords shown in Figure 3 along themselves, so as to align the middle of all chords along a line perpendicular to the chords. Thus, a circle is adjusted to the chord extremities with a radius 555 ± 2.5 km and a value .

To estimate the quality of the fit, however, we have to consider that we implicitly added four adjustable parameters to our model (the time shifts of all the chords except San Pedro de Atacama). Besides, we also adjust the radius of the circle Rcirc and the coordinates of its center (fc,gc). So, we have M = 7 parameters to be adjusted to the N = 10 chord extremities, implying a . The fact that the is satisfactory is thus an encouraging argument to proceed in our analysis.


Actually, we may now align the middle of the chords, but along a line which makes an angle α relative to the line perpendicular to the chords. Doing so, we transform the original circle (corresponding to α = 0) into an infinity of possible ellipses parameterized by α, which can vary in principle between −90° and +90°, with the convention that α is increasing from celestial north to celestial east.30 We will denote by β the angle between the long axis of the ellipse and the direction of the chords (with the same sign convention as for α).
Note that since we slide the chords along their own direction, all the ellipses share the same area. Consequently, the radius of the circle Rcirc described before actually gives Quaoar's equivalent radius, Requiv = 555 ± 2.5 km, common to all the ellipses. The next step is to deduce Quaoar's actual shape in space from its apparent elliptical limb.
Quaoar has a small-amplitude rotational light curve with Δm = 0.133 ± 0.028. Its rotation period is 8.8394 ± 0.0002 hr, if it has a single-peaked rotational light curve (Ortiz et al. 2003). The period can be 17.6788 ± 0.0004 hr in case of a double-peaked light curve and can be caused by albedo features, shape effects, or a combination of the two. Quaoar's large size and density suggest a body in hydrostatic equilibrium, i.e., a Maclaurin spheroid. We note that a Jacobi-type equilibrium (Lacerda & Jewitt 2007) is not expected here because a 17.7 hr rotation period would require a very low density smaller than 0.6 g cm−3 and an oblateness larger than 0.42.
Consequently, we will assume from now on that Quaoar is a Maclaurin spheroid of equatorial radius a, polar radius c, and true oblateness , observed with a polar aspect angle ζ and with a rotation period of 8.8394 hr (so that the amplitude of its rotational light curve is entirely due to albedo features). Then, it can be shown from Equation (2) that Quaoar's apparent surface area is , where . Moreover, Quaoar's density is given by ρ = 3M/(4πa2c). Elementary calculations show that


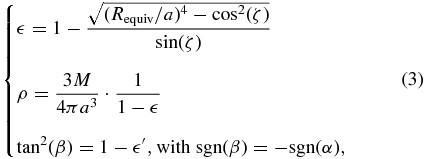
where the apparent oblateness ' is given as a function of the true oblateness by Equation (2). The condition 0 < (1 − )2 < 1 imposes . By varying a inside this allowed interval, the first two equations above yield an infinity of solutions (ρ, ) that fit equally well the occulting chord extremities (after applying the necessary time shift to each chord). These (ρ, ) solutions are shown as blue lines in Figure 6. They define a V-shape domain inside which the actual solution must reside, with the limit corresponding to the equator-on (ζ = 90°) and pole-on (ζ = 0°) geometries.


Figure 6. Red line: the Maclaurin equilibrium curve relating the density and true oblateness (Equation (4)) for a body rotating with a period of 8.8394 hr. Gray segments: the crater and mountain solutions with their 1σ error bars. In this case, the oblateness is actually the apparent oblateness of the limb. Solid blue lines: the relation between ρ and derived from Equations (3). They correspond to spheroids that all have an apparent equivalent radius Requiv = 555 km and a mass M = (1.40 ± 0.21) × 1021 kg (Fraser et al. 2013). In this figure, we plot the true oblateness, which is derived from the apparent oblateness using Equation (2). Since the relationship between density and oblateness also depends on the polar aspect angle ζ, we have plotted the extreme equator-on (ζ = 90°) and pole-on (ζ = 0°) geometries. The dashed lines are obtained by varying Quaoar's mass over its error interval. The spheroid solutions must reside inside the V-shaped blue limits, and the Maclaurin solutions must furthermore be on the intersection with the red line, plotted as the dotted blue segment.
Download figure:
Standard image High-resolution imageThe blue lines are parameterized by Requiv = 555 ± 2.5 km (obtained from our observations) and M = (1.40 ± 0.21) × 1021 kg, derived from Weywot's orbit (Vachier et al. 2012; Fraser et al. 2013). We note that the errors on the position of the V-shaped domain (the dashed blue lines) are dominated by the uncertainties in M, not in Requiv.
The final condition that we impose on the solutions is that they satisfy the Maclaurin equilibrium condition
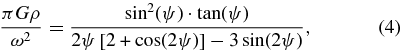
where ω is the spin frequency, G is the constant of gravitation, and cos (ψ) = 1 − (Plummer 1919; Sicardy et al. 2011). Considering the single-peak case (i.e., a rotation period of 8.8394 hr as discussed above), the equation above provides the red curve plotted in Figure 6.
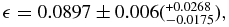
The intersection between the Maclaurin equilibrium curve and the V-shaped domain finally provides Quaoar's true oblateness = 0.0897 ± 0.006 and density ρ = 1.99 ± 0.14 g cm−3, where the error bars come from the indetermination of ζ. Also considering the uncertainty in Quaoar's mass determination (see above), we obtain larger error bars and ρ = 1.99 ± 0.46 g cm−3.

From the oblateness, density, and equivalent radius given above, the second of Equations (3) provides Quaoar's equatorial radius km. The third equation indicates that β must be negative, since α is positive, so β = −441 ± 09 (see the position angle of the centers of the chords in Figure 7). Since the chords are themselves inclined by 125 with respect to the east–west direction, the position angle of Quaoar's north pole projected in the plane of the sky is P = −441 + 125 = −318 ± 09 (or P = 1484 ± 09, as there is an indetermination of 180° on the pole position); see Figure 7. This position angle can be compared with that of Weywot's orbital pole projected in the plane of the sky. The various solutions derived by Vachier et al. (2012) and Fraser et al. (2013) provide a position angle between 5° and 15°. Thus, our best Maclaurin solution rules out an equatorial orbit for Weywot.


Figure 7. Best fit for the Maclaurin solution. It corresponds to the middle point of the blue dotted segment in Figure 6. It has a position angle P = 1484 ± 09, an equivalent radius Requiv = 555 ± 2.5 km, an equatorial radius km, and apparent oblateness . Once projection effects are accounted for, this corresponds to true oblateness = 0.0897 ± 0.006 and density ρ = 1.99 ± 0.14 g cm−3; see the text. To obtain this fit, the chords were shifted as follows (leaving the San Pedro de Atacama timing unchanged), Rivera: −9.1 s; Armazones: −4.6 s; Florianópolis: −2.4 s; and Ponta Grossa: −3.8 s.
Download figure:
Standard image High-resolution imageOnce Requiv is adjusted, Equations (3) and (4) impose the values of a, , and P, leaving only the center position (fc, gc) to be adjusted. Thus, the Maclaurin model requires the adjustment of M = 7 parameters (four time shifts, Requiv, and (fc, gc)). Our preferred fit shown in Figure 7 has . Consequently, we have , indicating that we may be slightly overestimating the error bars on the chord extremities.


This satisfactory limb fitting comes at a price, that of applying time shifts of several seconds to the chords; see the values given in Figure 7. The problem is particularly acute for the Rivera station, where we have to apply a time shift of −9.1 s. However, we note that this is the only site where the computer clock was not systematically corrected by an internet server due to the lack of internet access at that station. It was set up with respect to a GPS display, half an hour before the event. Such a procedure usually provides an accuracy of a fraction of a second. It is impossible to assess the errors after the fact, but, although improbable, we cannot exclude a time drift of the clock during the observation or even that the GPS display may not reflect the actual UTC time due to unknown acquisition problem.
The clocks at the other stations were all connected to an internet time server via Network Time Protocol. We note that the time shifts applied to the Florianópolis and Ponta Grossa chords are within the 1σ level obtained for the fitted occultation times (see Section 3.2), so the shift could be explained by the errors in the occultation timing. Concerning Armazones, the shift is at about the 2.5σ level of the occultation times, a discrepancy that is more difficult to explain. Finally, we assumed that the San Pedro de Atacama timing is the most reliable because it is confirmed by two experiments. But, although unlikely, an identical systematic error for the two experiments cannot be discarded.
It is important to note that we cannot discard intermediate solutions with topographic features still compatible with a Maclaurin body, which would demand smaller time shifts but still bigger than the 1σ level.
5. SUMMARY OF QUAOAR'S PHYSICAL PROPERTIES
We now briefly discuss the various physical parameters derived from our analysis, assuming a Maclaurin shape for Quaoar. Table 2 lists the various parameters of the best fits using each of the models described above, as well as the quality parameter . Table 3 provides some physical parameters derived from those fits.

Table 2. Parameters for the Best Fits Shown in Figures 4, 5, and 7
| Solution | Crater | Mountain | Maclaurin |
|---|---|---|---|
| Semimajor axisa (km) | 656 ± 12 | 568 ± 12 | |
| Oblatenessa | 0.29 ± 0.04 | 0.14 ± 0.05 | |
| fc (km) | −2647 ± 19 | −2712 ± 16 | − 2710 ± 4 |
| gc (km) | −1253 ± 20 | −1202 ± 32 | − 1216 ± 5 |
| Position angle (deg) | 21 ± 3 | 7.5 ± 11 | 148.4 ± 0.9 |
| 15.1 | 15.7 | 1.33 | |
| 1.68b | 1.74b | 0.44b |


Notes. Error bars are at 1σ level. aFor the crater and mountain solutions, these quantities are the apparent semimajor axis and oblateness of the limb. For the Maclaurin solution, they are the true equatorial radius and oblateness; see the text. bThe calculation of from is explicit in the text.


Download table as: ASCIITypeset image
Table 3. Physical Parameters of Quaoar Obtained from the Various Solutions of Table 2
| Solution | Equivalent Radius | Oblatenessa | Visible Geometric | Density |
|---|---|---|---|---|
| (km) | Albedo | (g cm−3) | ||
| Crater | 552 ± 14 | 0.29 ± 0.04 | 0.110 ± 0.002 | 1.67 ± 0.27 |
| Mountain | 524 ± 20 | 0.14 ± 0.05 | 0.123 ± 0.016 | 2.12 ± 0.34 |
| Maclaurin | 555 ± 2.5 | 0.109 ± 0.007 | 1.99 ± 0.46 | |
| Global range | 504–566 | 0.0722–0.33 | 0.102–0.139 | 1.40–2.46 |
Notes. Error bars are derived from the error bars of each solution combined with the error bars of the absolute magnitude (HV = 2.82 ± 0.06; DeMeo et al. 2009) and the mass (M = (1.40 ± 0.21) × 1021 kg; Fraser et al. 2013). The last line presents the global possible ranges allowed for by all solutions. aFor the crater and mountain solutions, this is the apparent oblateness, and for the Maclaurin solution, this is the true oblateness; see the text.
Download table as: ASCIITypeset image
If Quaoar is a Maclaurin spheroid, its density is ρ = 1.99 ± 0.14(± 0.46) g cm−3, where the first error bar measures our internal accuracy, while the error bar in parentheses takes into account the uncertainty in Quaoar's mass (Fraser et al. 2013). Similarly, the true oblateness is .

The Maclaurin solution has a well-defined equatorial radius of km and a well-defined equivalent radius Requiv = 555 ± 2.5 km at the date of occultation. We can now derive Quaoar's geometric albedo p through


where AUkm = 1.49598 × 10⁸ km, H☉ is the Sun magnitude at 1 AU, and H is Quaoar's absolute magnitude. We find at least two measurements of its absolute magnitude: Rabinowitz et al. (2007) give HV = 2.792 ± 0.025 and DeMeo et al. (2009) give HV = 2.82 ± 0.06. For the results presented below, we have adopted the most recent result given by DeMeo et al. (2009). For the Sun absolute magnitude we have adopted the well-established value of H☉, V = −26.74. Adopting the ranges of equivalent radii obtained for each of the presented solutions, we calculate Quaoar's geometric albedo in the visible pV; see Table 3. The error bars represent the range of the albedo obtained for a given solution, combined with the error in absolute magnitude. For the Maclaurin solution, we obtain pV = 0.109 ± 0.007.
6. ATMOSPHERE
Spectroscopic studies show that the largest TNOs retained water ice and volatiles on their surfaces. Water ice (H2O), mostly in crystalline phase, was detected on many objects, as well as methane (CH4), ammonia (NH3), molecular nitrogen (N2), and even methanol (CH3OH) and ethane (C2H6) for a few of them (Barucci et al. 2005; Guilbert et al. 2009). In contrast, the smaller objects only reveal water ice bands or mere flat spectra. A simplistic approach is thus to split the TNOs into two groups: large volatile-rich bodies and small volatile-poor objects (Schaller & Brown 2007a).
Consequently, large TNOs may undergo outgassing from their interiors, or suffer ongoing volatile loss at their surface, leading to the presence of a thin global or local atmosphere. Seasonal sublimation and recondensation can even be expected, causing surface changes, as seems to be the case for Eris (Sicardy et al. 2011).
Only water ice in crystalline and amorphous phase and methane ice are firmly detected on Quaoar's surface (Jewitt & Luu 2004; Schaller & Brown 2007b). More tentative detections were made on ethane and molecular nitrogen (Guilbert et al. 2009; Dalle Ore et al. 2009).
To investigate the stability of volatiles on TNOs, Schaller & Brown (2007a) and Brown et al. (2011) developed a simple model of atmospheric loss through Jeans escape, including N2, CH4, and CO ices. In the case of Quaoar, given the bulk properties of the object (diameter, mean temperature), they found that N2 may be too light to have been retained over the age of the solar system, while CH4 would be near its limit of stability. These results are consistent with the observed surface composition where only CH4 is firmly detected, but maybe not N2 or CO.
However, the Jeans mechanism gives only a lower limit to the escape rates. Since crystalline water is observed in many TNOs including Quaoar, this implies that their surface temperature was higher than ∼100 K at some recent epoch (i.e., within the last 107 yr (Cooper et al. 2003; Jewitt & Luu 2004). This motivated Levi & Podolak (2009) to investigate the transition between the Jeans and hydrodynamic escapes. For a temperature of ∼100 K, they found that N2 is firmly in the Jeans regime, while hydrodynamic escape could be significant for CH4. However, in a global hydrodynamic regime, the escape rates of the various species depend on their atmospheric mixing ratios rather than on their individual vapor pressures. Therefore, a partially hydrodynamic regime could potentially enhance the CH4 escape rates. Nonetheless, the established presence of CH4 ice on Quaoar's surface indicates that these effects are not strong enough to have entirely depleted Quaoar's surface of methane ice.
Quaoar's mass (Fraser et al. 2013; Vachier et al. 2012) and our preferred equivalent radius of 555 km imply a surface gravity of about 0.4 m s−2. This is intermediate between the values of 0.64 and 0.30 m s−2 obtained for Pluto and Charon, respectively, based on their current mass determinations (Tholen et al. 2008). Also, the mean temperature of Quaoar is similar to that of Pluto due to their respective albedo and heliocentric distances. Thus, a Pluto-like atmosphere for Quaoar is plausible, considering its surface composition, temperature, and gravity. In this context, ground-based stellar occultations are currently the most powerful technique to detect (or put upper limits on) very thin atmospheres of a few nanobars; see, e.g., Sicardy et al. (2011) for the case of Eris.
Quaoar's atmospheric thermal structure is unknown, but we would expect it to be mainly composed of CH4 (and/or N2, if present at the surface). The upper atmosphere temperature can be obtained from the methane "thermostat model" (Yelle & Lunine 1989), where the near-IR heating is balanced through the emission in the 7.7 μm methane band. With an incoming solar flux at Quaoar twice weaker than at Pluto, this model predicts a Quaoar's upper atmosphere temperature of roughly 102 K (versus 106 K for Pluto) at about 10 km above the surface, and a rapid drop below that altitude, connecting the thermal profile to the surface temperature. We assume an equilibrium surface temperature of tsurf = 42 K. This is within the temperature range of a slow or fast rotator body. This crude estimation is sufficient for our purpose.
The equilibrium surface temperature of an airless spherical body depends on its geometric albedo pV, phase integral q, emissivity of ε, beaming factor η, and heliocentric distance r; see, for instance, the equations in Table 4S of Sicardy et al. (2011). Using pV = 0.120 ± 0.018, ε = 0.9, q = 0.52, η = 1.7 (Fornasier et al. 2013), and r = 42.35 AU, we obtain Tss = 54 K for the equilibrium sub-solar temperature in the case of a slow rotator, and Teq = 40 K for the equilibrium equatorial temperature of a fast rotator.
With that prescribed atmosphere, we have modeled synthetic occultation light curves using a ray tracing code as described in Sicardy et al. (2006b) and Widemann et al. (2009). We compare these synthetic curves with our best light curve obtained with the San Pedro de Atacama 0.5 m telescope.
Because there are various possible solutions for Quaoar's shape, we do not know the exact distance of the sub-occultation points to the body center. To overcome this problem, we have generated several synthetic light curves for a range of center-to-limb distances. For each distance, we obtain a χ2 curve that provides its own detection threshold. The envelope of the various χ2 curves yields an upper limit of 21 nbar (1σ), or 56 nbar (3σ) for a methane atmosphere; see Figure 8. The profile expected from a 21 nbar atmosphere is shown in Figure 9. Fitting only the ingress data points (green dots) in Figure 9 does provide the detection of an atmosphere with a pressure of 138 nbar (1σ), but at the 3σ level this remains an upper limit of 221 nbar. In conclusion, we cannot exclude the presence of a local atmosphere.


Figure 8. Curves of χ2 for different center-to-limb radii (from 550 to 560 km), using a pure methane atmosphere, starting at 42 K near the surface with a gradient of 5.7 K km−1 and ramping up to an isothermal profile at 102 K in the upper part. An upper limit of 21 nbar (1σ), or 56 nbar (3σ), atmosphere is derived. The radius is indicated for some of the curves.
Download figure:
Standard image High-resolution image
Figure 9. Solid black line: a synthetic occultation light curve caused for a 21 nbar methane atmosphere, assuming a center-to-limb distance of 553 km. Green and red dots: the ingress and egress data points, respectively, obtained at San Pedro (0.5 m telescope). The horizontal bars represent the finite integration time of each data point. Blue circles: the synthetic points after convolving the synthetic light curve by the finite integration time at each data point.
Download figure:
Standard image High-resolution imageWe note that methane has a vapor pressure of 32 nbar at 42 K (Fray & Schmitt 2009), consistent with our absence of detection of a global atmosphere. Nitrogen is more volatile, with a vapor pressure of 176 μbar at the same temperature. Thus, the atmospheric upper limit tends to rule out the presence of exposed N2 ice on the surface.
Finally, using the values of the geometric albedo pV and phase integral q given earlier, we conclude that the surface temperature at the sub-solar point can reach 54 K, which could produce a 17 μbar CH4 local atmosphere that would partially condensate to the nanobar level near the limb, thus being undetectable in our data set.
7. OTHER CONSTRAINTS
7.1. Search for Secondary Events
Considering its flux ratio to Quaoar and assuming equal albedo, Weywot has a size ratio of about 1/12 with respect to the primary (Fraser & Brown 2010). From the Quaoar size determined here, we can calculate Weywot equivalent diameter. This yields a diameter of about 90 km to the secondary. According to the ephemeris31 calculated by Vachier et al. (2012), the satellite shadow passed at about 800 km north of Quaoar's shadow, and about 11 minutes later. The occultation would have lasted for 5 s at most.
No secondary occultation was seen at Belo Horizonte (CEAMIG) or Pico do Dias (OPD), the two nearest sites to the predicted path. However, the observation strategy was not optimized for such a detection, since the integration time at CEAMIG was 6 s, with a readout time of 3 s (Table 1). So, if an occultation by Weywot had occurred during one exposure, then a conspicuous 2.8 mag drop would have been observed. If it had happened during a readout time interval, then a magnitude drop of 1.1 would be expected. No such dimming was detected. At OPD, the exposure time was 0.95 s, with about 1.05 s of readout time between frames. If a 5 s occultation had happened, then it would have lasted for at least two complete cycles with a drop of about 3 mag; any event like that is seen in the light curve. However, the absence of detection does not bring further constraints on the satellite orbit.
7.2. The 2012 February 17 Occultation
On 2012 February 17, another multi-chord stellar occultation by Quaoar was observed from Europe. Also identified in the ESO/WFI program (Assafin et al. 2012), the occulted star has magnitudes R = 15.2 and K = 11.6. Astrometric updates could only be made several months in advance, before its conjunction with the Sun. The small solar elongation just prior to the event prevented last-minute predictions. The final ICRF/J2000 star position is given in Table 4.
Table 4. Astrometric Constraints Derived from the 2012 February 17 and 2012 October 15 Occultations
| Date | 2012 Feb 17a | 2012 Oct 15b |
|---|---|---|
| Time of closest approach (UT) | 04:30:43.76 ± 0.11 | 00:41:19 ± 5 |
| Distance of closest approach | 161 ± 12 mas, N | 44 ± 25 mas, S |
| from geocenterc | ||
| Offset in right ascensiond | −101 ± 25 mas | −110 ± 26 mas |
| Offset in declinationd | −92 ± 24 mas | −63 ± 26 mas |
| Coordinates of star | 17h34m21.s8453 ± 0 022 022 |
17h28m10.s1257 ± 00013 |
| (ICRF/J2000) | −15° 42' 105860 ± 0008 |
−15° 36' 23324 ± 00013 |
Notes. aObtained from the circular fit. bAssuming a Quaoar radius of R = 535 km, the middle value of the global range of Requiv in Table 3. cThe label "N" (resp. "S") means that the shadow center passed north (resp. south) of geocenter. dQuaoar's offset relative to the JPL#21/DE405 ephemeris.
Download table as: ASCIITypeset image
Fifteen sites reported attempts, but the majority was unable to observe due to poor weather or technical issues. The event was detected from four different sites (Table 5), but three sites were separated by 3 km only cross-track. This means that we have only two effective chords to fit Quaoar's limb.
Table 5. Circumstances of Observation for the Quaoar Occultation of 2012 February 17
| Site | Latitude | Aperture | Exposure | Ingress (UT) |
|---|---|---|---|---|
| City | Longitude | Instrument | S/N | Egress (UT) |
| Observer | Altitude | Pixel Scale ('') | ||
| Gnosca/CHE | 46° 13' 532 N |
0.4 m | 10.24 s | 4:28:37.6 ± 4.5 |
| S. Sposetti | 09° 01' 265 E |
Watec 120N+ | 4.4 | 4:29:09.4 ± 5.5 |
| 260 m | 19 |
|||
| TAROTa | 43° 45' 073 N |
0.25 m | 3 × 180b s | 4:28:08.1 ± 3.0 |
| OCAc/Calern/FRA | 06° 55' 251 E |
CCD Andor | 4.6 | 4:29:06.5 ± 3.5 |
| A. Klotz and | 1270 m | 33 |
||
| E. Frappa | ||||
| 43° 51' 524 N |
0.21 m | 5.12d s | 4:28:09.2 ± 2.1 | |
| Valensole/FRA | 06° 00' 230 E |
Watec 120N+ | 4.0 | 4:29:03.2 ± 2.2 |
| J. Lecacheux | 622 m | 084 |
||
| Tourrette-Levens/FRA | 43° 47' 222 N |
0.356 m | 10 s | 4:28:17.6 ± 2.2 |
| 07° 15' 472 E |
Apogee Alta U1 | 30 | 4:29:04.3 ± 0.5 | |
| P. Tanga | 385 m | 27 |
Notes. aTélescopes à Action Rapide pour les Objets Transitoires. bThree images obtained with drift scan method; the telescope tracking was set to 96.4% so the time resolution per pixel was 6 s pixel−1. cObservatoire de la Côte d'Azur. dThe observation started with 10.24 s of integration time, but about 1 minute before the beginning of the event it was set to 5.12 s.
Download table as: ASCIITypeset image
The observations were performed with video and CCD cameras. Drift scan mode was used with the TAROT instrument, with a 6 s pixel−1 resolution, resulting in a low accuracy chord length. At Tourrette-Levens, a sequence of CCD images was acquired, but during ingress a tracking problem occurred. Moreover, the measured chord is too short compared to the other two along the same track, possibly pointing toward a timing problem. As the stations TAROT, Tourrette-Levens, and Valensole observed the same chord, we use the occultation times given by the Valensole observation, as it presents the best accuracy among them (Table 5).
With two chords at hand, we can perform a circular fit, with radius R and center (fc, gc) as free parameters. This provides km (1σ), and thus a lower limit of Rmin = 530 km. The observed chords are compatible with the Maclaurin solution obtained from the 2011 May 4 event, but do not bring further constraints (Figure 10).

Figure 10. The 2012 chords are compatible with the 2011 Maclaurin solution but do not bring further constraints. It corresponds to the middle point of the blue dotted segment in Figure 6, projected to the 2012 February 17. It has a position angle P =1469, an equivalent radius Requiv = 555 km, an equatorial radius Requa = 569 km, apparent oblateness ' = 0.0428, and a .

Download figure:
Standard image High-resolution imageThis event can be used, however, to improve Quaoar's ephemeris by giving its time of closest approach to the star, its distance to the star at that moment, and its offset relative to the JPL#21/DE405 ephemeris; see Table 4.
7.3. The 2012 October 15 Occultation
A third stellar occultation by Quaoar was observed on 2012 October 15. The occulted star has magnitudes R = 17.3 and K = 14.4, and was also taken from the Assafin et al. (2012) catalog. Astrometric updates suggested an occultation path crossing the south of Chile. This unfavorable prediction explains why only four telescopes in Chile were scheduled for that event. The PROMPT32 instrument was the only one that could eventually monitor the star and detect the event. Two 0.4 m telescopes with identical setups were used with 8 s integration times and 1 s readout times. The acquisitions were offset by 4 s so as to overlap the effective observing intervals and thus avoid information loss caused by readout times.
The event lasted from 00:45:30 ± 2.5 to 00:45:50 ± 2.5 UT, which translates into a chord of 400 km in length. Consequently, this observation does not provide new constraints on Quaoar's size (considering the two positive detections presented above), but we may use this result for astrometric purposes. Even not knowing if the chord probed the north or the south part of Quaoar (i.e., we have two possible solutions), this uncertainty is only about 26 mas in the plane of the sky. Table 4 provides the time of Quaoar's closest approach to the star, and its angular distance to the star at that moment.
8. CONCLUSION
We observed the first multi-chord stellar occultations by (50000) Quaoar, one from South America on 2011 May 4 with five chords and another one from Europe on 2012 February 17 with two chords. A third single-chord event was detected from Chile on 2012 October 15. The last two occultations confirm, but do not bring further constraints to, the results obtained from the first event. They provide, however, astrometric constraints that may be used for the prediction of future events.
Taking the timings of the 2011 May 4 event at face value, we find topographic features (crater or mountain) that are too large to be maintained on a body as massive as Quaoar.
An alternative approach is to allow for time shifts at all stations, i.e., accept that there are timing errors. Such errors are admittedly bothersome, since we do not have clear explanations for them. However, as discussed above, the largest time shift has to be applied to the only station, while the shifts at the other stations remain compatible with the occultation time uncertainties at the 2.5σ level.
With this approach, we obtain a variety of satisfactory fits by elliptical limbs. All those ellipses have the same apparent area, yielding well-constrained values for Quaoar's equivalent radius Requiv = 555 ± 2.5 km and visible geometric albedo pV = 0.109 ± 0.007. Adding the further constraint that Quaoar is a Maclaurin spheroid with an indeterminate polar aspect angle ζ between 0° and 90°, we find that Quaoar has an equatorial radius km, true oblateness and density ρ = 1.99 ± 0.14(± 0.46) g cm−3. The errors shown within parentheses of and ρ account for the current uncertainty in Quaoar's mass M, and can be improved when M is better known.

The position angle of Quaoar's north pole projected in the plane of the sky is P = −318 or 1484 ± 09 for our preferred solution (Figure 7), while Weywot's orbit pole has P in the range 5°–15° (Vachier et al. 2012; Fraser et al. 2013). Thus, our preferred solution implies that Weywot is not orbiting into Quaoar's equatorial plane. This is not surprising, considering that Weywot has probably preserved its primordial orbital inclination against tidal damping (Fraser et al. 2013).
The density that we obtain is typical of TNOs, and significantly smaller than the range 2.7–5.0 g cm−3 given by Fraser et al. (2013). This disagreement fundamentally stems from the fact that our Quaoar's occultation-derived diameter is significantly larger than previous indirect size estimates. In fact, recent measurements using Herschel far-IR data combined with Spitzer, and interpreted from the thermophysical model, provide a preferred equivalent radius of 541 ± 34 km (Fornasier et al. 2013), which agrees with our value at the 0.4σ level.
Fornasier et al. (2013) also provide a preferred Quaoar's geometric albedo, 0.12 ± 0.02, which agrees with our value at the 1.6σ level. These authors, however, use a value HV = 2.73 ± 0.06. Had they used the same absolute magnitude as we did (HV = 2.82 ± 0.06), their calculated albedo would be 0.11 ± 0.02, in complete agreement with our result.
We put an upper limit of about 20 nbar (1σ) to the presence of a global methane atmosphere, but we cannot exclude a local, denser atmosphere. Higher signal-to-noise ratio (S/N) occultation light curves will certainly provide better values in the near future. Our limit can be compared to that obtained for Charon: 15 nbar (Sicardy et al. 2006a), Eris: 1 nbar (Sicardy et al. 2011), and Makemake: 12 nbar (Ortiz et al. 2012). The lack of atmosphere around Charon can be explained by the lack of volatiles such as CH4 or N2 on its surface, which ultimately results from its smaller mass. Concerning Eris, whose surface composition and mass are comparable to those of Pluto, the lack of atmosphere probably stems from its cold environment, which condenses any putative atmosphere on its surface. This is supported by the fact that Eris has a very high albedo, pV = 0.96 (Sicardy et al. 2011), that could be caused by a transient CH4 or N2 ice coating, which will sublimate when Eris approaches its perihelion.
The cases of Makemake and Quaoar are more challenging, as they have the right surface composition and heliocentric distances to possess an atmosphere. Both also have dark terrains (locally or globally distributed) and therefore local surface temperatures over 40 K that can maintain CH4 or N2 atmospheres through sublimation. In both cases, the non-detection of a global atmosphere argues against the presence of N2 ice on the surface. Our lack of detections thus constrains the mechanisms that maintain (or prevent) the presence of atmospheres around TNOs.
F.B.R. acknowledges the financial support by the CDFB-CAPES/Brazil. B.S., F.C., J.L., F.R., T.W., and F.B.R. acknowledge support from the French National Research Agency (ANR) grant "Beyond Neptune," and B.S. also acknowledges support from the Institut Universitaire de France. J.L.O. acknowledges support from Spanish grants AYA2011-30106-C02-01 and AYA2008-06202-C03-01. M.A., J.I.B.C., and R.V.M. acknowledge CNPq/Brazil grants 482080/2009-4, 306028/2005-0, 478318/2007-3, 151392/2005-6, and 304124/2007-9. M.A. and J.I.B.C. thank FAPERJ/Brazil for grants E-26/170.686/2004 and E-26/110.177/2009. M.G. and E.J. are FNRS Research Associates, and J.M. is the Research Director. TRAPPIST is a project funded by the Belgian Fund for Scientific Research (Fond National de la Recherche Scientifique, F.R.S-FNRS) under grant FRFC 2.5.594.09.F, with the participation of the Swiss National Science Fundation (SNF). L.V. and R.L. acknowledge the Project CONICYT Anillo ACT-86. R.D. acknowledges financial support from the MINECO (contract Ramón y Cajal). We also acknowledge Caisey Harlingten's 0.5 m Searchlight Observatory Network Telescope in San Pedro de Atacama. We thank the anonymous reviewer for constructive comments that improved this paper.
Footnotes
- 29
Note that in this case, the apparent semimajor axis of the limb, a', is equal to the equatorial radius a of the spheroid.
- 30
Note that α = 0 does not mean that the semiminor axis of the ellipse is pointing to the celestial north, as the chords are inclined with respect to the east–west celestial direction.
- 31
- 32
Panchromatic Robotic Optical Monitoring and Polarimetry Telescopes, Cerro Tololo (latitude: 30° 10' 10
78 S; longitude: 70° 48' 2349 W; altitude: 2207 m).