


ABSTRACT
We present the results of a suborbital rocket flight whose scientific target was the Cygnus Loop Supernova Remnant. The payload consists of wire grid collimators, off-plane grating arrays, and gaseous electron multiplier (GEM) detectors. The system is designed for spectral measurements in the 17–107 Å bandpass with a resolution up to ∼60 (λ/Δλ). The Extended X-ray Off-plane Spectrometer (EXOS) was launched on a Terrier-Black Brant rocket on 2009 November 13 from White Sands Missile Range and obtained 340 s of useable scientific data. The X-ray emission is dominated by O vii and O viii, including the He-like O vii triplet at ∼22 Å. Another emission feature at ∼45 Å is composed primarily of Si xi and Si xii. The best-fit model to this spectrum is an equilibrium plasma model at a temperature of log(T) = 6.4 (0.23 keV).
Export citation and abstract BibTeX RIS
1. INTRODUCTION
Supernovae are among the most important and interesting events in our Galaxy. They play a major role in the structural, compositional, and energy evolution of the interstellar medium (ISM). They provide one of the primary sources for metal creation, and their interaction with the ISM influences the energy balance of the host galaxy through the creation of hot ionized gas.
The Cygnus Loop Supernova Remnant is one of the best-studied remnants due to its proximity of  pc (Blair et al. 2005), low extinction (Fesen et al. 1982), and large (∼3°) angular size (Levenson et al. 1997). Observations from radio to X-ray show a complicated morphology that is not fully understood. The blast wave appears to be propagating in an inhomogeneous medium created by a precursor-formed cavity, surrounded by clumpy high-density clouds (Levenson et al. 1997, 1998; McEntaffer & Brantseg 2011). This morphology results in strong limb emission in the X-ray, particularly within the high-density clouds. This emission typically hardens interior to the outer shell as a reflection shock travels inward, reheating the material to higher temperatures.
One of the highest-resolution spectra in the soft X-ray bandpass was obtained by Vedder et al. (1986). Using the Focal Plane Crystal Spectrometer on the Einstein Observatory, the authors observed emission from O vii, O viii, and Ne ix in the northern section of the Loop. The lack of forbidden line emission of the He-like O vii triplet suggested that the observed portion of the Cygnus Loop is not in a state of collisional ionization equilibrium (CIE).
A comprehensive imaging study of the Cygnus Loop (Levenson et al. 1999), using the Position Sensitive Proportional Counter (PSPC) on board ROSAT, showed X-ray emission indicative of a global shock velocity of a few hundred km s−1. The spectra along the rim were fit with a Raymond–Smith equilibrium plasma (Raymond & Smith 1977) with  keV and absorbing column density of
  cm−2. A spectrum from a region interior to the shock front requires the addition of a higher-temperature component at 0.25 keV.
Using the Chandra ACIS CCD, Levenson et al. (2002) examined spectra from four small regions. Their spectral fits utilized an equilibrium plasma model, MEKAL (Mewe et al. 1985, 1986; Liedahl et al. 1995). Along the rim the emission was soft, requiring a temperature of kTe = 0.03 keV. Interior to the shock front they found that the reflected shock had reheated the material to a kTe ∼ 0.2 keV. These regions were best fit with absorbing column densities of (4.7–24) × 1020 cm−2 and about half the solar abundance of oxygen. Observations of the southwest limb using the same instrument showed significant spectral variations in the region (Leahy 2004). These variations seem to be due to compositional, temperature, and column density variations. All of the 21 subregions examined were best fit with the MEKAL model with kT = 0.174–0.207 keV. The Ne/O and Fe/O ratios are nearly constant in every region, a further indication that the elements all originated in a single supernova (Leahy 2004), effectively countering the suggestion, based on differences in radio emission between the northern and southern parts of the remnant, that the Cygnus Loop might be two supernova remnants (SNRs; Uyaniker et al. 2002). Given these abundance ratios, the supernova was most likely a Type II SN with ∼11–20 M☉.
Suzaku observations by Miyata et al. (2007) showed strong emission in O vii at 562 ± 10 eV, O viii at 653 ± 10 eV, C vi at 357 ± 10 eV, and N vi at 425 ± 10 eV, best fit with a non-equilibrium two-temperature model. They found a lower-temperature (kTe = 0.10–0.15 keV) component farthest out and an increase in ionization toward the inner region. The column densities were in the range  cm−2. The ionization timescales, log (net), for the regions ranged from 11.31 to 11.99.
Using XMM-Newton, Tsunemi et al. (2007) performed seven observations on the Cygnus Loop. They found that the second temperature component was unnecessary at the rim regions but helped fit the interior of the loop. The rim spectrum was best fit with a single-temperature non-equilibrium model (Hamilton et al. 1983; Borkowski et al. 1994, 2001; Liedahl et al. 1995) at 0.2–0.25 keV and NH = 4 × 1020 cm−2. The two-component model for interior regions showed temperatures of 0.12–0.34 keV for the soft component and >0.35 keV in the interior region. High abundances for Si and S relative to solar values (2.5 and 5.0 times solar) for the high-temperature component lead to the conclusion that this component is dominated by ejecta. They determine a progenitor mass of ∼15 M☉ based on the abundance of ejecta.
A survey by Uchida et al. (2009b) used 32 observations by Suzaku and 9 by XMM-Newton. This survey confirmed a high-kTe ejecta component surrounded by a low-kTe component. The low-temperature component originates from the blast wave interacting with the surrounding interstellar material. The authors determined that the simple Sedov evolution model did not explain the emission measure distribution of this ISM component, giving evidence of the cavity-explosion origin of the Cygnus Loop. This is supported by the Levenson et al. (1999) observations of a soft X-ray shell emitted by the blast wave as it encounters the cavity wall. The inner region out to approximately 80% of the shock radius needs a higher-temperature component for accurate spectral modeling. This region has likely been reheated by a reverse shock. The average value of the two temperature components is 0.23 keV and 0.52 keV.
An XMM-Newton observation by Zhou et al. (2010) of a region along the eastern front of the Cygnus Loop, known as the XA region, shows a complicated morphology. The joint abundances were found to be lower (∼0.2 solar), in agreement with other studies. The two temperature fits involved a 0.15 keV component and a >0.24 keV component in the various regions. McEntaffer & Brantseg (2011) utilized Chandra data in the same region and obtained similar results. They found blast front temperatures from 0.085 to 0.123 keV at equilibrium and interior temperatures from 0.166 to 0.6. Some interior regions required non-equilibrium conditions to obtain adequate fits.
These studies are all localized to particular regions. Surveys of several pointings can somewhat represent the entire loop, but accurately combining several data sets from various instruments taken at different times can be difficult to accomplish with adequate precision and without introducing systematic uncertainties. Therefore, an integrated spectrum of the entire Cygnus Loop would complement these regional spectra. This is particularly true, as regional spectra are not available for the entire remnant. This integrated spectrum could help discern the overall contribution of equilibrium versus non-equilibrium components and the average temperature of the interior ejecta versus the ISM emission along the blast wave. Additionally, knowing the overall abundances of the remnant could help narrow down the progenitor mass. Due to the extended emission, the previous observers were unable to use grating spectroscopy and are thus limited in spectral resolution. Previous observations of the entire loop (Borken et al. 1972; Gronenschild 1980) utilized proportional counters with energy resolution of several hundred eV. Though superior in coverage, they lack the spectral resolution necessary for detailed modeling.
Achieving high-resolution spectroscopy was the goal of the Cygnus X-ray Emission Spectroscopic Survey (CyXESS) rocket payload (McEntaffer et al. 2006). This payload was launched at 02:00:00 UT, 2006 November 21, from White Sands Missile Range (McEntaffer & Cash 2008). Unfortunately, a high-voltage breakdown event occurred, rendering one detector inoperable and the other noisy. Despite these difficulties, a useable spectrum was obtained from the observation. This spectrum was best fit with an equilibrium plasma with kTe = 0.14 keV and depletion of Si. This payload was refurbished and improved for a second flight. The payload, christened Extended X-ray Off-plane Spectrometer (EXOS), and flight are described in Section 2, and the results are analyzed in Section 3.
2. SUBORBITAL INSTRUMENT
2.1. Description
The main optical components of this spectrometer design are wire grid collimators, off-plane reflection grating arrays, and gaseous electron multiplier (GEM) detectors. The payload has two identical modules, each containing a collimator, grating array, and GEM detector. The wire grid collimator produces a converging beam by vignetting all non-converging light. The rate of convergence defines the field of view (FOV) of the system at 3 25 × 325, sufficient to cover the entire Cygnus Loop. This converging beam is then diffracted by an array of 67 gratings positioned in the off-plane mount (Cash 1982). The diffracted beam disperses over 2 m and is recorded by our GEM detectors. The instrument is discussed in detail in Oakley et al. (2011).
2.2. Instrument Performance
The instrument was designed to obtain soft X-ray spectra in the 17–107 Å band in first order. This bandpass was shifted shortward from the CyXESS flight to observe the strong oxygen emission lines observed in the Cygnus Loop (Miyata et al. 2007). The dispersion of the system is 0.90 Å mm−1 and produces spectral lines with an FWHM of ∼2 mm. This produces theoretical resolution of ∼10–60 in first order as shown in Figure 1. The grasp of the system (measured in cm2 sr) is defined by the FOV (∼9 deg2), detector size, line width, window transmissivity, and grating efficiency. The theoretical grasp of the system (supported by calibration data) is also shown in Figure 1.

Figure 1. Theoretical performance of the EXOS instrument. Left: resolution for each diffracted order. Right: grasp of the instrument.
Download figure:
Standard image High-resolution image2.3. Flight
The EXOS payload (NASA flight 36.252) was launched out of White Sands Missile Range, New Mexico, aboard a Black Brant Terrier on Friday, November 13, at 7:30 pm local time (02:30:00 UT, 2009 November 14). During flight, the detectors were powered and collected photons for 364 s. Approximately 340 s of flight produced useable scientific data where the voltage levels, gas pressures, and electronic diagnostics reported optimal operation. The GEM detectors functioned well during flight but experienced noise levels significantly higher than laboratory calibration tests. This may be due to higher-than-expected vibrations (by a factor of up to 100) experienced during launch. Vibration anomalies have been shown to induce noise in similar detector and electronic systems on other flights (Schindhelm et al. 2010). This additional noise component is unfortunate, but useful spectral analysis is still achievable.
3. RESULTS
The data were extracted and pre-flight calibrations were utilized to determine the wavelength scale. Unfortunately, the damage experienced on landing prevented any post-flight calibrations. A noise level of ∼100 counts Å−1 was subtracted from the raw spectrum. This noise level was modeled as a linear distribution, consistent (in shape, not in magnitude) with laboratory observations. It is possible that a portion of this component is actual continuum emission from the Cygnus Loop. Continuum emission, caused by synchrotron radiation, has been shown to play an important role in the overall X-ray emission from all the recent historical remnants (Koyama et al. 1995; Reynolds et al. 2007; Helder & Vink 2008; Hwang et al. 2002). This emission is not expected to be prominent in a middle-aged remnant like the Cygnus Loop. Unfortunately, due to our limited noise calibration, this component is highly uncertain. We present only the confirmed thermal component below. Future flights will further investigate the possibility of continuum emission playing a more important role than commonly thought in older remnants.
These data were fit to various models using the X-Ray Spectral Fitting Package (Xspec; Arnaud 1996) version 12.5.1. Custom response matrices were created for use in Xspec corresponding to the effective area curves shown in Figure 1.
The modeled absorbing column density was restricted to a range of 1.0 × 10²⁰–1.3 × 10²¹. This range was chosen as an approximate 3σ level from previous observations (see Borken et al. 1972; Gronenschild 1980; Levenson et al. 1999; and references in Section 1). The best-fit model was the Xspec vequil model developed by Borkowski et al. (1994, 2001), Hamilton et al. (1983), and Liedahl et al. (1995) with a photoelectric absorption component (Balucinska-Church & McCammon 1992).
The models are initiated with cosmic abundances from Anders (1989), except for C, N, and O. Due to their expected importance (Miyata et al. 2007), we set their initial abundances based on previous measurements. The most relevant metallicity measurement for our spectrum is that from the CyXESS spectrum (McEntaffer & Cash 2008). They determined an abundance of 0.44 for nitrogen but did not find it necessary to deplete C or O despite previous findings. Levenson et al. (2002) determined an abundance value of 0.44 for O. Miyata & Tsunemi (2001) found that an abundance of 0.44 for C, N, and O was consistent in several regions of the Cygnus Loop. For the EXOS spectrum we use a 0.44 abundance for the initial values for these three elements. We allow all elemental abundances to vary.
Other Xspec models such as vmekal (Mewe et al. 1985, 1986; Liedahl et al. 1995), Raymond–Smith (Raymond & Smith 1977), srcut (Reynolds & Keohane 1999; Reynolds 1998), vnei, and vpshock (both have the same references as vequil) were also attempted and did not statistically improve the fit.
The spectrum and best-fit model are shown in Figure 2. The notations above the spectrum designate the location of expected emission lines. The height of the vertical lines indicates the predicted relative strength of each contribution after convolution with the effective area curve. Detailed information for each transition is shown in Table 1. This model represents a thermal equilibrium plasma with a temperature of 0.23 ± 0.02 keV and an absorbing column density of  cm−2 and achieves a
  . The joint confidence interval contour map is shown in Figure 3 with contours for 68%, 90%, 95%, and 99% joint confidence intervals. Varying the elemental abundances does not significantly improve the quality of the fit. Lower noise observations are necessary to better constrain elemental abundances. The observed counts are dominated by oxygen and silicon emission. There is also some flux in the 50–80 Å bandpass. However, due to the high background count rate and corresponding large error bars, these detections are not highly significant.

Figure 2. Best-fit spectrum to EXOS data with the background subtracted. Black represents the observed spectrum, while red represents the best-fit model, a thermal equilibrium plasma with a temperature of 0.23 keV. The vertical lines above the spectrum indicate major emission lines predicted by the model. The height of the line indicates the strength of the emission after being convolved with the effective area of EXOS at that wavelength. The diagonal lines are simply to clarify the identification. The transition and relative strength of these lines are listed in Table 1.
Download figure:
Standard image High-resolution image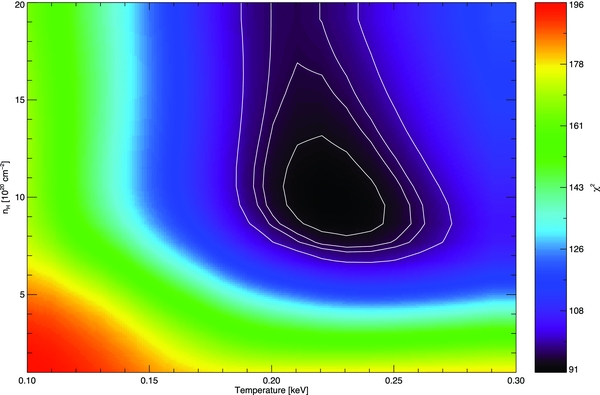
Figure 3. Joint confidence interval for temperature and column density. The contours represent 68%, 90%, 95%, and 99% confidence intervals.
Download figure:
Standard image High-resolution image
Table 1. Best-fit Line Identifications Based on Equilibrium Model Fits
| Ion | Wavelength | Transition | Incident Strength | Observed Strength | Observed |
|---|---|---|---|---|---|
| (Å) | |||||
| O vii | 17.396 | 1s2–1s5p | 1.000 | 0.029 | x |
| O vii | 17.768 | 1s2–1s4p | 0.858 | 0.045 | x |
| O vii | 18.627 | 1s2–1s3p | 0.552 | 0.152 | x |
| O viii | 18.967 | 1s–2p | 0.417 | 0.858 | x |
| O viii | 18.972 | 1s–2p | 0.152 | 0.417 | x |
| O vii | 21.601 | 1s2–1s2p [R] | 0.113 | 1.000 | x |
| O vii | 21.804 | 1s2–1s2p [I] | 0.067 | 0.138 | x |
| O vii | 22.098 | 1s2–1s2s [F] | 0.064 | 0.552 | x |
| N vii | 24.779 | 1s–2p | 0.052 | 0.150 | x |
| N vii | 24.785 | 1s–2p | 0.045 | 0.073 | x |
| C vi | 28.465 | 1s–3p | 0.039 | 0.028 | |
| C vi | 28.466 | 1s–3p | 0.036 | 0.013 | |
| N vi | 28.787 | 1s2–1s2p | 0.032 | 0.047 | |
| Ca xi | 30.471 | 2p6–2p53d | 0.029 | 0.066 | |
| Si xii | 31.012 | 2s–4p | 0.029 | 0.015 | |
| Si xii | 32.973 | 2p–4d | 0.026 | 0.016 | |
| C vi | 33.734 | 1s–2p | 0.019 | 0.109 | |
| C vi | 33.740 | 1s–2p | 0.018 | 0.052 | |
| Si xi | 43.763 | 2s2–2s3p | 0.017 | 0.066 | x |
| Si xii | 44.019 | 2p–3d | 0.013 | 0.145 | x |
| Si xii | 44.165 | 2p–3d | 0.012 | 0.254 | x |
| Si xii | 44.178 | 2p–3d | 0.012 | 0.028 | x |
| Si xii | 45.521 | 2p–3s | 0.011 | 0.059 | |
| Si xii | 45.691 | 2p–3s | 0.008 | 0.116 | |
| Si xi | 46.399 | 2p–3d | 0.007 | 0.016 | |
| Si xi | 49.222 | 2p–3d | 0.007 | 0.082 | |
| Si x | 50.524 | 2p–3d | 0.007 | 0.016 | |
| Si xi | 52.298 | 2p–3s | 0.007 | 0.029 |
Notes. Transitions based on Mewe et al. (1985). The incident strength here indicates the strength of the incident emission prior to being convolved with the EXOS effective area curves. The observed strength column represents this strength when convolved with the effective area curves. This column is the same as the line heights in Figure 2. The last column indicates whether this emission line is actually observed in the spectrum. Many of these emission lines are blended but are discernible above the background level. Emission lines without this observed notation are only included based on their predicted presence in the theoretical models.
Download table as: ASCIITypeset image
This result is generally consistent with previous findings. Our column density of  cm−2 is within the uncertainty of past findings. For example, Levenson et al. (1999) found a column density of (7 ± 4) × 1020 cm−2 and Levenson et al. (2002) found densities from 4.7 × 10²⁰ to 2.4 × 1021 cm−2. Our temperature finding is also consistent with past results. Leahy (2004) found that 21 subregions in the southwest limb are best fit with temperatures between 0.17 and 0.21 keV, consistent with our findings. The two-component model of Tsunemi et al. (2007) had the softer component at 0.2 keV and near-equilibrium conditions, while Uchida et al. (2009a) found the softer component at 0.19 keV. Lastly, their follow-up study (Uchida et al. 2009b) with 41 observations found an average temperature of 0.23 keV for the softer component, identical to our findings.
These authors also find a harder temperature component, typically ∼0.4–0.6 keV in the interior of the remnant. It is possible that this component, likely the hot reverse shock, is influencing our spectral modeling. Though not bright enough to explicitly model, future more lengthy observations may be able to pull out this component. This component is typically necessary out to approximately 80% of the shock radius (Uchida et al. 2009b). Our result indicates that the X-ray emission from the Cygnus Loop is dominated by the softer component at the forward shock front. This is not surprising given the image morphology seen in ROSAT images (Levenson et al. 1999). However, the noise problems with the GEM detectors from both flights may have resulted in degraded data and incomplete information. Additionally, our instrument's efficiency is optimized around softer emission, making detection of a harder component more difficult. Further observations should be conducted with a lower background level to increase our sensitivity to weaker emission features. An increase in resolution would also benefit our analysis by resolving ambiguities in the model parameters.
We also compare our results with those from the CyXESS launch (McEntaffer & Cash 2008) to test for consistency. The best-fit model from the CyXESS flight was a thermal equilibrium mekal model at a temperature of 0.14 keV, somewhat lower than the 0.23 keV result found to fit the EXOS data. The EXOS bandpass was extended to much shorter wavelengths (from 44 Å down to 17 Å). This was done to observe the anticipated oxygen emission lines (Miyata et al. 2007) at energies higher than the CyXESS bandpass. The ability to observe these two ionization states of oxygen (VII and VIII) provides a much more stringent temperature constraint. Measuring the two ionization states provides a direct measure of temperature, rather than relying on much sparser elements (such as the Si line blends in the CyXESS data) that result in a more uncertain temperature. Given this advantage, the temperature measurement of 0.23 keV is more reliable. Additionally, the EXOS data do not require a depletion of Si that was observed by CyXESS.
The EXOS data are consistent with the CyXESS results. The softness of the observed emission, combined with the spatially resolved spectra of Uchida et al. (2009b), suggests that we may be seeing the interaction between the blast wave and the ISM wall. The shifted EXOS bandpass, improved collimators, and more accurate effective area curves find a more reliable temperature value for this softer component than CyXESS.
4. CONCLUSION
High-resolution X-ray spectroscopy is important to better understand the evolution and energy balance of SNRs. Through spectral diagnostics in the soft X-ray bandpass (17–107 Å), we can determine metrics of interest such as temperature, composition, and equilibrium state. The EXOS payload (Oakley et al. 2011) was constructed as an improvement to the CyXESS payload (McEntaffer & Cash 2008) and designed to accomplish this task on the Cygnus Loop Supernova Remnant. The EXOS payload was launched from White Sands Missile Range, New Mexico on, 2009 November 13 at 7:30 pm and obtained 340 s of useable scientific data. The emission is dominated by O vii and O viii, including the He-like O vii triplet at ∼22 Å. Another feature at ∼45 Å is composed primarily of Si xi and Si xii. The best-fit model to this spectrum is an equilibrium plasma model at a temperature of log(T) = 6.4 (0.23 keV), likely dominated by the limb region, where the forward blast front is interacting with the surrounding ISM. This temperature is consistent with previous observations. Some previous observations indicate a need for a second temperature component to account for the ejecta material reheated by the reverse shock interior to the (softer) forward blast wave. Our ability to observe this component may be limited by the noise level of our detectors. Further observations at this resolution, or higher, are necessary with improved detectors to definitively show the importance of this component. To accomplish this task, we are currently refurbishing the collimators to increase the effective area and manufacturing the next generation of GEM detectors to improve stability.
This project was funded by NASA grant NNX09AC23G. We thank the Wallops and White Sands Missile Range support personnel from flights 36.224 and 36.252 for all of their critical work on the project. We also thank Luxel for their help in improving our GEM windows, Toru Tamagawa for his assistance with our GEM plates, Charlie Zabel for his constant help with our gas system, and the Hodgsons and JILA shop for cutting our metal. The success of these missions was reliant on the work done by Mike Kaiser, Travis Curtis, Nico Nell, Eric Schindhelm, Ted Schultz, Ann Shipley, and Ben Zeiger.