


ABSTRACT
We report the discovery of Seyfert-2 galaxies in SDSS-DR8 with galaxy-wide, ultraluminous narrow-line regions (NLRs) at redshifts z = 0.2–0.6. With a space density of 4.4 Gpc−3 at z ∼ 0.3, these "green beans" (GBs) are amongst the rarest objects in the universe. We are witnessing an exceptional and/or short-lived phenomenon in the life cycle of active galactic nuclei (AGNs). The main focus of this paper is on a detailed analysis of the GB prototype galaxy J2240−0927 (z = 0.326). Its NLR extends over 26 × 44 kpc and is surrounded by an extended NLR. With a total [O iii] λ5008 luminosity of (5.7 ± 0.9) × 1043 erg s−1, this is one of the most luminous NLRs known around any type-2 galaxy. Using VLT/XSHOOTER, we show that the NLR is powered by an AGN, and we derive resolved extinction, density, and ionization maps. Gas kinematics is disturbed on a global scale, and high-velocity outflows are absent or faint. This NLR is unlike any other NLR or extended emission line region known. Spectroscopy with Gemini/GMOS reveals extended, high-luminosity [O iii] emission also in other GBs. WISE 24 μm luminosities are 5–50 times lower than predicted by the [O iii] fluxes, suggesting that the NLRs reflect earlier, very active quasar states that have strongly subsided in less than a galaxy's light-crossing time. These light echoes, or ionization echoes, are about 100 times more luminous than any other such echo known to date. X-ray data are needed for photoionization modeling and to verify the light echoes.
Export citation and abstract BibTeX RIS
1. INTRODUCTION
Narrow-line regions (NLRs) are a common sight in active galaxies and explained by the unified active galactic nucleus (AGN) model (see, e.g., Antonucci 1993; Bianchi et al. 2012). UV/X-ray emission from the central black hole engine photoionizes the interstellar medium (ISM) over large distances but may be shielded by neutral gas or dust absorbers. The prototype NLR consists of two ionization cones (e.g., in NGC 4151 and NGC 5252), which may fragment into several individual clouds (Evans et al. 1993; Tsvetanov et al. 1996). In Seyfert-2 galaxies, NLR sizes are a few hundred pc and can extend up to 5 kpc (Bennert et al. 2006a). Emission-line FWHMs are on the order of several hundred km s−1 and are often richly structured.
Extended NLRs (ENLRs) were first described by Unger et al. (1987) and have been found around many AGNs since (Durret 1989). They extend over 20 kpc or more and have much lower luminosities than NLRs. Dynamical FWHMs are low (≲ 50 km s−1), whereas high excitation levels reveal AGNs as ionizing sources. ENLRs usually follow the galactic rotation.
Extended emission line regions (EELRs; Fosbury 1989) are found mostly around radio-loud QSOs and have similar sizes as ENLRs but very different characteristics. Fu & Stockton (2009) find compact clouds with low line widths (<100 km s−1) but moving with high velocities (∼500 km s−1). Dynamically chaotic structures are common, and morphological links to the host galaxies are absent. EELRs are likely the result of a merger, kick-starting the QSO engine that ionizes the gas and blasts it into the outer surroundings.
Lintott et al. (2009) find a cloud of ionized gas 20 kpc outside IC 2497. Lacking an apparent AGN in the host galaxy, it is interpreted as a light echo from a very active earlier AGN phase. Indeed, radio observations by Rampadarath et al. (2010) reveal hidden AGN features. Keel et al. (2012a) present 154 galaxies with similar detached clouds at redshifts z ≲ 0.1, finding evidence for short periods of high AGN activity. During these periods, the luminosity can change by up to four orders of magnitude, as has been shown by Schawinski et al. (2010) and Keel et al. (2012b) for IC 2497. However, timescales inferred by Keel et al. (2012a) are too short to be explained by current accretion models. Such light echoes therefore provide new insights into the onset and shutdown processes of QSO activity on scales of a galaxy's light-crossing time (∼104–105 years).
Galaxy formation models predict AGN-driven large outflows needed to explain properties of the ISM and massive galaxies (e.g., Springel et al. 2005). NLRs on galaxy scales have been found in powerful radio galaxies (HzRGs; Nesvadba et al. 2008) and ultraluminous infrared galaxies (ULIRGs; Harrison et al. 2012) at high redshifts (z = 2–3). Line widths of 700–1400 km s−1 and large offsets with respect to the systemic redshift emphasize the outflow character in the ULIRGs with highest [O iii] luminosity.
Cardamone et al. (2009) present a new class of emission-line galaxies, dubbed "green peas" (GPs), referring to their compact size and color in gri images. In a sample of 112 GPs, they find 80 star-forming galaxies, 9 Seyfert-1, 10 Seyfert-2, and 13 transition objects (showing both AGN and star formation features). GPs with AGN-like emission characteristics have so far not been studied beyond the initial identification and analysis in Cardamone et al. (2009), and differences to NLRs in other Seyfert galaxies have not been found.
It is now established that supermassive black holes (SMBHs) reside in the centers of massive galaxies, which must have hosted an AGN in their past. Consequently, mergers of galaxies must also lead to the coalescence of SMBHs. Indeed, numerous wide-separation binary AGNs are known; however, systems with kpc separations (Shen et al. 2011; Comerford et al. 2012) or less (Rodriguez et al. 2006; Fabbiano et al. 2011) are rare and have to be verified carefully. Simulations of the pre-coalescence state of SMBH mergers (such as Hopkins & Quataert 2010; Khan et al. 2012; Van Wassenhove et al. 2012) do not predict extraordinary NLR properties.
In CFHT/Megaprime data, we serendipitously discovered J224024.1−092748 (hereafter J2240), a peculiar galaxy at z = 0.326 with GP colors. Due to its large angular extent of 4'' × 7'', J2240 was not included in the GP sample of Cardamone et al. (2009). In this paper, we show that it is fundamentally different from GPs. We have identified two dozen similar objects in SDSS-DR8 (Aihara et al. 2011) with redshifts z = 0.1–0.7, after removing 95% spurious detections. We refer to these galaxies with large and ultraluminous NLRs as "green beans" (GBs). GBs display a previously unknown phenomenon in the life of AGNs, and we explore different formation mechanisms.
The paper is structured as follows. In Section 2, we present observational data for J2240, followed by our two-dimensional (2D) spectral analysis method in Section 3. We discuss the physical properties obtained from this analysis in Section 4, after which we present our sample of similar galaxies extracted from the Sloan Digital Sky Survey (SDSS). We discuss our findings and summarize in Section 6. Throughout this paper, we assume a flat standard cosmology with Ωm = 0.27, ΩΛ = 0.73, and H0 = 70 h70 km s−1 Mpc−1. The relation between physical and angular scales at z = 0.326 is 1 0 = 4.76 h−170 kpc. Error bars represent the 1σ confidence level. All wavelengths stated are vacuum wavelengths.
2. OBSERVATIONS
2.1. CFHT Imaging
Deep ugriz CFHT/Megaprime data (Table 1) were obtained by us through Opticon proposal 2008BO01 at 2008 September 20 in excellent conditions to study a supercluster of galaxies at z = 0.45. Further details about these data can be found in Schirmer et al. (2011). J2240 at z = 0.326 is a serendipitous discovery in these images, extending over 7'' × 4''. With a pixel scale of 0186 and 07 image seeing the galaxy is well resolved. It has irregular morphology and peculiar colors similar to that of a GP (see Figure 1), with the exception of very low u-band flux (u − r = 4.06 mag). K-corrections and luminosities were calculated using kcorrect v4.2 (Blanton & Roweis 2007). Most noteworthy are a bright non-stellar nucleus in a disk-like body reminiscent of a spiral galaxy and a half-detached cloud about 12 kpc southwest of the nucleus. The cloud extends over 8 × 18 kpc.

Figure 1. Left: CFHT/Megaprime gri color image of J2240. The photometric redshift of the fainter reddish galaxy to the left of the nucleus categorizes it as a background source, whereas the galaxy below with the prominent spiral arm has the same spectroscopic redshift as J2240. The dashed line shows the orientation of the VLT/XSHOOTER slit, running (from the upper left to the lower right) through the Disk and the nucleus, and then through the Cloud. Right: complex appearance of the [O iii] λ5008 line in the VLT/XSHOOTER spectrum (log scaled, continuum subtracted). Some of the features discussed in this paper are marked. The dashed line indicates the spatial position of the nucleus.
Download figure:
Standard image High-resolution imageTable 1. Characteristics of the CFHT/Megaprime Data and J2240 Photometry
| Band | texp (s) | Seeing | Mlim | MAB | L |
|---|---|---|---|---|---|
| u | 4250 | 099 |
25.0 | 21.80 | −19.4 |
| g | 3000 | 076 |
25.4 | 19.02 | −21.3 |
| r | 5000 | 066 |
25.4 | 17.74 | −22.2 |
| i | 6000 | 057 |
25.2 | 18.71 | −23.0 |
| z | 5000 | 073 |
23.3 | 17.89 | −23.2 |
Notes. The limiting magnitudes represent the 5σ completeness limit for non-stellar sources. Luminosities are dereddened.
Download table as: ASCIITypeset image
We hereafter refer to these two components simply as the "Disk" and the "Cloud," without implying any properties about their physical shape. Spectroscopic observations reveal a much more complex picture, as can be seen in the right panel of Figure 1. We refer to the central ±4 kpc encompassing the nucleus as the "Center."
Figure 1 shows a fainter reddish galaxy with a photometric redshift of z = 0.37 ± 0.06, projected 20 east of the nucleus of J2240. A second galaxy with a prominent spiral arm is located 45 to the southeast and has the same spectroscopic redshift as J2240 (z = 0.326).
2.2. Spectroscopy
2.2.1. VLT/FORS2
The redshift of J2240 and its classification as a Seyfert-2 galaxy were first secured using a VLT/FORS2 (Appenzeller et al. 1998) spectrum (ESO DDT proposal 286.A-5027). Our data were reduced using a custom pipeline. In short, all spectra were overscan corrected, debiased, flat-fielded, rectified, and sky subtracted. Flux calibration and correction for telluric absorption were based on the central white dwarf of the Helix Nebula (NGC 7293) and the atmospheric transmission model for Paranal (Patat et al. 2011). A technical summary of the characteristics of our spectroscopic data sets is given in Table 2.
Table 2. Characteristics of the Spectroscopic Data
| Instrument | Grating | λmin–λmax | texp | Seeing | Slit | λ/Δλ | Spatial | Spectral | Date |
|---|---|---|---|---|---|---|---|---|---|
| (nm) | (s) | ('') | ('') | Sampling | Sampling | ||||
| ('' pixel−1) | (Å pixel−1) | ||||||||
| FORS2 | 300V | 445–865 | 2400 | 1.0 | 1.0 | 300 | 0.25 | 3.34 | 2010 Dec 19 |
| XSHOOTER | UVB | 300–560 | 1160 | 0.55 | 1.0 | 4350 | 0.16 | 0.15 | 2011 Jun 13 |
| VIS | 550–1020 | 1140 | 0.55 | 0.9 | 7450 | 0.16 | 0.15 | 2011 Jun 13 | |
| NIR | 1020–2480 | 1200 | 0.55 | 0.9 | 5300 | 0.21 | 0.60 | 2011 Jun 13 | |
| GMOS | R400 | 450–870 | 300 | >1.0 | 1.0 | 1900 | 0.14 | 1.36 | 2012A |
Notes. GMOS data were taken throughout the 2012A semester.
Download table as: ASCIITypeset image
2.2.2. VLT/XSHOOTER
Using VLT/XSHOOTER (Vernet et al. 2011), we obtained a spectrum (proposal 287.B-5008) of the full 300–2500 nm range, with a slit position angle of 43 5 (same as for FORS2) aligned along the major axis of the extended emission in Figure 1. Spectral (spatial) resolutions are 5–20 (1.5) times higher than with FORS2. The data were pre-processed using the XSHOOTER pipeline (Modigliani et al. 2010). Flux calibration (using the spectrophotometric standard Feige 110), continuum subtraction, and further data processing were done using custom-made software. Since the slit width for the flux standard was much wider than the one for the science target, and the standard was calibrated with a different flat field, the absolute calibration is only known to within a constant factor. We determine the latter from the FORS2 spectrum, over which we have full control and consistent calibrators. After correction, FORS2 and XSHOOTER fluxes are indistinguishable within their noise in the common wavelength area. The full XSHOOTER spectrum is shown in Appendix A, Figure 12.
2.2.3. Gemini/GMOS
We used Gemini-South/GMOS (proposal GS-2012A-Q-83) to create a redshift survey of further GB candidates (Section 5). Given that our targets are bright and our only aim was to detect bright emission lines, this campaign was designed as a backup program to be executed in bad seeing and cirrus. Most data were taken in the second half of the 2012A semester. At the time of writing observations are still ongoing.
2.2.4. Correction for Galactic Extinction
J2240 (GLAT = −54°) lies in an area of faint galactic cirrus. However, the particular line of sight is unaffected and has E(B − V) = 0.059 mag and R = 3.3 (Schlegel et al. 1998). The extinction models for R = 3.3 and the "standard" R = 3.1 are indistinguishable in the wavelength range relevant for this paper (Fitzpatrick 1999). Hence, we use the R = 3.1 extinction curve (Cardelli et al. 1989; Osterbrock & Ferland 2006). Correction factors are between 1.09 for (redshifted) [S ii] λλ 6718, 33 and 1.25 for [Ne v] λ3427.
3. 2D SPECTROSCOPIC ANALYSIS METHOD
J2240 is a dynamically complex system and well resolved in our data. A proper description requires models of the NLR's 3D structure and knowledge about the radiation field, serving as input for photoionization codes. This is beyond the scope of this discovery paper, as we are currently lacking the X-ray data to characterize the ionizing spectrum, as well as integrated field unit (IFU) observations of the entire object. Nevertheless, applying 2D emission line diagnostics, we can obtain information going beyond single global values for, e.g., extinction or density. To do so, we have to bring all emission lines to a common reference system.
The emission lines are complex (see, e.g., the right panel of Figure 1). We have therefore decided to use a parameter-free approach and work with the line images directly, as compared to modeling with multiple Gaussians. For example, a superposition of up to four Gaussians of different widths is needed to describe any spatial line scan through the Cloud, which fragments into several smaller condensations. Parts of the lines are in addition asymmetric, generally making a Gaussian parameterization a bad choice in this case.
3.1. Theoretical [O iii] and [N ii] doublet line ratios
The theoretical value of the [O iii] λλ4960, 5008 intensity ratio has long been underestimated compared to observations (e.g., 2.89 by Galavis et al. 1997). Leisy & Dennefeld (1996) found 3.00 ± 0.08, consistent with high-S/N measurements of other nebulae, and encouraged improved theoretical calculations to be carried out.
Storey & Zeippen (2000) calculate precise line ratios for [O iii] λλ4960, 5008 and homologous cases (such as [N ii] λλ6550, 86, [Ne iii] λλ3869, 3968, or [Ne v] λλ3347, 3427) using relativistic corrections. The intensity ratios of these lines are independent of temperatures and densities in typical astrophysical nebulae, as the two lines come from a common upper level. The intensity ratio will change only if the lines become optically thick. This is unlikely, however, given their low absorption coefficients. If the density was high enough to cause significant optical depth, collisional de-excitation would suppress these lines in the spectrum (P. J. Storey 2012, private communication). The ratio of the transition probabilities between [O iii] λ5008 and [O iii] λ4960 is found to be 3.013, which translates into a flux ratio of 2.984 by multiplying with the wavelength ratio 4960/5008. This value has been confirmed (2.993 ± 0.014) by Dimitrijević et al. (2007) based on 34 SDSS AGN spectra. Likewise, for [N ii] λ6586 and [N ii] λ6550, the flux ratio evaluates to 3.05.
We use these theoretical values to deblend the Hα–[N ii] line complex and to verify our spectral analysis method with the [O iii] doublet.
3.2. Re-projection of Lines
As a first step we subtract the continuum, which we linearly interpolate across an emission line based on the adjacent ∼100 pixels on both sides. The resulting continuum is smoothed in dispersion direction with a 100 pixel wide median kernel and subtracted from the original spectrum. We do not correct line fluxes for potential stellar absorption, as the equivalent widths are high (several 100 Å to more than 1000 Å).
In the second step we extract images centered on each line of interest, encompassing their full spatial extent and 2.3 Å in width. These images are then stretched by a factor of λline/λHβ to correct for the wavelength dependence of the velocity broadening. We choose Hβ as the reference frame, as it is in the middle between the blue [O ii] and red [S ii] lines. The re-projection onto Hβ also includes a two-fold binning along the dispersion direction to increase the S/N. We retain an effective spectral resolution of R ∼ 3800.
Third, we have to register the line images such that they overlap precisely. Distortion correction by the XSHOOTER pipeline left no measurable spatial offsets of the continuum recorded in the UVB and VIS arms. Registering the lines in dispersion direction is more difficult, as their individual appearances are different. Fortunately, almost all lines exhibit traces of the ENLR with low line widths, which we use as a reference mark. Remaining lines are registered using other common features. In this way registration in dispersion direction is accurate to ∼1 pixel, well within the oversampled spectral resolution.
Lastly, we smooth with a 2 pixel wide Gaussian kernel, cut off at a radius of 2 pixel. Prior to smoothing, the highest and lowest pixels in the aperture are rejected. In this way we suppress spurious noise features, which can get strong when calculating ratios with small denominators.
Error maps from the XSHOOTER pipeline are treated analogously and fully propagated.
3.3. Deblending Close Line Pairs
Velocity broadening in J2240 leads to some overlap between Hα and [N ii] λλ6550, 86 and within the [S ii] λλ6718, 33 doublet. While the bright cores of these lines are well separated, their fainter wings overlap. We deblend them as follows.
For the Hα–[N ii] complex (Figure 2, panel 1) we have to perform several steps. First, we smooth Hβ with a 2 pixel wide Gaussian and subtract it from Hα after multiplication with 3.0. The latter is near the average Case B hydrogen ratio (3.08) in Seyfert-2 AGNs (Gaskell & Ferland 1984). In this way we remove about 90%–95% of the Hα contamination in the [N ii] lines (Figure 2, panel 2), thus preparing a first guess of the [N ii] doublet. Some residual Hα is still present, occurring due to variable extinction in J2240 (Section 4.1).

Figure 2. Deblending the Hα–[N ii] line complex (panel 1). Panel 2: a rescaled and smoothed version of Hβ is subtracted, and [N ii] λ6586 extracted within a closed polygon line. Panel 3: [N ii] gets smoothed and subtracted from the original line complex, leaving Hα isolated. Panel 4: Hα gets smoothed and subtracted from the original line complex, leaving the [N ii] doublet.
Download figure:
Standard image High-resolution imageNext we extract [N ii] λ6586 within a closed polygon line and then smooth and subtract it from the original Hα-[N ii] complex. We also divide it by 3.05 (Section 3.1), shift it to the position of [N ii] λ6550, and subtract it once more. The [N ii] doublet has thus been removed, and we have prepared a clean Hα line (Figure 2, panel 3). Lastly, we smooth the Hα image and subtract it from the original line complex, leaving the final [N ii] pair.
For [S ii] λλ6718, 33 we use a different approach, as this doublet is reasonably separated with little overlap. We define non-overlapping closed polygonal lines of identical shape around both lines. Pixels within each polygon line are smoothed with a small Gaussian kernel and subtracted, leaving the other line in the doublet isolated.
Note that our 2D analysis technique used in the following is confined to regions with high S/N. Areas where the [S ii] doublet or Hα and [N ii] overlap are already faint and mostly excluded.
3.4. [O iii] Sanity Check
As shown in Section 3.1, the [O iii] λλ4960, 5008 line ratio is independent over a large range of temperatures and densities. Both lines are strong and uncontaminated and thus serve as a good test case to validate our 2D analysis method. While a constant offset indicates a problem with flux calibration, systematic variations along spatial or spectral directions hint at bad registration of the two lines, or problems in the data processing or extinction correction.
Figure 3 shows that in our data the [O iii] ratio is constant within errors, thus validating our 2D analysis method. Utilizing the area where jλ5008/jλ4960 uncertainty is less than 0.03, we initially estimated a line ratio of 3.169 ± 0.012 (including full extinction correction; see Section 4.1). This is inconsistent with the theoretical value and amongst the highest values measured by Dimitrijević et al. (2007). Retracing our processing steps, we identified an unfortunate coincidence causing this discrepancy. The [O iii] λ4960 line is redshifted to 6577 Å, just redward of Hα. Being a white dwarf, the spectrophotometric standard Feige 110 shows a ∼20 Å wide Hα absorption line in the XSHOOTER spectrum. The reference flux values tabulated by Oke (1990), however, are based on a low resolution spectrum (∼5 Å pixel−1), resulting in a measured line width of ∼40 Å. As the [O iii] line is narrow (1.5 Å) compared to the absorption line, we can easily determine a correction factor of 1.075 ± 0.015. The [O iii] intensity ratio then becomes 2.950 ± 0.015. The same effect is present in our FORS2 data (for which a different white dwarf served as flux calibrator), yielding a corrected ratio of 3.01 ± 0.04. No other emission lines are affected.

Figure 3. [O iii] jλ5008/jλ4960 ratio (theoretical value: 2.98) is constant within errors. The black ellipse shows the spatial and spectral scale beyond which data points become statistically independent (same for all other similar plots). The dashed line indicates the spatial location of highest continuum flux (coincident with the nucleus). The origin of the velocity axis coincides with the location of highest electron density (see Section 4.2).
Download figure:
Standard image High-resolution image4. RESULTS FROM THE SPECTRAL ANALYSIS
We use bright emission lines to determine extinction, electron density and temperature, abundance, and ionization. These diagnostics are well understood for various ionizing spectra. However, as the X-ray spectrum of J2240 is not available, uncertainties do exist in some of the parameters derived. We address this where applicable.
4.1. Internal Extinction
4.1.1. Method
The extinction of a line with intrinsic intensity Iλ0 is given as Iλ = Iλ0 e−C f(λ), where C is a constant and f(λ) parameterizes the extinction curve of the ISM and depends on the chemical and physical properties of the dust grains. Using the observed and intrinsic (before attenuation by dust) intensity ratio of two emission lines, the color excess is
We use the Hα/Hβ ratio and the standard R = 3.1 model (Cardelli et al. 1989) to calculate the reddening in J2240. This requires knowledge of the intrinsic value of Hα/Hβ, which equals ∼2.87 for Case B conditions in a typical H ii region. In the harder radiation field of an AGN collisional excitation of Hα becomes important, increasing the ratio to ∼3.08. However, it depends strongly on LX/Lopt and the slope of the X-ray spectrum, as well as on metallicity (Gaskell & Ferland 1984). The intrinsic line ratio can get as low as 2.6 for high metallicities, or as high as 3.4 for low metallicities.
We take the metallicity into account in an explicit manner. Starting with a fixed intrinsic Balmer line ratio of 3.0, we compute an initial metallicity estimate following Storchi-Bergmann et al. (1998). Once a first guess for the metallicity is available, we update the intrinsic Balmer line ratio using an interpolation function to the values given in Gaskell & Ferland (1984). Pixel values now deviate individually from the initial guess of 3.0. With the improved extinction map we calculate a new abundance map. Convergence is achieved rapidly (less than 1% relative change for most pixels) after the first iteration; thus, we stop after a second iteration. Different starting point values of 2.7 and 3.2 for the intrinsic Balmer ratio converge to the same solution.
4.1.2. The Reddening Map
The resulting reddening map is shown in the right panel of Figure 4. It is based on the Seyfert 1 model X-ray spectrum of Gaskell & Ferland (1984). Adopting their ν−1 power-law continuum (dashed line in their Figure 1), E(B − V) is systematically reduced by 0.16 mag, but the structures seen remain unchanged. We work with the higher extinction model for the rest of this paper, commenting on the effects of a different X-ray spectrum where applicable.

Figure 4. Observed Hα/Hβ ratio (left) and the reddening inferred (right).
Download figure:
Standard image High-resolution imageThe dust in J2240 is distributed unevenly. The area between the nucleus and the Cloud is highly reddened with E(B − V) = 0.5–0.7 mag. It is independent of radial velocity and likely caused by a large cloud of foreground dust in J2240. On the opposite side of the nucleus (above the dashed line in Figure 4), we find that reddening grows as a function of radial velocity (blueshifted components are less reddened than redshifted ones). In this area, the dust appears to be evenly embedded within the NLR (where it can survive; see Laor & Draine 1993), causing E(B − V) to increase from 0.05 to ∼0.7 mag as we look deeper into J2240. Other Seyfert-2 galaxies show similar (global) extinction values of E(B − V) = 0.1–0.6 for their NLRs (Ho et al. 1997; Rhee & Larkin 2005).
4.1.3. Error Analysis
The intrinsic Hα/Hβ ratio is affected by collisional excitation and metallicity. The latter was taken into account in Section 4.1.1. As an additional test, we artificially increase the metallicity by ΔZ = +0.2 Z☉, which reduces E(B − V) by 0.031 ± 0.005 mag only (see also Section 4.3). The largest uncertainty comes from the unknown X-ray properties of the AGN. Using the values obtained by Gaskell & Ferland (1984) for a Seyfert-1 X-ray spectrum, we get a mean intrinsic Balmer ratio of 2.75 with small spatial variations of 0.02–0.05 mag. This is below the commonly adopted value of 3.08 for Seyfert-2 galaxies and may be real or the result of our ignorance about the true X-ray properties. The ν−1 power-law continuum from Gaskell & Ferland (1984) yields 3.11 ± 0.04 for the intrinsic line ratio, reducing E(B − V) by 0.12 mag, which is small compared to the reddening values up to 0.7 mag. We thus conclude that the observed variations in Hα/Hβ are indeed due to dust and not caused by spatial variations in abundance (see also Section 4.3) or the ionizing spectrum.
Another source of uncertainty is the accuracy with which the Balmer lines have been registered. A Gaussian fit to the continuum profiles near Hα and Hβ yields an uncertainty of 0.15 pixels in the spatial direction. Being conservative, we shift Hα with respect to Hβ by 0.3 pixels in both spatial directions. This introduces a maximum gradual change in E(B − V) of 0.32 mag between +7 kpc and −3 kpc, about half the observed amplitude of 0.7 mag. Offsetting Hα by ±1 pixel along the spectral direction results in a 0.18 mag change between −200 and +100 km s−1 and no change elsewhere. This highlights the importance of an accurate registration of the Balmer lines. Assuming a worst-case scenario, we found that the observed extinction features (in particular the large dust cloud) prevail. We can thus realistically estimate a maximum registration error in E(B − V) of 0.15 mag at any given position.
Alternatively, E(B − V) can be obtained using Paα/Paβ or other Balmer ratios. However, we cannot use the Paschen series as redshifted Paα is beyond XSHOOTER's NIR arm and the core of Paβ is masked by airglow. Using the Hγ/Hβ ratio has the advantage of not being affected by collisional excitation (and thus the AGN spectrum). Unfortunately, redshifted Hγ falls in the area where XSHOOTER's optical dichroic distinguishes between the UVB and VIS arms, significantly reducing the flux, and making flux calibration unreliable. The S/N of the Hδ line is too low to perform a 2D analysis. Integrating over the whole lines, both Hδ and Hγ favor an average reddening of E(B − V) = 0.52–0.61 mag, 0.2–0.3 mag higher than predicted by Hα. This can be explained if stellar absorption, for which we do not correct the continuum model, reduces the flux of the fainter Balmer lines by 15%–20%.
Another consistency check is the extinction-corrected [O iii] ratio presented in Section 3.4. The extinction map shows a large area below the nucleus of E(B − V) = 0.5–0.7 mag, embedded in lower values of 0.1–0.2 mag. If this differential extinction was artificial or the [O iii] ratio was left uncorrected, then jλ5008/jλ4960 increases by 0.07 for the highly reddened area (with respect to its surroundings). Such an increase is not found in the data, thus confirming this highly reddened area. This test is not very sensitive, though, as the flux ratio of the relatively close [O iii] doublet is weakly susceptible to differential reddening effects.
4.1.4. Testing Different Dust Models
The composition of dust in the harsh environment of an AGN is still a matter of debate, in particular in view of the unified dusty torus model (e.g., Rhee & Larkin 2005, and references therein). While dust cannot survive inside the broad-line region (Laor & Draine 1993), larger grains prevail in the circumnuclear region farther out, leading to flat extinction curves (gray dust; see, e.g., Maiolino et al. 2001). At larger distances from the central AGN engine, smaller dust grains can survive or are replenished by the partial destruction of larger grains. However, very small grains are disintegrated quickly even at kpc scales (Voit 1992). A large number of distant AGNs and narrow-line quasars show extinction compatible with a dust composition like the one observed in the Small Magellanic Cloud (SMC; Hopkins et al. 2004; Willott 2005). Even steeper extinction curves in AGNs have been found by Crenshaw et al. (2001, 2002) for NGC 3227 and Ark 564 at wavelengths below 4000 Å.
Applying the SMC dust model instead of R = 3.1 causes no significant change to E(B − V) (0.04 mag) as compared to the global variations present in J2240. This is expected since these models differ only slightly at the Hα and Hβ wavelengths (Cardelli et al. 1989; Fitzpatrick 1999). Both foreground dust (close to J2240) and dust embedded in the NLR exist in J2240. Observing lines farther into the UV or the IR will allow us to step beyond the standard R = 3.1 model and constrain the actual physical properties of the dust in J2240, facilitated by the bright emission lines.
4.2. Electron Temperature and Density
The electron temperature, Te, for the medium-ionization zone can be obtained from [O iii], utilizing
(Osterbrock & Ferland 2006). Similar relations exist for [Ne iii] ((jλ3869 + jλ3968)/jλ3343) and [N ii] ((jλ6548 + jλ6583)/jλ5755). For electron densities ne ≲ 105 cm−3, these temperature probes become independent of ne. As the redshifted (and weak) [N ii] λ5755 line is lost in the atmospheric O2 absorption feature at 7630 Å, we cannot use [N ii] to probe the lower ionization regions. Instead, we use [O ii] jλ3727/jλ7321, 32 and Equation (21) from Peimbert (1967), together with an average electron density of 200 cm−3 for the Disk.
Due to the weak auroral lines, we cannot reconstruct 2D temperature maps, yet we can still measure global values. Using [O iii], we find 17,100 K and 14,700 K for the Disk and the Cloud, respectively (Table 3). [Ne iii] results in 18,100 K for the Disk, whereas the Cloud is undetected in [Ne iii] λ3343 and only a lower limit of 11,000 K can thus be obtained. Errors account for the significant blending of [Ne iii] λ3343 with the much brighter [Ne v] λ3347. For the lower ionization zone we find 13,000 K from [O ii].
Table 3. Electron Temperatures
| Line | Tdisk | Tcloud |
|---|---|---|
| (103 K) | (103 K) | |
| [O iii] | 17.1+0.8−0.7 | 14.7+4.8−2.0 |
| [Ne iii] | 18.1+3.2−2.4 | 15.1+∞−4.1 |
| [O ii] | 13.0+1.4−1.3 | ... |
Download table as: ASCIITypeset image
The [S ii] jλ6718/jλ6733 ratio depends on ne and Te. We use Te = 13, 000 K as obtained from [O ii] for the low-ionization zone. Results are shown in the lower right panel of Figure 5. The Disk has significantly higher density than the rest, starting from 150–200 cm−3 and peaking in a dynamically cool spot 1 kpc northeast of the nucleus, where ne reaches 650 cm−3. Decreasing (increasing) Te by 5000 K raises (lowers) the peak density by 130 (80) cm−3, which is significantly less than the density variations measured. These features are thus real and not a consequence of our simple assumption of constant temperature.

Figure 5. Top row: oxygen abundance, estimated using the two strong-line diagnostics of Storchi-Bergmann et al. (1998). Bottom left: ionization parameter. Bottom right: [S ii] line ratio (map) and electron density (contours) for Te = 13, 000 K. Contour levels are drawn at ne = 150, 300, 450, and 600 cm−3.
Download figure:
Standard image High-resolution imageThe Cloud is in the low-density limit of the [S ii] probe; thus, only an upper limit of ne < 50 cm−3 can be inferred. The area northeast of the nucleus, where J2240 is brightest in [S ii], has lower density than the Disk (80–150 cm−3).
4.3. Abundance and Ionization
Abundances for H ii regions are often obtained with the strong-line method (Kewley & Dopita 2002). A more accurate approach is the direct method (e.g., implemented in the nebular/ionic task in IRAF based on the five-level atomic model by De Robertis et al. 1987). Abundance determinations for NLRs are notoriously more difficult. Storchi-Bergmann et al. (1998) have developed an empirical strong-line method based on NLRs with embedded H ii regions. The underlying assumption is that both the H ii regions and the NLR share the same metallicity; thus, a calibration for NLRs without discernable H ii regions can be inferred. Storchi-Bergmann et al. (1998) offer two methods, one based on [N ii]/Hα and [O iii]/Hβ, and the other on log![$({\rm [{\rm O}\,{\scriptsize{II}}]/[{\rm O}\,{\scriptsize{II}}]})$](https://content.cld.iop.org/journals/0004-637X/763/1/60/revision1/apj455000ieqn3.gif) and log
and log![$({\rm [{\rm N}\,{\scriptsize{II}}]/H\alpha })$](https://content.cld.iop.org/journals/0004-637X/763/1/60/revision1/apj455000ieqn4.gif) . The latter depends on extinction correction as [O ii] and [O iii] are not neighboring lines. In this work we also included their correction term for electron density.
. The latter depends on extinction correction as [O ii] and [O iii] are not neighboring lines. In this work we also included their correction term for electron density.
Both methods yield similar results of Z = (0.45–0.55)Z☉, the second one with slightly larger values of Δlog(O/H) = 0.03 (Figure 5). Abundances are enhanced by about 0.1 toward the nucleus and in the Cloud and appear to increase systematically with growing radial velocity. Such sub-solar metallicities are uncommon in NLRs, as has been shown by Groves et al. (2006). Their study of 23,000 Seyfert-2 galaxies in SDSS yielded only ∼40 galaxies of evidently low metallicity. Using their prescription, we obtain average metallicities of 0.9 Z☉ (from [N ii]/[O ii] and [O iii]/[O ii]) and ∼2.0 Z☉ (from [N ii]/Hα and [O iii]/Hβ).
A large uncertainty in the abundance determination stems from the assumptions made about the ionizing spectrum. Ludwig et al. (2012) report that changes to the slope and shape of the spectrum can change metallicities from sub-solar level to several times the solar value. As we do not know the intrinsic X-ray spectrum of the AGN in J2240, the true absolute value of the abundance remains unknown. The variations measured in the abundance map may be real but can be altered by local variations of the X-ray spectrum filtered by the inhomogeneous ISM. We therefore do not consider abundances further in this work, leaving this task to future photoionization modeling once X-ray data become available. Also, note that increasing the metallicity from 0.5 Z☉ to several Z☉ changes the intrinsic Hα/Hβ Balmer ratio from 2.75 to about 2.60–2.65, increasing E(B − V) only marginally.
Once the metallicity is known, we can derive the ionization parameter U (Figure 5, lower left) from [O iii]/[O ii] (Kewley & Dopita 2002). Applying the best-fit relation from Penston et al. (1990), we find similar structures and values (not shown). Using [O iii]/[O ii] requires ne < 103 cm−3 (Komossa & Schulz 1997), since mixed-in higher densities will lead to an overestimation of U. This condition is well met (Figure 5, lower right).
We find two strong peaks in the ionization map located 0.0–2.0 kpc northeast of the nucleus (above the dashed line in Figure 5) and spread over a radial velocity range of 210 km s−1. The spatial offset is coincident with that measured for the density peak and can either indicate the location of a second, deeply buried AGN or simply be the result of a shock or interaction with a jet. Two weaker peaks are found 4.5 and 8 kpc southwest of the nucleus (below the dashed line), significant on the 3σ and 2σ level, respectively. The first is located between the nucleus and the Cloud in the area with highest dust extinction, whereas the second is centered in the Cloud and redshifted by 110 km s−1 with respect to the highest ionization peak.
The error map for U takes into account measurement errors, but not the uncertainty in metallicity. To test the latter, we lower the metallicity by ΔZ = 0.1 Z☉, which corresponds to going from high- to low-metallicity areas. Log U then decreases by maximally 0.12, much less than the absolute variations observed (Δ(log U) = 0.85), and less than the direct measurement errors. Note that while the mentioned variations in U are real, its absolute value should not be taken at face value, as the absolute metallicity is unknown.
4.4. Continuum
J2240 exhibits a relatively flat continuum with the brightest parts at 4500–7000 Å rest-frame wavelengths (Appendix A, Figure 12). With an extent of about 8 kpc in the 2D spectra, continuum radiation emerges from a more compact region than the line emission. A significant fraction of the continuum is stellar, as we clearly see the Ca ii H absorption line at 3934 Å. Ca ii K at 3969 Å is superimposed by [Ne iii] and H emission. The 4000 Å break is hardly visible in the data.
No continuum can be seen in the 2D spectra at the position of the Cloud. However, we can still test for the presence of continuum flux by integrating over all wavelengths excluding emission lines. The S/N obtained is sufficient to reconstruct broadband continuum spectral energy distributions (SEDs) for the Disk and the Cloud (Figure 6). While their colors are similar above 5500 Å, the Cloud is bluer than the Disk at shorter wavelengths. Both a nebular continuum and a different stellar population can cause this.

Figure 6. By integrating the faint continuum over large wavelength ranges, excluding emission lines, we probe the photometric properties of the continuum. The Cloud is bluer than the Disk.
Download figure:
Standard image High-resolution imageWe find a symmetric continuum profile within 5 kpc of either side of the nucleus (Figure 7). In the northeast the profile is nearly exponential with a Sersic index of 0.85 ± 0.04 and a disk scale length of 3.0 ± 0.1 kpc. In the southwest, we see a long tail through the Cloud (the bump at −10 kpc in Figure 7), traceable over 18 kpc.

Figure 7. Total flux as a function of slit position, normalized to unity, for a selection of emission lines and the continuum (shaded areas and thick line, respectively). The Cloud forms the bump at −10 kpc. Low-ionization lines ([O i], [O ii], [N ii], and [S ii]) peak at 3.7 kpc from the nucleus, whereas medium-ionization lines ([O iii] and [Ne iii]) reach a maximum at 1 kpc. Hα runs between the two. The widths of the various lines are overplotted (thin lines). While Hα, [O iii], and [S ii] λλ6718, 33 have similar FWHMs, [O ii] is significantly broader. Error bars (not shown) for the velocity profiles are 10–15 km s−1.
Download figure:
Standard image High-resolution image4.5. Velocities and an ENLR
The velocity FWHMs (parameter-free, directly measured in the line images) as a function of slit position for selected lines are displayed in Figure 7, together with their intensity profiles. While the latter for low- and medium-ionization lines are well distinguished (bright and dark gray areas) within 8 kpc of the nucleus, the velocity profiles are similar. The notable exception is [O ii], whose FWHM is consistently larger by 222 ± 15 km s−1 but otherwise has the same shape. This is a result of the absence of compact bright cores in [O ii], which are found in, e.g., Hα, [O iii], and [S ii] (see Figure 11).
Defining the maximum velocity as the point where the line profile drops to 20% of the maximum emission, we find vmax = (0.98 ± 0.05) × FWHM averaged over Hα, [O iii], and [S ii]. We find little variation (±0.14) along the slit. Highest velocities are blueshifted 1200 km s−1.
The [O ii] velocity profile is remarkably flat between −14 kpc and +8 kpc, with line widths of 534 ± 69 km s−1. Hα, [O iii], and [S ii] vary between 200 and 550 km s−1 and drop to less than 100 km s−1 for the largest nuclear distances. J2240 is embedded in an ENLR that corotates with the disk (albeit slower; the northeast part is redshifted by 195 km s−1 with respect to southwest). The ENLR's low-luminosity, low line width, high-excitation state (![${\rm log([{\rm O}\,{\scriptsize{III}}]/H}\beta)=0.86\hbox{--}0.98$](https://content.cld.iop.org/journals/0004-637X/763/1/60/revision1/apj455000ieqn5.gif) ) and rotation are typical (Unger et al. 1987; Durret 1989).
) and rotation are typical (Unger et al. 1987; Durret 1989).
Deep GMOS imaging reveals a halo stretching 60 kpc from the nucleus (Figure 8, top panel). To distinguish between a stellar tidal stream and ionized gas, we use a 3 hr GMOS long-slit spectrum through a 15 slit, aligned along the major halo axis (at a position angle of 71°). Unresolved [O iii] λ5008 is detected out to 42 kpc (Figure 8, bottom panel); thus, an additional underlying stellar population can currently not be ruled out. The ENLR has a minimum diameter of 70 kpc.

Figure 8. Deep GMOS r-band image (top) of J2240 revealing the extended halo. The dashed line indicates the position angle of the spectrum (bottom, showing the [O iii] line), the two arrows out to which radius we detect [O iii]. Black contour lines are logarithmically spaced. Contours (white) of the CFHT image (Figure 1) and the XSHOOTER slit (dotted line) are overplotted for reference.
Download figure:
Standard image High-resolution image4.6. Starburst or an AGN?
So far we have anticipated that the NLR is powered by an AGN. Observational evidence is presented in the following.
Hypothetically assuming that all line emission is powered by stars, we can estimate the necessary star formation rate using the extrapolated total line fluxes from Table 4 and the scaling relations from Kennicutt (1998). The result equals 290 ± 60 M☉ yr−1, needed to explain the Hα flux, 20 times higher than that in an average star-forming GP galaxy (Cardamone et al. 2009).
Table 4. Fluxes (Corrected for Galactic Extinction) and Luminosities of J2240 for Selected Emission Lines, and Their Relative Strength with respect to Hβ
| Line | Islit | Lslit | Ltot | I(λ)/I(Hβ) |
|---|---|---|---|---|
| (× 10−16 erg s−1 cm−2) | (× 1040 erg s−1) | (× 1040 erg s−1) | ||
| Hα | 338.6 ± 2.8 | 1200.2 ± 9.9 | 2280 ± 360 | 4.25 |
| Hβ | 79.7 ± 1.2 | 282.4 ± 4.1 | 536 ± 85 | 1.00 |
| Hγ | 31.6 ± 0.9 | 111.9 ± 3.3 | 212 ± 34 | 0.40 |
| Hδ | 12.8 ± 0.3 | 45.6 ± 1.1 | 86 ± 13 | 0.16 |
| He i λ5877 | 7.6 ± 0.1 | 26.7 ± 0.6 | 50 ± 8 | 0.09 |
| He ii λ4687 | 10.6 ± 0.4 | 37.5 ± 1.3 | 70 ± 11 | 0.13 |
| He i λ10833 | 23.7 ± 0.8 | 84.0 ± 2.9 | 159 ± 25 | 0.30 |
| [O i] λ6302 | 44.0 ± 0.6 | 156.0 ± 2.1 | 296 ± 46 | 0.55 |
![${\rm [{\rm O}\,{\scriptsize{II}}]}\,\lambda$](https://content.cld.iop.org/journals/0004-637X/763/1/60/revision1/apj455000ieqn7.gif) 3727 3727 |
296.6 ± 4.1 | 1051.3 ± 14.7 | 1997 ± 316 | 3.72 |
| [O iii] λ4364 | 10.3 ± 0.5 | 36.4 ± 1.9 | 69 ± 11 | 0.13 |
![${\rm [{\rm O}\,{\scriptsize{ III}}]}\,\lambda$](https://content.cld.iop.org/journals/0004-637X/763/1/60/revision1/apj455000ieqn9.gif) 5008 5008 |
841.5 ± 14.0 | 2982.7 ± 49.7 | 5667 ± 899 | 10.56 |
![${\rm [{\rm N}\,{\scriptsize{ II}}]}\,\lambda$](https://content.cld.iop.org/journals/0004-637X/763/1/60/revision1/apj455000ieqn10.gif) 6586 6586 |
187.7 ± 1.6 | 665.3 ± 5.5 | 1264 ± 199 | 2.36 |
![${\rm [S\,{\scriptsize{II}}]}\,\lambda$](https://content.cld.iop.org/journals/0004-637X/763/1/60/revision1/apj455000ieqn11.gif) 7618,33 7618,33 |
168.1 ± 1.6 | 595.6 ± 5.4 | 1131 ± 178 | 2.11 |
![${\rm [S\,{\scriptsize{ III}}]}\,\lambda$](https://content.cld.iop.org/journals/0004-637X/763/1/60/revision1/apj455000ieqn12.gif) 9071 9071 |
29.6 ± 0.9 | 104.9 ± 3.1 | 199 ± 32 | 0.37 |
![${\rm [S\,{\scriptsize{III}}]}\,\lambda$](https://content.cld.iop.org/journals/0004-637X/763/1/60/revision1/apj455000ieqn13.gif) 9533 9533 |
107.2 ± 2.6 | 379.8 ± 9.2 | 721 ± 115 | 1.34 |
![${\rm [{\rm Ne}\,{\scriptsize{ III}}]}\,\lambda$](https://content.cld.iop.org/journals/0004-637X/763/1/60/revision1/apj455000ieqn14.gif) 3869 3869 |
56.3 ± 0.9 | 199.6 ± 3.0 | 379 ± 60 | 0.71 |
![${\rm [Ne\,\scriptsize{V}]}\,\lambda$](https://content.cld.iop.org/journals/0004-637X/763/1/60/revision1/apj455000ieqn15.gif) 3427 3427 |
17.4 ± 0.4 | 61.8 ± 1.6 | 117 ± 18 | 0.22 |
![${\rm [{\rm Mg}\,{\scriptsize{ II}}]}\,\lambda$](https://content.cld.iop.org/journals/0004-637X/763/1/60/revision1/apj455000ieqn16.gif) 2799 2799 |
19.5 ± 0.5 | 69.1 ± 1.9 | 131 ± 21 | 0.24 |
![${\rm [{\rm Ar}\,{\scriptsize{ III}}]}\,\lambda$](https://content.cld.iop.org/journals/0004-637X/763/1/60/revision1/apj455000ieqn17.gif) 7138 7138 |
8.9 ± 0.1 | 31.4 ± 0.6 | 59 ± 9 | 0.11 |
Notes. Total values are corrected for slit losses by seeing and for the fact that the slit is smaller than the object. The correction factor used is 1.9 ± 0.3, its uncertainty conservatively estimated.
Download table as: ASCIITypeset image
An AGN can be distinguished from star formation due to its harder radiation field changing the line ratios. Baldwin et al. (1981) present various tools for this purpose. Their BPT diagrams have been further developed by Veilleux & Osterbrock (1987), Kewley et al. (2001), Kauffmann et al. (2003), and Kewley et al. (2006). For J2240, the S/N is good enough to run this analysis on the basis of individual pixels. While the precise locations of the dividing lines between SF, AGNs, LINERs, and composite objects in the BPT plots are still under some debate (Cid Fernandes et al. 2010), the classification of J2240 as AGN is beyond doubt (Figure 10). [O i] λλ6302, 6366 emission across J2240 shows that shock/ionization fronts are present on a global level, emphasizing a powerful AGN.
When fitting the continuum across emission lines, we have ignored stellar absorption as the emission lines are much brighter than the continuum. If stellar absorption was present, Hα and Hβ fluxes are underestimated because of our negligence, driving the data points in the BPT diagrams away from star formation. Assuming a worst-case scenario with (uncorrected) 100% stellar absorption, BPT values are still far outside the star-forming area (see arrows in Figure 10).
While star formation appears to be negligible in J2240, Bennert et al. (2006b) warn that H ii regions can dominate the [O iii] flux at larger nuclear distances. Levenson (2007) and Kauffmann et al. (2003) also show that intense star formation is common in active galaxies. Indeed, a significant starburst can be buried by the [O iii] emission in J2240. However, while we do observe a decrease in log([O iii]/Hβ) with increasing radius (middle left panel in Figure 10), the AGN characteristics remain well preserved. In addition, if the NLR is due to a massive outflow of hot gas, the latter may have disrupted star formation (for an example, see Cano-Díaz et al. 2012).
5. A SAMPLE OF GBs
5.1. Selection and Verification
J2240 has similar colors as typical GP galaxies. Applying the GP filter of Cardamone et al. (2009) to SDSS-DR8, we recover J2240 once we drop their maximum Petrosian radius of 20. Instead, we require a minimum radius of 20 and modified color cuts to select objects with particularly strong [O iii] fluxes (g − r > 1.0). Ninety-five percent of the objects found are spurious or have corrupted photometry (the latter in particular near R.A. = 355 ± 5 and decl. = 60 ± 10; see examples in Appendix A, Figure 13). If in doubt, we downloaded the original SDSS FITS images and created the color images ourselves. In 100% of these cases, the galaxies turn out to have normal colors or be artifacts.
Our SQL query for objects with 0.12 < z < 0.35 (where [O iii] falls into the r band) is shown in Appendix B. Shifting each bandpass by one filter toward redder wavelengths (e.g., replacing g − r with r − i, and leaving out the constraints requiring filters redder than the z band), we also select possible candidates at 0.39 < z < 0.69. Contamination by lower redshift star-forming galaxies with strong Hα emission is expected in this higher redshift bin.
Final manual selection results in a sample of 29 candidates (Table 5 and Appendix A, Figure 13). Redshifts and [O iii]/Hβ ratios have been measured with GMOS. All of our low-redshift candidates observed show high [O iii]/Hβ ratios, confirming their AGN character. Broad-line components are absent but not ruled out due to shallow data. Seven galaxies have a Petrosian radius between 24 and 26 and are good examples of GBs with particularly large NLRs. J2240 (listed as Object 016) is larger than any of the other galaxies (Petrosian radius of 35). Object 004 is noteworthy, as it shows a large extension, which indicates ejected matter or tidal interaction. Several GBs exhibit close companions of unknown redshift, indicating that encounters may play a role in the formation of GBs.
Table 5. GB Sample
| ID | Name | SDSS objID | r | Rr | z | ![${\rm log}({{\rm [{\rm O}\,{\scriptsize{ III}}]}}/{{\rm H}\beta })$](https://content.cld.iop.org/journals/0004-637X/763/1/60/revision1/apj455000ieqn18.gif) |
FR | F24 μm | Comments |
|---|---|---|---|---|---|---|---|---|---|
| (mag) | ('') | (mJy) | (mJy) | ||||||
| 001 | SDSS J002016.4−053126 | 1237679077517557845 | 18.3 | 2.1 | 0.334 | 1.305 ± 0.005 | 9.38 | 11.7 | |
| 002 | SDSS J002434.9+325842 | 1237676441460474246 | 18.2 | 2.6 | 0.293 | 1.246 ± 0.003 | ... | 25.4 | |
| 003 | SDSS J011133.3+225359 | 1237666091128914338 | 19.1 | 2.1 | 0.318 | 1.243 ± 0.016 | ... | 23.1 | |
| 004 | SDSS J011341.1+010608 | 1237666340800364769 | 18.5 | 2.6 | 0.281 | 1.043 ± 0.006 | 1.18 | 39.7 | SDSS redshift |
| 005 | SDSS J015930.8+270302 | 1237680284389015833 | 18.9 | 2.6 | 0.278 | 1.194 ± 0.004 | ... | 18.1 | |
| 006 | SDSS J115544.5−014739 | 1237650371555229774 | 17.9 | 2.4 | 0.306 | 1.163 ± 0.006 | undetected | 16.9 | |
| 007 | SDSS J134709.1+545311 | 1237661386529374363 | 18.7 | 2.0 | ... | ... | 3.67 | 5.3 | |
| 008 | SDSS J135155.4+081608 | 1237662236402647262 | 19.0 | 2.1 | 0.306 | 1.161 ± 0.002 | undetected | 25.7 | |
| 009 | SDSS J144110.9+251700 | 1237665442062663827 | 18.5 | 2.2 | 0.192 | 1.086 ± 0.001 | 2.28 | 19.6 | |
| 010 | SDSS J145533.6+044643 | 1237655742407835791 | 18.5 | 2.0 | 0.334 | 1.151 ± 0.003 | undetected | 20.4 | |
| 011 | SDSS J150420.6+343958 | 1237662306730639531 | 18.7 | 2.2 | ... | ... | undetected | 7.6 | |
| 012 | SDSS J150517.6+194444 | 1237667968032637115 | 17.9 | 2.4 | 0.341 | 1.131 ± 0.001 | 4.89 | 49.9 | |
| 013 | SDSS J205058.0+055012 | 1237669699436675933 | 18.6 | 2.6 | 0.301 | 1.163 ± 0.003 | ... | 49.5 | |
| 014 | SDSS J213542.8−031408 | 1237680191506678389 | 19.2 | 2.0 | 0.246 | 1.108 ± 0.004 | ... | 3.2 | |
| 015 | SDSS J220216.7+230903 | 1237680306395415794 | 18.9 | 2.5 | 0.258 | 1.154 ± 0.006 | ... | 24.8 | |
| 016 | SDSS J224024.1−092748 | 1237656538051248311 | 18.3 | 3.4 | 0.326 | 0.960 ± 0.003 | 2.85 | 37.4 | Prototype; J2240 |
| 017 | SDSS J230829.4+330310 | 1237680503434445439 | 19.1 | 2.0 | 0.284 | 1.258 ± 0.010 | ... | 13.9 | |
| ID | R.A. (J2000) | Decl. (J2000) | i | Ri | z | ![${\rm log}({{\rm [{\rm O}\,{\scriptsize{ III}}]}}/{{\rm H}\beta })$](https://content.cld.iop.org/journals/0004-637X/763/1/60/revision1/apj455000ieqn19.gif) |
FR | F24 μm | Comments |
| (mag) | ('') | (mJy) | (mJy) | ||||||
| 018 | SDSS J015629.0+174940 | 1237679459756015771 | 19.2 | 2.1 | ... | ... | ... | 5.7 | |
| 019 | SDSS J080001.8−095841 | 1237676676082173676 | 18.9 | 2.5 | 0.402 | 1.232 ± 0.010 | ... | 14.7 | |
| 020 | SDSS J090015.7+604704 | 1237663530800382081 | 16.9 | 2.6 | 0.082 | ... | 178.71 | 25.2 | H ii region |
| 021 | SDSS J091353.4+601748 | 1237651274038837416 | 18.0 | 3.1 | 0.477 | 1.141 ± 0.0027 | 1.36 | 31.7 | |
| 022 | SDSS J110140.5+400423 | 1237661966349893812 | 18.2 | 2.6 | 0.456 | 1.296 ± 0.014 | 17.38 | 18.8 | N. Zakamska |
| 023 | SDSS J113818.9+060620 | 1237654606942699779 | 18.8 | 2.2 | 0.499 | 1.132 ± 0.009 | undetected | undetected | |
| 024 | SDSS J122140.0+190442 | 1237667914346791043 | 18.6 | 2.9 | 0.542 | 1.163 ± 0.010 | undetected | 30.3 | |
| 025 | SDSS J161836.4−040942 | 1237668567712924379 | 17.6 | 2.2 | 0.211 | 0.155 ± 0.008 | undetected | 268.4 | H ii region |
| 026 | SDSS J172145.7+632233 | 1237671938731213392 | 18.9 | 2.2 | ... | ... | undetected | 5.9 | |
| 027 | SDSS J191354.1+621147 | 1237671938736848903 | 18.8 | 2.2 | ... | ... | undetected | 32.7 | |
| 028 | SDSS J230901.0+035742 | 1237679004484370740 | 18.5 | 2.3 | 0.485 | 1.188 ± 0.007 | undetected | 12.8 | |
| 029 | SDSS J234130.3+031727 | 1237678598088425669 | 17.3 | 2.4 | 0.145 | 0.612 ± 0.014 | 851.95 | 121.8 | H ii region; LINER |
| strong [O i], weak [O iii] | |||||||||
Notes. Rr, i are the SDSS Petrosian radii. All but two redshifts originate from our GMOS pilot survey. High values of ![${\rm log}({\rm [{\rm O}\,{\scriptsize{ III}}]}/{\rm H\beta })\sim 1$](https://content.cld.iop.org/journals/0004-637X/763/1/60/revision1/apj455000ieqn20.gif) confirm the presence of an AGN. The last two data columns contain VLA FIRST radio and WISE 24 μm fluxes. No number indicates that the source is either outside the FIRST survey area or no spectra have been taken. Object 016 is the main target analyzed in this paper. Spectroscopic data for Object 022 were taken from archival GMOS-North observations, executed by N. Zakamska (Gemini program GN-2010B-C-10).
confirm the presence of an AGN. The last two data columns contain VLA FIRST radio and WISE 24 μm fluxes. No number indicates that the source is either outside the FIRST survey area or no spectra have been taken. Object 016 is the main target analyzed in this paper. Spectroscopic data for Object 022 were taken from archival GMOS-North observations, executed by N. Zakamska (Gemini program GN-2010B-C-10).
Download table as: ASCIITypeset image
In the higher redshift sample we find 12 objects, of which 7 have spectra taken. Five galaxies have genuine AGN spectra, whereas two are star-forming galaxies at lower redshifts for which Hα was mistaken as [O iii] by our SQL filter. All objects covered by the Very Large Array (VLA) Faint Images of the Radio Sky at Twenty-Centimeters (FIRST) catalog (White et al. 1997) are either non-detected or radio-quiet.
Apart from Object 015, all spectroscopically confirmed GBs have [O iii] lines extending over 15–20 kpc or more (Appendix A, Figure 14). Given integration times of only 300 s, the real extent of the NLRs is likely to be larger. In addition, the limited availability of guide stars is restricting the slit position angle, which consequently cannot be well aligned with the target's major axis in a majority of cases.
5.2. Mid-IR Properties
Type-2 AGNs are dusty objects with significant optical extinction. The WISE (Wright et al. 2010) mid-infrared fluxes can be used as a proxy for AGN activity, as mid-IR emission correlates with X-ray brightness over a wide range of luminosities (Asmus et al. 2011; Mason et al. 2012). In particular, the W4 filter at 24 μm is not affected by dust absorption. As a comparison sample we choose the 887 type-2 quasars from Reyes et al. (2008), 104 of which have similar redshifts as our GBs (0.25 ⩽ z ⩽ 0.35). The de-redshifted mid-IR spectra of our GBs are very red, following a power law with index 〈aλ〉 = 1.99 ± 0.35, showing that the emission is likely of nuclear origin as compared to star formation. The 104 type-2 comparison quasars also have red spectra, albeit with a lower slope of 〈aλ〉 = 1.59 ± 0.43. The null hypothesis that both samples have the same parent SED distribution is rejected on the 5% level based on the Kolmogorov–Smirnov test. The 24 μm luminosities of the GBs and the comparison sample are similar, though; thus, GBs might simply be particularly dusty objects.
In Figure 9, we plot ![$L_{\rm [{\rm O}\,{\scriptsize{III}}]}$](https://content.cld.iop.org/journals/0004-637X/763/1/60/revision1/apj455000ieqn21.gif) versus
versus  for the obscured quasars of Reyes et al. (2008) and Greene et al. (2011). As our spectroscopic survey has not been flux calibrated, we have no direct measurements of
 ![$L_{\rm [{\rm O}\,{\scriptsize{ III}}]}$](https://content.cld.iop.org/journals/0004-637X/763/1/60/revision1/apj455000ieqn23.gif) for the GBs. However, we do know that the [O iii] equivalent widths are comparable to that of J2240, and that the spectra are generally similar. Assuming that [O iii] λ5008 contributes the same fraction to the total r-band flux as for J2240 (37%), we overplot the GBs in Figure 9. The 24 μm luminosities for GBs and quasars in the same redshift range (black dots) are indistinguishable. However, [O iii] luminosities of the GBs are 5–50 times higher than expected from their mid-IR emission. Since the latter mainly originates from the compact dusty torus, this indicates that the current AGN activity is too low to explain the NLR luminosity. The NLR may therefore reflect an earlier, more active state that subsided significantly in much less than a light-crossing time. We return to this light echo hypothesis below.
for the GBs. However, we do know that the [O iii] equivalent widths are comparable to that of J2240, and that the spectra are generally similar. Assuming that [O iii] λ5008 contributes the same fraction to the total r-band flux as for J2240 (37%), we overplot the GBs in Figure 9. The 24 μm luminosities for GBs and quasars in the same redshift range (black dots) are indistinguishable. However, [O iii] luminosities of the GBs are 5–50 times higher than expected from their mid-IR emission. Since the latter mainly originates from the compact dusty torus, this indicates that the current AGN activity is too low to explain the NLR luminosity. The NLR may therefore reflect an earlier, more active state that subsided significantly in much less than a light-crossing time. We return to this light echo hypothesis below.

Figure 9. [O iii] λ5008 vs. WISE 24 μm luminosities. GBs are shown by asterisks, and the red triangles represent the luminous obscured quasars studied by Greene et al. (2011). The other data points show the type-2 AGN sample from Reyes et al. (2008) for three different redshift bins, with black dots covering the same redshift range as GBs. At a given  , GBs have 5–50 times higher
 ![$L_{\rm [{\rm O}\,{\scriptsize{III}}]}$](https://content.cld.iop.org/journals/0004-637X/763/1/60/revision1/apj455000ieqn25.gif) than other type-2 AGNs.
than other type-2 AGNs.
Download figure:
Standard image High-resolution image6. DISCUSSION
6.1. Main Observational Facts
6.1.1. AGN Character and Morphology
The galaxy-wide and ultraluminous NLR in J2240 is powered by an AGN, heating the medium- and low-ionization zones to 15, 000–18, 000 K and 13,000 K, respectively. The Disk has higher temperature than the Cloud. The flux of the auroral lines is sufficiently high to facilitate more reliable temperature maps with deeper data. Studying the profile of the continuum emission within ±5 kpc of the nucleus, we find a disk-like Sersic index of 0.85 and a disk scale length of 3 kpc, hence ruling out an elliptical host galaxy.
We find large amounts of dust as expected for type-2 AGNs. Dust is distributed within the NLR and also in a large foreground patch (Figure 4). Reddening variations are high, and small systematics due to the unknown X-ray spectrum may still be present. BPT line diagnostics (Figure 10) do not reveal significant star formation.

Figure 10. BPT diagrams. Top: the solid and dotted lines represent the model division between the two galaxy types and its uncertainty (Kewley et al. 2001). Data points show individual pixels in the NLR; their mean errors are indicated. The NLR is evidently powered by an AGN. The maximum possible effect of stellar absorption is indicated by the arrows. Middle and bottom: spatially and spectrally resolved BPT diagrams, based on the same data points as shown in the top row.
Download figure:
Standard image High-resolution imageJ2240 is dynamically complex, showing seven distinct [O iii] peaks scattered over 30 kpc and 700 km s−1 (Figure 11). A rotational component is well detected in the Disk. A typical ENLR stretches over 26 kpc northeast and 42 kpc southwest from the nucleus (Figure 8). It can be seen in all strong lines such as [O ii], [O iii], [Ne iii], [N ii], [S ii], and Hα, showing that J2240 is embedded in a rotating and quiescent, yet highly excited, bubble of gas.

Figure 11. Top 4 rows: selected emission lines (continuum subtracted, and projected to a common reference frame) in J2240. A logarithmic scaling (different between lines) has been chosen for better visualization. The dashed line indicates the spatial position of the nucleus (position of highest continuum level), i.e., the spatial direction is oriented along the vertical axis. Wavelength increases from left to right. Spatial and velocity scales are indicated in the upper left panel. The area displayed for each line is slightly larger than that used for the 2D spectral analysis plots, in order to show more details. Bottom: for comparison, we show a linearly scaled larger part of the spectrum before continuum subtraction, centered on [O ii] λ3727. This gives an idea about the strength and extent of the emission lines (see also Appendix A, Figure 12).
Download figure:
Standard image High-resolution image6.1.2. Shock Fronts and Jets
Electron density (lower right in Figure 5) shows significant fluctuations. While the Cloud is mostly in the low-density limit of the [S ii] probe, ne rises sharply to 650 cm−3 in the center. This central peak has a smaller FWHM (100 km s−1) than that of emission lines (200–500 km s−1), and it is offset by 1 kpc from the nucleus. Several blueshifted and redshifted secondary peaks exist within ±3 kpc of the nucleus, the redshifted ones forming a chain where velocity increases with nuclear distance. Peaks also exist at larger separation in the Cloud. Shock fronts, interactions with a jet, or mergers may cause the peaks. Indeed, [O i] λ6302 is seen throughout the NLR, verifying the global presence of shocks or ionization fronts. Since J2240 is radio-weak, strong constraints for a jet are currently unavailable. The barely resolved radio contours in the VLA FIRST data are tentatively elongated along the major axis; thus, a jet may explain at least some of the NLR shape.
The ionization parameter is strongly enhanced in the center and dynamically broader than the density. The highest ionization values are offset with respect to the nucleus by a similar amount as that observed for ne. A blueshifted secondary peak is found near the nucleus with a relative velocity of −120 km s−1, together with two more ionization peaks toward the Cloud, one of which is in the area of highest extinction. Relative velocities are +20 and +180 km s−1. These secondary peaks may be the result of shocks or point toward a second AGN, which may be either deeply buried or merely missed by our long-slit observation.
6.1.3. Globally Disturbed Gas Kinematics
The [O ii] velocity profile is flat with FWHM = 534 ± 69 km s−1, and its peak coincides with the nucleus. Other lines, such as Hα, [O iii], and combined [S ii] λλ6718, 33, have almost identical profiles and larger variations in width than [O ii] (200–550 km s−1; Figure 7). The largest FWHMs of these lines are found 1–3 kpc northeast of the nucleus, where the medium-ionization lines are bright, and ne and U the highest. The Cloud shows a secondary maximum in FWHM, and a smaller one exists between the Cloud and the nucleus. All velocity profiles drop to FWHM ≲ 50 km s−1 beyond a 10–14 kpc radius, typical for an ENLR. Within that radius, maximum velocities (taken at 20% of the line profile) are nearly the same as the measured FWHM. Velocities exceed 1000 km s−1 near the nucleus, but these components are rather weak. Figure 7 shows that neither the gas emission nor its velocity follows the stellar/continuum emission. Therefore, the gas in J2240 is kinematically disturbed out to 10–14 kpc radius.
6.1.4. GB Pilot Survey
Our ongoing spectroscopic pilot survey of GB candidates has confirmed at least 18 galaxies with NLRs 15–20 kpc in size, and those covered by the VLA FIRST survey are all radio-quiet. Thirty percent of the GBs have close neighbors with yet unknown redshifts. In several cases, [O iii] emission is dynamically perturbed. High-resolution spectroscopy in better seeing conditions than currently available may reveal systems with dynamic complexities as high as in J2240. All confirmed GBs are type-2 AGNs, as broad-line components have not been identified. Upper limits to the fluxes of possible broad-line regions were not obtained as the spectra were taken in non-photometric conditions and no flux standards were observed. [O iii] luminosities in GBs are on average one order of magnitude higher than expected from mid-IR emission, a sign of recently subsided AGN activity.
6.2. Comparison with other NLRs
6.2.1. Space Density and [O iii] Luminosities
In the 14,500 deg2 of SDSS-DR8, we find only 17 GBs of 0.12 < z < 0.36. This redshift range corresponds to a comoving volume of 11.1 Gpc3. The space density of GBs is thus 4.4 Gpc−3, consistent with the upper end of the [O iii] luminosity function for type-2 quasars published by Reyes et al. (2008). We have neglected the 0.39 < z < 0.69 range in this consideration due to the contamination with star-forming galaxies.
With 26 × 44 kpc the NLR in J2240 is much larger than typical NLRs (0.1–5 kpc; Bennert et al. 2006a). Approximately 99% of the [O iii] flux is contained within a radius of 25 kpc. J2240 falls within the scatter of the [O iii] size–luminosity relation observed for other Seyfert galaxies and quasars (Schmitt et al. 2003; Greene et al. 2011). However, its total [O iii] λ5008 luminosity of 5.7 × 1043 erg s−1 is between 2 and 30 times higher than the maximum such value in the AGN samples of Bongiorno et al. (2010), Georgantopoulos & Akylas (2010), and LaMassa et al. (2011). It also exceeds the [O iii] luminosities of the high-z ULIRGs of Harrison et al. (2012) by factors of 2–12. It is one of the brightest objects amongst the 887 type-2 quasars of Reyes et al. (2008). More luminous objects are only known at much higher redshifts, such as 2QZ J002830.4−281706 at z = 2.4 with ![$L_{\rm [{\rm O}\,{\scriptsize{ III}}]}=2.6\times 10^{44}$](https://content.cld.iop.org/journals/0004-637X/763/1/60/revision1/apj455000ieqn26.gif) erg s−1 (Cano-Díaz et al. 2012). The [O iii] luminosities of the other GBs in our sample have so far only been estimated from their broadband fluxes, but we showed that they must also be in the range of several 1043 erg s−1.
erg s−1 (Cano-Díaz et al. 2012). The [O iii] luminosities of the other GBs in our sample have so far only been estimated from their broadband fluxes, but we showed that they must also be in the range of several 1043 erg s−1.
6.2.2. Radio-loud Quasars and ULIRGs
EELRs are often found around radio-loud QSOs (Mrk 1014 is an exception, being radio-quiet). Fu & Stockton (2009) identify compact clouds moving with high velocities (∼500 km s−1), yet having low line widths (30–100 km s−1). They do not show morphological links with their host galaxies. EELRs are probably formed during mergers, which start the QSO engine that ionizes the gas and blasts it into the outer surroundings.
J2240 is different. First, its host galaxy is radio-weak or -quiet. Second, the NLR is at least one order of magnitude brighter than the EELRs described in Fu et al. (2012). Third, J2240 shows high line widths (200–500 km s−1) and low radial velocities (∼200 km s−1), opposite of what we see in EELRs. This may be an effect of incomplete sampling by the long slit, as we might have missed the high-velocity components. Or the gas clouds move predominantly perpendicular to the line of sight such that we do not see the full velocity vector. Lastly, the NLR embeds the host galaxy, thus establishing a morphological link. The same differences are also found when comparing GBs to the galaxy-scale emission line regions observed in powerful radio galaxies and some ULIRGs in the young universe (z = 2–3; Nesvadba et al. 2008; Harrison et al. 2012). This holds for the other GBs as well given our current data.
6.2.3. Current Light Echo Samples
J2240 does not appear to be a typical light echo, such as observed in Hanny's Voorwerp (Lintott et al. 2009), or those described by Keel et al. (2012a). There are similarities, though. First, our BPT diagrams (Figure 10) are fully compatible with the ones of Keel et al. (2012a). Second, interaction with neighboring galaxies is frequently seen in the sample of Keel et al. (2012a), and companions are also observed for the GBs.
Nevertheless, typical [O iii] luminosities for these light echoes are two orders of magnitude lower than for GBs. This is also evident in the SDSS images, which show the stellar body of these galaxies well, whereas for GBs the stellar emission is overwhelmed by the NLR. The survey of Keel et al. (2012a) gets insensitive at redshifts z ≳ 0.1, as the investigated features become too faint. Our GB sample, on the other hand, extracted from the same database, does not reveal any GBs with z < 0.19 (we are sensitive down to z = 0.12). Shifting our SQL filter to even lower redshifts did not reveal further candidates. This is consistent for two reasons. First, a galaxy like J2240 at redshifts less than 0.1 would be conspicuous and likely picked up by earlier surveys. Second, the comoving volume within z < 0.1 is just about 0.3 Gpc3. If the space density of GBs calculated above does not evolve between z ∼ 0.3 and today, then we expect only 0.44 GBs at z < 0.1 within the 14,500 deg2 covered by SDSS-DR8. For comparison, Keel et al. (2012a) find ∼100 galaxies with possible light echoes at z < 0.1.
6.3. Binary AGN or SMBH Merger?
Can the extraordinary properties of J2240 be explained by mergers? We observe globally disturbed gas kinematics, and the highly ionized compact [O iii] sources can indicate multiplicity (Comerford et al. 2012). A tidally distorted neighboring galaxy (Figure 1) makes a multiple merger scenario plausible in which another, possibly gas-rich, galaxy is currently consumed by J2240. As Liu et al. (2012) demonstrate for wide separation binary AGNs, the SMBH accretion rate is increased in such double systems as the merger process funnels more material toward the centers. Log([O iii]) increases by 0.7 ± 0.1 when decreasing the separation from 100 to 5 kpc in these systems. Even closer pairs likely have correspondingly higher [O iii] luminosities.
Are we witnessing some violent process during the final stages of an AGN merger? SMBHs are common in the centers of massive galaxies; thus, galaxy mergers must also result in the coalescence of SMBHs. Accordingly, SMBH or AGN pairs should be common. However, with decreasing separation they are increasingly hard to identify. For example, numerous binary AGNs with separations of tens of kpc are known, yet with 3.6% their fraction among optically selected AGNs is already small (Liu et al. 2011). Shen et al. (2011) and Comerford et al. (2012) find kpc binary AGNs in galaxies with double-peaked [O iii] emission; however, that feature is more commonly caused by gas kinematics and cannot be used as a reliable indicator for AGN binarity (Shen et al. 2011; Fu et al. 2012). X-ray, infrared, or radio observations are needed to confirm such systems.
Only few binary AGNs with even smaller separations are known (Rodriguez et al. 2006; Fabbiano et al. 2011), including a system with subparsec scale and an orbital period of ∼100 years (Boroson & Lauer 2009). Eracleous et al. (2012) report several subparsec candidates, however, emphasizing that long-term monitoring is required to link observed line variability with orbital motions. From the X-ray perspective statistics are equally weak. For example, Teng et al. (2012) find that only 0%–8% of massive mergers actually harbor binary AGNs.
While the observational database is poor, simulations of the pre-coalescence state of SMBH mergers have been carried out (Hopkins & Quataert 2010; Khan et al. 2012; Van Wassenhove et al. 2012). During the orbital decay from kiloparsec to parsec scales no processes are found that explain an AGN flaring up for 104–105 years by 3–4 orders of magnitude. Neither can current accretion models explain a shutdown on similarly short timescales (Schawinski et al. 2010).
It is also unlikely that we are observing some effect or aftermath of the actual coalescence of two SMBHs. Tanaka et al. (2010) calculate the electromagnetic footprint of SMBH mergers. They find an increase of bolometric luminosity of about 10% per year over timescales of years or decades, together with an increase of X-ray hardness. This is, however, much less than the light-crossing time of a galaxy (104–105 years) needed to explain the size and luminosity of our NLRs.
6.4. Light Echoes—Quasars Shutting Down?
The most prominent characteristics of the NLRs in our GBs are their large angular extent and high [O iii] luminosities. Certainly powerful AGNs must be responsible for this, but they are not evident from the SDSS imaging. Either they are deeply buried, or their activity has steeply declined over timescales much less than the light-crossing time of the NLR, in which case we are observing strong light echoes.
To this end we have to show that the current AGN activity is much lower than expected from the overall [O iii] luminosity, and that we are not just observing very obscured nuclei. The best way of doing this is to determine the current X-ray luminosities of GBs and compare them to their [O iii] luminosity. In case of a light echo, the X-ray output will not match the [O iii] luminosity. Using the best-fit relation between LX and ![$L_{\rm [{\rm O}\,{\scriptsize{ III}}]}$](https://content.cld.iop.org/journals/0004-637X/763/1/60/revision1/apj455000ieqn27.gif) for type-2 quasars and Seyferts, we expect LX ∼ 1 × 1044 erg s−1 in the 2–10 keV range (Jia et al. 2012; LaMassa et al. 2009). Note that, since ROSAT is only sensitive to soft energies, even the lowest plausible X-ray absorption is sufficient to account for the non-detection of J2240 by ROSAT. Therefore, we cannot constrain a possible quasar shutdown with the X-ray data currently available.
for type-2 quasars and Seyferts, we expect LX ∼ 1 × 1044 erg s−1 in the 2–10 keV range (Jia et al. 2012; LaMassa et al. 2009). Note that, since ROSAT is only sensitive to soft energies, even the lowest plausible X-ray absorption is sufficient to account for the non-detection of J2240 by ROSAT. Therefore, we cannot constrain a possible quasar shutdown with the X-ray data currently available.
To overcome the lack of X-ray data, we use the mid-IR emission as a proxy for AGN activity, as it is unaffected by dust absorption and emanates from the immediate, parsec-scale AGN environment. Mid-IR emission is tightly correlated with the X-ray luminosity in AGNs (Asmus et al. 2011; Mason et al. 2012). We compare WISE 24 μm luminosities with [O iii] λ5008 luminosities for a large sample of type-2 quasars and GBs. Any change in AGN activity in GBs will need about a galaxy's light-crossing time before it is fully reflected in the NLRs' properties. We find the [O iii] luminosities of the GBs to be 5–50 times higher than expected from the mid-IR emission, strengthening the light echo scenario. If J2240 and the other GBs are indeed light echoes, they are spectacular examples of powerful QSOs currently shutting down.
Note, however, that the [O iii] luminosities of our GBs surpass the highest [O iii] luminosities of the reference type-2 sample at the same redshift (Figure 9). If the light echo interpretation is correct, then one expects quasars at similar redshifts with suitable mid-IR fluxes that have not shut down yet. Only quasars at z ≳ 0.4 match such high fluxes. We think that this is a selection effect, with GBs dropping out of the main SDSS spectroscopic target selection algorithm. The fact that our simple size and color selection of GBs yield about 95% spurious sources shows that the combination of broadband photometry and angular size is quite unusual. The SDSS algorithm designed to select sources for spectroscopic follow-up is optimized for a high success rate, allowing for only 5% unusual sources to be included (see, e.g., Reyes et al. 2008, and references therein). It is therefore not surprising that only one of our GBs has an SDSS-DR8 spectrum.
6.5. Outlook
Considering the intrinsic luminosity that must be responsible for the observed optical NLR, the hard X-ray continuum of AGNs must be directly detectable, provided that the column density is not too great (NH ≲ 1023 cm−2). Even if the central engine is deeply obscured or truly hidden by Compton-thick absorption, the characteristic Fe Kα fluorescence line should be detectable. In this way a binary AGN with a few kpc separation can be directly confirmed through X-ray imaging or the shutdown timescale of the obscured quasars in GBs constrained. X-ray observations will also determine the slope of the ionizing spectrum, improving photoionization models of these NLRs.
Additional work going beyond our simple long-slit spectroscopic analysis has to be done. A realistic model of the NLR requires the use of photoionization codes and knowledge about the X-ray properties. The optical spectral analysis must also be extended to the full body of J2240. Such investigation may reveal ionizing sources missed by the long-slit observation and provide better extinction, temperature, and density maps. In addition, we can better constrain the dynamics, determine the gas mass, and investigate whether GBs have significantly higher gas masses than other obscured quasars showing massive outflows or large NLRs. To this end, GMOS IFU observations in good seeing conditions have been conducted of J2240 in 2012B at the Gemini Observatory. We have also applied for follow-up observations of several more GBs.
M.S. thanks Hai Fu, Tohru Nagao, Evanthia Hatziminaoglou, and Bob Fosbury for helpful discussions on the subjects of AGNs, NLRs, and starbursts, Peter Storey for sharing his insight about atomic spectra, Gyula Jozsa for his input about radio properties, Yuri Beletsky and ESO for great support with the observations, and the anonymous referee for his recommendations.
Author contributions: M.S. discovered J2240; obtained, reduced, and analyzed all data; and wrote the manuscript. R.D., N.L., and C.W. helped with the interpretation and background information. K.H. sifted through the SDSS database, fine-tuned the GB SQL filter, and provided substantial language corrections. N.L. provided the X-ray-related aspects.
The authors recognize and acknowledge the very significant cultural role and reverence that the summit of Mauna Kea has always had within the indigenous Hawaiian community. We are most fortunate to have the opportunity to conduct observations from this mountain. M.S. acknowledges support by the German Ministry for Science and Education (BMBF) through DESY under the project 05AV5PDA/3 and the Deutsche Forschungsgemeinschaft (DFG) in the frame of the Schwerpunktprogramm SPP 1177 "Galaxy Evolution."
This publication makes use of data products from the Wide-field Infrared Survey Explorer, which is a joint project of the University of California, Los Angeles, and the Jet Propulsion Laboratory/California Institute of Technology, funded by the National Aeronautics and Space Administration.
This research has made use of the VizieR catalog access tool, CDS, Strasbourg, France. Funding for the SDSS and SDSS-II has been provided by the Alfred P. Sloan Foundation, the Participating Institutions, the National Science Foundation, the U.S. Department of Energy, the National Aeronautics and Space Administration, the Japanese Monbukagakusho, the Max Planck Society, and the Higher Education Funding Council for England. The SDSS Web site is http://www.sdss.org.
The SDSS is managed by the Astrophysical Research Consortium for the Participating Institutions. The Participating Institutions are the American Museum of Natural History, Astrophysical Institute Potsdam, University of Basel, University of Cambridge, Case Western Reserve University, University of Chicago, Drexel University, Fermilab, the Institute for Advanced Study, the Japan Participation Group, Johns Hopkins University, the Joint Institute for Nuclear Astrophysics, the Kavli Institute for Particle Astrophysics and Cosmology, the Korean Scientist Group, the Chinese Academy of Sciences (LAMOST), Los Alamos National Laboratory, the Max-Planck-Institute for Astronomy (MPIA), the Max-Planck-Institute for Astrophysics (MPA), New Mexico State University, Ohio State University, University of Pittsburgh, University of Portsmouth, Princeton University, the United States Naval Observatory, and the University of Washington.
Facilities: VLT:Kueyen - Very Large Telescope (Kueyen), VLT:Antu - Very Large Telescope (Antu), CFHT - Canada-France-Hawaii Telescope, Gemini:South - Gemini South Telescope
APPENDIX A: FURTHER J2240−0927 DATA
Figure 12 shows rest-frame 1D XSHOOTER Spectra of J2240, uncorrected for galactic extinction. Figure 13 shows a sample of GBs. Some objects found are spurious or have corrupted photometry. Figure 14 shows [O iii] λ5008 (log scaled) for some GBs. The continuum has not been subtracted.

Figure 12. Rest-frame 1D XSHOOTER spectra of J2240, uncorrected for galactic extinction. The black line represents the galaxy center, integrated within ±4.5 kpc of the nucleus. The blue line has been integrated over 7.6 kpc centered on the Cloud. Note the great similarity between the two spectra. For visualization purposes, data have been filtered with a 7 Å wide median kernel; thus, the actual resolution is 48 (12) times higher than shown for the UVB/VIS (NIR) channels, respectively.
Download figure:
Standard image High-resolution image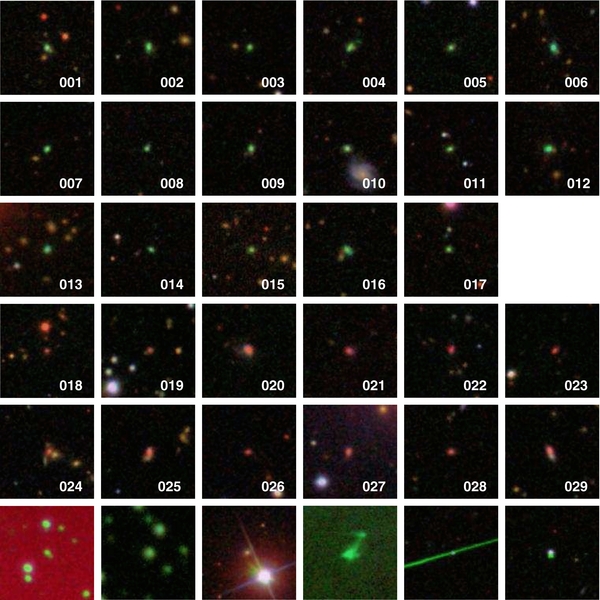
Figure 13. Top three rows: GBs with 0.12 < z < 0.36 (see also Table 5). Object 016 is J2240. Rows 4 and 5: possible GBs with 0.39 < z < 0.69. Bottom row: common false positives; from left to right: bad background, systematic photometry error or bad seeing, bright star/diffraction spike, Herbig-Haro object, satellite, and star near detector edge.
Download figure:
Standard image High-resolution image
Figure 14. [O iii] λ5008 (log scaled) for some GBs. The continuum has not been subtracted.
Download figure:
Standard image High-resolution image
APPENDIX B: SQL QUERY FOR THE GB SELECTION
The following SQL filter was used to retrieve the initial selection of 376 GB candidates from SDSS-DR8,4 including color images for a visual cross-check. Only ∼5% of the objects are retained as genuine GB candidates after visual inspection. We experimented with various parameters, such as the Clean flag, but found that these were prone to exclude genuine objects (amongst others J2240).
SELECT
ra, dec, objID, u,g,r,i,z, petrorad_r,
'<a href=http://cas.sdss.org/dr3/en/tools/chart/navi.asp?ra='+
cast(ra as varchar(10))+'&dec='+cast(dec as varchar(10)) + '>'+
'<img src="http://skyservice.pha.jhu.edu/dr8/ImgCutout/getjpeg.aspx?ra='+
cast(ra as varchar(15))+'&dec='+cast(dec as varchar(15))+
'&scale=0.40&width=120&height=120&opt="/> ' as pic
FROM
Galaxy
WHERE
((r <= 20.5)
and (r >= 17)
and (u - r <= 5)
and (r - i <= -0.2)
and (r - z <= 0.6)
and (g - r >= r - i + 0.5)
and (u - r >= 2.5 * (r - z))
and (g - r > 1.0)
and (petrorad_r > 2)
and (psfmagerr_g < 0.04)
and (psfmagerr_r < 0.04)
and (psfmagerr_i < 0.04))
Footnotes
- *
Based on observations made with ESO Telescopes at the La Silla and Paranal Observatories, Chile. Based on observations obtained with MegaPrime/MegaCam, a joint project of CFHT and CEA/DAPNIA, at the Canada–France–Hawaii Telescope (CFHT), which is operated by the National Research Council (NRC) of Canada, the Institut National des Sciences de l'Univers of the Centre National de la Recherche Scientifique (CNRS) of France, and the University of Hawaii. Based on observations obtained at the Gemini Observatory, which is operated by the Association of Universities for Research in Astronomy, Inc., under a cooperative agreement with the NSF on behalf of the Gemini partnership: the National Science Foundation (United States), the Science and Technology Facilities Council (United Kingdom), the National Research Council (Canada), CONICYT (Chile), the Australian Research Council (Australia), Ministério da Ciência, Tecnologia e Inovação (Brazil), and Ministerio de Ciencia, Tecnología e Innovación Productiva (Argentina).
- 4