


ABSTRACT
Crystalline dust has been observed by infrared spectroscopy around dust-enshrouded asymptotic giant branch stars, in protoplanetary disks, and from some comets. Crystalline materials often have a specific shape related to a specific crystallographic orientation (crystallographically anisotropic shape), which reflects the anisotropic nature of crystals, and their infrared spectral features depend on crystallographically anisotropic shapes. The crystallographically anisotropic shape is thus a potentially powerful probe to evaluate circumstellar dust-forming conditions quantitatively. In order to assess the possibility to determine the crystallographically anisotropic shape from infrared spectra, we calculated mass absorption coefficients for ellipsoidal forsterite particles, the most abundant circumstellar crystalline silicate, elongated and flattened along the crystallographic a-, b-, and c-axes with various aspect ratios in the wavelength range of 9–70 μm. It was found that differences in infrared features caused by various crystallographicaly anisotropic shapes are distinguishable from each other irrespective of the effects of temperature, size, chemical composition, and grain edges of forsterite in the range of 9–12 μm and 15–20 μm. We thus concluded that the crystallographically anisotropic shape of forsterite can be deduced from peak features in infrared spectra. We also showed that the crystallographically anisotropic shapes formed by evaporation and condensation of forsterite can be distinguished from each other and the temperature condition for evaporation can be evaluated from the peak features. We applied the present results to the infrared spectrum of a protoplanetary disk HD100546 and found that a certain fraction (∼25%) of forsterite dust may have experienced high-temperature evaporation (>1600 K).
Export citation and abstract BibTeX RIS
1. INTRODUCTION
Infrared spectroscopy has shown that silicates are commonly present in protoplanetary disks, dust shells around asymptotic giant branch (AGB) stars, and planetary nebulae. Most circumstellar silicates are present as amorphous showing broad infrared features at ∼9.8 and ∼18 μm. Crystalline silicates also exist around some oxygen-rich AGB stars and in protoplanetary disks. Sharp infrared features of crystalline silicates are attributed to stretching or bending of atomic bonds within ordered arrangement of atoms, and peak wavelengths and their relative strengths change with several factors such as chemical composition (Koike et al. 2003, 2006), temperature (Bowey et al. 2001), and size (Min et al. 2005).
The importance of grain shape has also been pointed out to interpret peak wavelengths in infrared spectra of circumstellar crystalline silicates from both laboratory measurements (e.g., Tamanai et al. 2006; Koike et al. 2010) and numerical calculations (Bohren & Huffman 1983; Jäger et al. 1998; Min et al. 2003, 2005, 2008; Mutschke et al. 2009). It has been theoretically shown that grains having different shape distributions, such as uniform sphere, continuous distribution of ellipsoids (CDEs), and Gaussian random spheres, have different infrared features. However, most of these studies have not paid much attention to the relationship between a grain shape and the crystallographic orientation. For instance, grains elongated along different crystallographic axes have been assumed to exist with equal probabilities.
This is not always the case for crystalline phases because a crystal often has a specific shape related to a specific crystallographic orientation that reflects the anisotropic crystal structure and/or growth conditions as well known in the field of mineralogy. Enstatite whiskers in interplanetary dust particles elongating to the crystallographic a-axis (Bradley et al. 1983; Ishii et al. 2008) are one of the examples that reflect an anisotropic formation process.
Current understanding of anisotropy in formation processes of silicates under circumstellar conditions is limited due to the lack of experimental studies. The exceptions are evaporation of forsterite (Mg2SiO4), which is one of the most abundant crystalline silicates observed spectroscopically in circumstellar environments (Yamada et al. 2006; Takigawa et al. 2009; Ozawa et al. 2012) and heterogeneous nucleation and growth of forsterite on metallic substrates (Tsuchiyama 1998).
Takigawa et al. (2009) showed experimentally that forsterite evaporates anisotropically in hydrogen gas as in vacuum (Ozawa et al. 1996; Yamada et al. 2006) and that the anisotropy in evaporation rates depends on temperature and hydrogen gas pressure. They suggested that crystalline forsterite can have a specific shape with a specific relationship to a crystallographic orientation, which is called as "crystallographically anisotropic shape," depending on its evaporation condition. They showed that the change of the crystallographically anisotropic shape of forsterite by evaporation causes observable changes of infrared features.
Tsuchiyama (1998) showed that forsterite condenses on metallic substrates in hydrogen gas to form whiskers elongating along the crystallographic c-axis although condensation conditions in the experiments were not well known quantitatively and further experimental investigations on anisotropy are needed. Fabian et al. (2001) found that forsterite elongating along the c-axis shows a different infrared spectrum from those of sphere and CDEs.
These studies suggest that the crystallographically anisotropic shape of forsterite may record formation conditions of forsterite dust in circumstellar environments quantitatively and that the crystallographically anisotropic shape of forsterite can be obtained spectroscopically. It is therefore important to investigate the infrared spectra of forsterite with various crystallographically anisotropic shapes. However, systematic and exhaustive discussion has not yet been made except for the shapes formed by anisotropic evaporation (Takigawa et al. 2009). In this study, we calculate mass absorption coefficients (MACs) of ellipsoidal forsterite with various aspect ratios along different crystallographic orientations and fully investigate the relationship between crystallographically anisotropic shapes of forsterite and their spectral features. We introduce our calculation method of MACs in Section 2. In Section 3, we show the infrared cross sections along different crystallographic axes and their relationship to the grain shape. In Section 4, we present the MACs for various crystallographically anisotropic shapes and discuss the possibility of observation of forsterite with different crystallographically anisotropic shapes. The effects of grain temperature, chemical composition, grain size, and edges on the grain surface on infrared features are discussed in Section 5. We relate the crystallographically anisotropic shape to the formation condition of circumstellar forsterite in Section 6, and summarize and conclude in Section 7.
2. CALCULATION OF MASS ABSORPTION COEFFICIENTS FOR CRYSTALS WITH VARIOUS CRYSTALLOGRAPHICALLY ANISOTROPIC SHAPES
In order to calculate the MACs of forsterite grains with various crystallographically anisotropic shapes based on Bohren & Huffman (1983), we consider ellipsoids with a single aspect ratio, of which each semi-axis is parallel to one of the principal axes of the dielectric tensor (eigenvectors). We assume that particles are sufficiently smaller than the wavelength of the light (the Rayleigh limit), i.e., sub-μm in size for the infrared light. The polarizability of an ellipsoid in a uniform static electric field parallel to each semi-axis (xj; j = 1, 2, 3) is represented by
where εj is the complex dielectric function of the ellipsoid along the xj-axis, r1, r2, and r3 are the lengths of semi-axes of the ellipsoid, and Lj is a geometrical factor generally represented by
The geometrical factor satisfies 0 < Lj < 1 and L1 + L2 + L3 = 1 (Bohren & Huffman 1983), and a unique set of L1, L2, and L3 is determined for an aspect ratio of r1:r2:r3. For example, the geometrical factors for a sphere are given by (L1, L2, L3) = (1/3, 1/3, 1/3). If the semi-axis along the xj-axis (rj) is much shorter than those along the other axes, Lj approaches to unity, and if rj is sufficiently large relative to other axes, Lj becomes zero. Thus, the geometrical factors for a disk extremely flattened to the x1-, x2-, or x3-axis are (L1, L2, L3) = (1, 0, 0), (0, 1, 0), or (0, 0, 1), and those for a needle exceedingly elongated along the x1-, x2-, or x3-axis are (L1, L2, L3) = (0, 1/2, 1/2), (1/2, 0, 1/2), or (1/2, 1/2, 0).
Because it is reasonable to assume that dust grains are randomly oriented against the static electric fields, the average absorption cross section 〈Cabs〉 is related to αj by
The MAC (κabs) for ellipsoids with a single crystallographically anisotropic shape is given by 〈Cabs〉 per unit mass:
where ρ and V are the density and volume of the ellipsoid. For the dielectric function of εj(ω) = ε'j(ω) + iε''j(ω), κabs is expressed as
κabs has peaks at the wavelengths, where the geometrical factor and the dielectric function satisfy the following relation:

which are called the surface mode resonances.
In the case of isotropic materials (e.g., amorphous silicates and crystals belonging to the cubic system), the dielectric functions along the principal axes are identical (ε1 = ε2 = ε3), and κabs of an isotropic material is thus affected only by its shape, i.e., Lj (Equation (5)). The dielectric functions of anisotropic crystals are not identical to each other; ε1 = ε2 ≠ ε3 for crystals belonging to the tetragonal, hexagonal, and trigonal systems and ε1 ≠ ε2 ≠ ε3 for orthorhombic, monoclinic, and triclinic crystals. Therefore, a spectrum of an anisotropic crystal depends both on the shape and its relationship to the orientations of principal axes of the dielectric tensor, i.e., the crystallographically anisotropic shape controls spectra of anisotropic crystals.
Forsterite, which belongs to the orthorhombic crystal system, has 11, 12, and 8 infrared optical resonances in the wavelength range of 9–70 μm along the three principle axes corresponding to the crystallographic a-, b-, and c-axes, respectively. These resonances are attributed to the stretching and bending of Si–O bonds, the rotation of SiO4 tetrahedra, and the translation of Mg atoms in the crystal structure of forsterite (Iishi 1978). Thus, an infrared spectrum of ellipsoidal forsterite grains with a single crystallographically anisotropic shape can be expressed as superposition of 31 surface-mode resonances.
We calculated αa,b,c for 0 ⩽ La, Lb, Lc ⩽ 1 (Equation (1)) and κabs (Equation (4)) of ellipsoidal forsterite particles, varying the aspect ratios of  and
and  from 100 to 0.01, as a function of wavelength. The optical constants at 100 K, which were experimentally determined by Suto et al. (2006), were used to obtain the dielectric functions of forsterite.
We also calculated κabs for the continuous distributions of ellipsoids for comparison (CDE and CDE2). The spectrum of the CDE gives the ensemble of κabs for all possible crystallographically anisotropic shapes with equal probabilities (Bohren & Huffman 1983), and that of the CDE2 also gives κabs as the ensemble of ellipsoids but with higher presence probabilities of near-spherical particles (CDE2; Fabian et al. 2001). The κabs of the CDE2 has been known to reproduce the laboratory-measured infrared spectra of well-grinded forsterite powder (Koike et al. 2006).
We also calculated κabs of forsterite parallelepipeds with various aspect ratios in the range of 9–12 μm to compare with those of ellipsoids because crystalline grains possibly have crystal surfaces and edges, which may affect the surface modes. The calculation of κabs for the forsterite parallelepipeds was made by the discrete dipole approximation (DDA) method using the FORTRAN program DDSCAT developed by Draine (1988) and Draine & Flatau (1994).
3. RELATIONSHIP BETWEEN ABSORPTION CROSS SECTION AND GEOMETRICAL FACTOR
We show the absorption cross section per unit mass along the crystallographic a-axis (Cabsa/3ρV) in the wavelength range of 8–30 μm for La = 0–1 in Figure 1 as an example. Superposition of Cabsa/3ρV with Cabsb/3ρV and Cabsc/3ρV under the condition of La + Lb + Lc = 1 represents a MAC. For larger L, the peaks shift to shorter wavelengths and the peaks tend to become weaker irrespective of the crystallographic orientation as explained in the following.
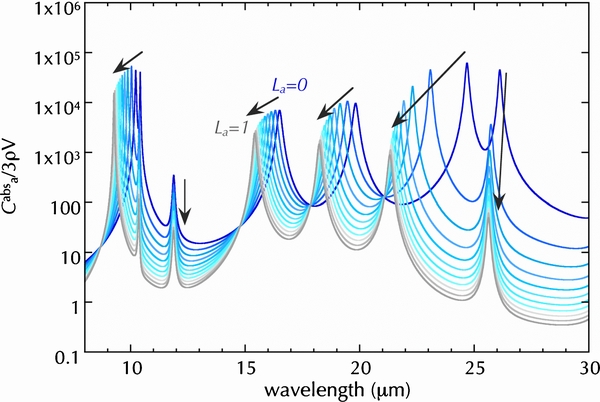
Figure 1. Absorption cross sections per unit mass along the a-axis (Cabsa/3ρV) for L = 0–1 at intervals of 0.1 in the wavelength range of 8–30 μm. The changes of peak wavelengths and intensities with increasing La are shown with arrows.
Download figure:
Standard image High-resolution imageThe dielectric function along one of the principal axes (xj) of the dielectric tensor, i.e., an eigenvalue of the tensor, is represented by the following equation with the assumption of multiple harmonic oscillation as lattice vibrations (Lorentz model):
where ε∞j is the dielectric function representing the contribution from higher wavenumbers, ωT and ωp represent the resonant frequencies of the oscillator and the plasma frequency, respectively, γ is the damping factor, and Nj is the number of optical modes along the xj-axis.
The ε''(ω), the imaginary part of εj(ω), is a bell-shaped curve with a peak at ωT (the transverse optical frequency). The second term of ε'(ω), the real part of εj(ω), has a shape similar to the derivative curve of ε''(ω) at ω ∼ ωT but it approaches to (ωp/ωT)2 and 0 at the limits of ω →0 and ∞, respectively. In the case of Lj = 0, Cabsi has a peak at ωT, where ε''(ω) is maximum. In the case of Lj = 1, a peak appear at a wavelength that minimizes ε'(ω)2 + ε''(ω)2. ε''(ω)2 can be close to zero either at frequencies larger or smaller than ωT, but ε'(ω)2 minimizes only at a frequency larger than ωT. The frequency where Cabsi with Lj = 1 has a peak is called as a longitudinal optical frequency (ωL). Thus, the peak wavelength for L = 1 is always shorter than that for L = 0. In the case of 0 < L < 1, ε'(ω) should be close to 1−1/L in order to satisfy Equation (6), which requires ε'(ω) < 0 and is achieved only at a frequency between ωT and ωL.
Therefore, as Lj increases from 0 to 1, all the peaks for optical resonances belonging to the xj-axis shift to shorter wavelengths, and the intensities of the peaks become weaker in general because ε''(ω) becomes smaller as ω approaches to ωL. We also note that the wavelength range of the peak shift for Lj between 0 and 1 differs from one resonance to another (Figure 1), depending on oscillator parameters.
4. DEPENDENCE OF SPECTRAL FEATURES OF THE MASS ABSORPTION COEFFICIENT ON CRYSTALLOGRAPHICALLY ANISOTROPIC SHAPE
The MACs should vary for different crystallographically anisotropic shapes because the MACs are given as the superposition of Cabsa/3ρV, Cabsb/3ρV, and Cabsc/3ρV, which change with La, Lb, and Lc, respectively. Because the geometrical factors should satisfy the relation of La + Lb + Lc = 1, the change of the crystallographically anisotropic shape makes the peaks attributed to a crystallographic axis shift to one direction and those related to at least one of the other crystallographic axes shift to the opposite direction. This variety of spectra for different crystallographically anisotropic shapes is more complex than those caused by the changes of size, temperature, and chemical compositions, where all the peaks shift unidirectionally to either longer or shorter wavelengths.
In order to discuss the relationship between the MACs and the crystallographically anisotropic shapes of forsterite, we first classify the crystallographically anisotropic shapes into six types depending on the geometrical factor (Figure 2); the a-, b-, and c-needles represent shapes with (La, Lb, Lc) = (<1/3, >1/3, >1/3), (>1/3, <1/3, >1/3), and (>1/3, >1/3, <1/3) that are ellipsoids elongated along the crystallographic a-, b-, and c-axes, respectively, and the a-, b-, and c-disks represent shapes with (La, Lb, Lc) = (>1/3, <1/3, <1/3), (<1/3, >1/3, <1/3), and (<1/3, <1/3, >1/3) that are ellipsoids flattened to the crystallographic a-, b-, and c-axes, respectively. The optical constants along the a-, b-, c-axes at 100 K (Suto et al. 2006) were used in the calculations.
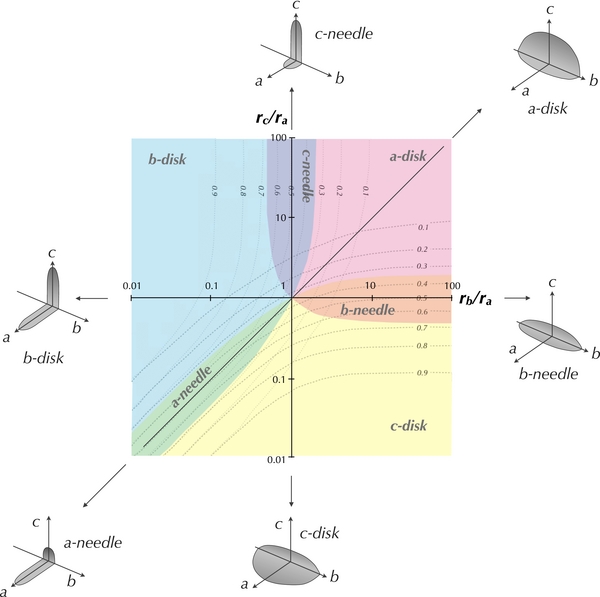
Figure 2. Classification of ellipsoidal forsterite with different crystallographically anisotropic shapes. Six colored regions represent the range of aspect ratios for a-, b-, and c-needles and a-, b-, and c-disks; the a-, b-, and c-needles are the shapes with (La, Lb, Lc) ∼ (<1/3, >1/3, >1/3), (>1/3, <1/3, >1/3), and (>1/3, >1/3, <1/3), and the a-, b-, and c-disks are those with (La, Lb, Lc) ∼ (>1/3, <1/3, <1/3), (<1/3, >1/3, <1/3), and (<1/3, <1/3, >1/3). Dotted and dashed contours represent Lb and Lc, respectively (La is given by La = 1 − (Lb + Lc)). The aspect ratios of crystallographically anisotropic spheroidal forsterite are represented by the x-, and y-axes and the positive-slope diagonal axis. Schematic illustrations of the spheroidal forsterite with different crystallographically anisotropic shapes are also shown.
Download figure:
Standard image High-resolution imageThe characteristic features of the absorption cross sections for different crystallographically anisotropic shapes, i.e., different sets of geometrical factors, are summarized in Table 1 for the five band complexes (the 10, 18, 25, 33, and 69 μm complexes), and the distinguishability of the MACs for different crystallographically anisotropic shapes is described in the following. We also show the MACs for crystallographically anisotropic spheroidal forsterite with various aspect ratios in Figures 3–7. Spectra for the spherical forsterite and the CDE and CDE2 models are also shown for comparison.
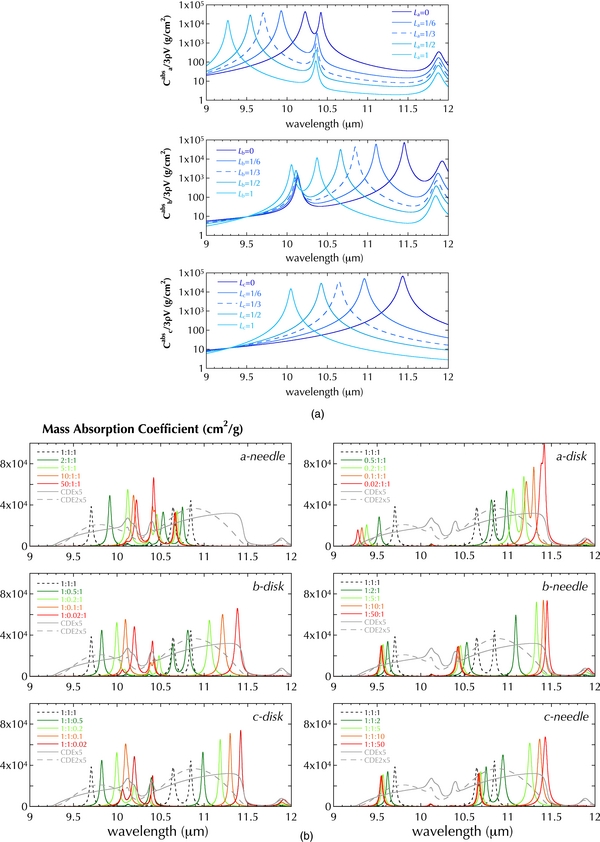
Figure 3. (a) Absorption cross sections per unit mass along the a-, b-, and c-axes (Cabsa/3ρV, Cabsb/3ρV, and Cabsc/3ρV) for La, Lb, and Lc = 0, 1/6, 1/3, 1/2, and 1 in the wavelength ranges of 9–12 μm (left panels: logarithmic scale; right panels: linear scale). Cross sections for Li = 1/3 are shown as dashed curves. The optical constants at 100 K (Suto et al. 2006) were used for the calculation. (b) Mass absorption coefficients (MACs) of ellipsoidal forsterite (a-, b-, and c-needles and a-, b-, and c-disks) with various aspect ratios (ra:rb:rc) at wavelengths of 9–12 μm. The MACs for spherical forsterite and the CDE/CDE2, which are multiplied by 5, are also shown for comparison.
Download figure:
Standard image High-resolution imageTable 1. Peak Wavelengths of the Absorption Cross Sections of Forsterite Grains Along Different Crystallographic Axes (100 K)
| Complex | 10 μm | 18 μm | 25 μm | 33 μm | 69 μm | |||||
|---|---|---|---|---|---|---|---|---|---|---|
| Li > 1/3 | Li < 1/3 | Li > 1/3 | Li < 1/3 | Li > 1/3 | Li < 1/3 | Li > 1/3 | Li < 1/3 | Li > 1/3 | Li < 1/3 | |
| Peaks for Cabsa | 9.3–9.7 | 9.7–10.2 | 15.4–16.0 | 16.0–16.5 | 21.3–21.8 | 21.8–26.7 | ∼31.0 | 31.2–31.4 | ... | ... |
| (μm) | 10.4a | 18.2–18.8 | 18.8–19.8 | ∼25.6 | 25.6–28.7 | ∼33.3 | 33.4–33.8 | |||
| Peaks for Cabsb | 10.4–10.8 | 10.8–11.5 | 17.4–18.2 | 18.2–18.9 | 20.4–21.0 | 21.0–21.5 | ∼32.3 | 32.4–34.4 | ∼68.8 | 68.9–69.1 |
| (μm) | 11.9a | ∼19.7a | ∼22.6 | 22.8–23.8 | ||||||
| ∼24.3 | 24.4–25.2 | |||||||||
| ∼26.6 | 26.7–28.4 | |||||||||
| Peaks for Cabsc | 10.0–10.6 | 10.6–11.4 | 17.3–18.3 | 18.3–19.8 | ∼20.6 | ∼20.8 | 31.5–32.0 | 32.0–34.2 | ... | ... |
| (μm) | ∼22.1 | 22.2–23.8 | ||||||||
| ∼24.2 | ||||||||||
Note. a The peak appears only when Li ∼ 0.
Download table as: ASCIITypeset image
4.1. The 10 μm Complex
The 10 μm complex is useful for spectroscopic studies of dust because it is observable with ground-based telescopes without significant absorption by Earth's atmosphere and infrared features are less affected by dust temperature compared to those at longer wavelengths.
Forsterite has seven optical resonances in this wavelength range (3, 3, and 1 resonances along the a-, b-, and c-axes, respectively). A single clear peak appears for Cabsa at 9.3, 9.7, and 10.2 μm when La is 1, 1/3, and 0, respectively (Table 1; Figure 3(a)). Another peak for Cabsa appears at ∼10.4 μm only when La is close to 0, and the third peak for the resonance at 11.9 μm is negligibly small (Figure 3(a)). The MACs for ellipsoids with La > 1/3 (the a-disk, b-needle, and c-needle) thus show a peak between 9.3 and 9.7 μm reflecting Cabsa, while those for the shapes with La < 1/3 (the a-needle, b-disk, and c-disk) show the peak between 9.7 and 10.2 μm. If the peak appears at ∼10.2 μm, another peak related to Cabsa is expected to appear at ∼10.4 μm because La ∼ 0.
There is a peak for Cabsb at 10.0, 10.8, and 11.5 μm for Lb = 1, 1/3, and 0, respectively, and a relatively weak peak appears at 11.9 μm if Lb ∼ 0 (Table 1; Figure 3(a)). The third peak is negligibly small. The MACs for ellipsoids with Lb > 1/3 (the b-disk, a-needle, and c-needle) has a peak attributed to Cabsb between 10.0 and 10.8 μm, while those for the shapes with Lb < 1/3 (the b-needle, a-disk, and c-disk) show the peak between 10.8 and 11.5 μm and a weak peak at 11.9 μm when Lb ∼ 0.
There is only one resonance along the c-axis in this complex. The Cabsc has a peak at 10.0, 10.6, and 11.4 μm for Lc = 1, 1/3, and 0, respectively (Figure 3(a); Table 1). The MACs for ellipsoids with Lc > 1/3 (the c-disk, a-needle, and b-needle) and with Lc < 1/3 (the c-needle, a-disk, and b-disk) have a peak related to Cabsc between 10.0 and 10.6 μm and between 10.6 and 11.4 μm, respectively.
The shapes with La > 1/3 (the a-disk, b-needle, and c-needle) are thus easily distinguished from those with La < 1/3 because of the presence of a peak between 9.3 and 9.7 μm (Figure 3(b); Table 2). The a-disk and b-needle have a peak at 11.9 μm because of Lb < 1/3, while the c-needle has no peak at 11.9 μm (Figure 3(b); Table 2). The a-disk shows two peaks between 10.6 and 11.5 μm because both Lb, and Lc < 1/3, while the b-needle has a single peak at 10.8–11.5 μm due to Lb < 1/3 and Lc > 1/3.
Table 2. Peak Features of Crystallographically Anisotropic Spheroidal Forsterite Grains (100 K)
| Complex | 10 μm | 18 μm | 25 μm | 69 μm | ||||||||
|---|---|---|---|---|---|---|---|---|---|---|---|---|
| (μm) | 9.2–9.7 | 9.7–10.2 | 10.2–10.6 | 10.6–10.8 | 10.8–11.5 | 11.9 | 15–16 | 16–16.5 | 17–18.3 | 18.3–19.8 | 26.5–29 | 69 |
| a-needle | − | + | + | + | − | − | − | + | + (s)a | + | − | − |
| b-disk | − | + | + | −b | +b | − | − | + | + | + (s) | − | − |
| c-disk | − | + | + | − | + | + | − | + | + | + | + | + |
| a-disk | + | − | − | ++ | + | + | − | − | + (s) | + | + | |
| b-needle | + | − | + | − | + | + | + | − | + (s) | + | + | + |
| c-needle | + | − | − | + | + | − | + | − | + | + (s) | − | − |
Notes. a (s): strongest peak. b MACs of nearly spherical b-disks show peaks at 10.6–10.8 μm and no peak at 10.85–11.5 μm.
Download table as: ASCIITypeset image
Among the shapes with La < 1/3 (the a-needle, b-disk, and c-disk), the c-disk is the only shape that has the 11.9 μm peak (Lb < 1/3) (Figure 3(b); Table 2). The a-needle (Lc > 1/3) and b-disk (Lc < 1/3) are distinguishable in most cases; the a-needle has two peaks between 10.0 and 10.8 μm (one peak is at 10.0–10.6 μm and the other is at 10.4–10.8 μm), while the b-disk has a peak between 10.4 and 10.8 μm and another peak between 10.6 and 11.4 μm (Figure 3(b); Table 2). The exception is when the b-disk is nearly spherical, where it has two peaks between 10.6 and 10.8 μm.
Peak positions of the CDE, where all the possible ellipsoids are present with equal probabilities, strongly reflect the absorption cross sections with specific geometrical factors that show more intense peaks than others. The strong peaks of absorption cross sections appear at wavelengths close to transverse resonances (ωT) along each axis, where Lj is close to 0 (Figure 1). The CDE tends to show peaks attributed to Lj ∼ 0 for each axis, and thus an ellipsoid with a single shape satisfying La + Lb +Lc = 1 cannot reproduce the peak positions for the CDE in general. However, the peak positions of the CDE can be similar to those for a single specific shape with (Li, Lj, Lk) ∼ (0, 0, 1) (i.e., very flattened a-, b-, or c-disk) in some cases, where strong resonances along two axes are present at similar wavelengths or resonances along one axis are much weaker than those along the other axes.
In the 10 μm complex, the CDE spectrum shows four clear peaks at 10.1, 10.4, 11.4, and 11.9 μm. The peaks of CDE at 10.1 and 10.4 μm are attributed to Cabsa for La = 0.08 and 0, respectively, and those at 11.4 and 11.9 μm to Cabb for Lb = 0.02 and 0, respectively (Figure 3(a)). However, the 10.4 and 11.9 μm peaks for Cabsa and Cabsb do not change their peak wavelengths significantly with La and Lb, respectively (Figure 3(a)), and thus the four major peaks of the CDE can be approximately reproduced by Cabsa for La = 0.08 and Cabsb for Lb = 0.02. The peak at 11.4 μm can also be caused by Cabsc for Lc = 0.01 (Figure 3(a)), but no peak appears at 11.9 μm for Cc. Moreover, the single peak for Cabsc becomes weaker and the peak position approaches to 10.1 μm for larger Lc. Thus, the wavelengths of the major peaks of the CDE seem to be reproduced by those for an ellipsoid with (La, Lb, Lc) ∼ (0.08, 0.02, 0.9), where Lc of 0.9 is chosen to satisfy La + Lb + Lc = 1. Such an ellipsoid corresponds to the c-disk with ra:rb:rc ∼ 1:2.5:0.1 (Figure 2), and thus that the peak positions and intensities of the CDE model are apparently similar to those for the very flattened spheroidal c-disk (Figure 3(b)). The spectrum for the CDE2, where nearly spherical shapes are dominantly present, shows peaks similar to that of the spheroidal c-disk with (La, Lb, Lc) ∼ (0.4, 0.4, 0.2). Although both the peak positions of the CDE and the CDE2 may be reproduced by those for specific c-disks, they can be distinguished from the spectrum of dust grains with predominance of the c-disk because the latter should have sharper peaks than the CDEs, which will also be discussed later.
We therefore conclude that the crystallographically anisotropic shape of forsterite can be deduced from peak features in the 10 μm complex.
4.2. The 18 μm Complex
There are two resonances along the a-axis in this complex. Cabsa has one peak at 15.4, 16, and 16.5 μm and another peak at 18.2, 18.8, and 19.8 μm for La = 1, 1/3, and 0, respectively. Shapes with La > 1/3 (the a-disk, b-needle, and c-needle) show two peaks between 15.4 and 16 μm and between 18.2 and 18.8 μm, while those with La < 1/3 (the a-needle, b-disk, and c-disk) have peaks in the ranges of 16–16.5 and 18.8–19.8 μm (Figure 4(a); Table 1).
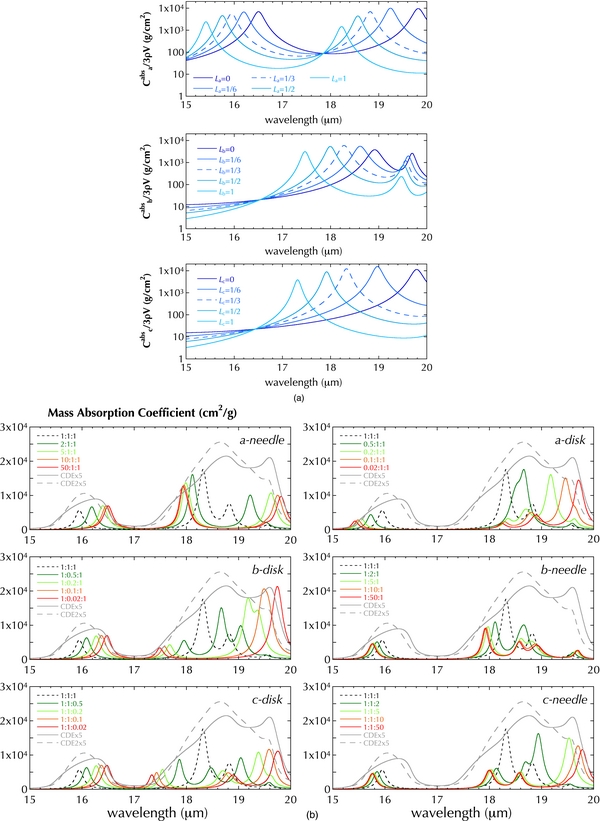
Figure 4. (a) Absorption cross sections per unit mass along the a-, b-, and c-axes for La, Lb, and Lc = 0, 1/6, 1/3, 1/2, and 1, calculated with the optical constants of 100 K (Suto et al. 2006), in the wavelength ranges of 15–20 μm. (b) Mass absorption coefficients (MACs) of ellipsoidal forsterite (a-, b-, and c-needles and a-, b-, and c-disks) with various aspect ratios (ra:rb:rc) at wavelengths of 15–20 μm with the MACs for spherical forsterite and the CDE/CDE2.
Download figure:
Standard image High-resolution imageCabsb shows a peak at 17.4, 18.2, and 18.9 μm for Lb = 1, 1/3, and 0, respectively, in this complex. Another peak appears distinctly at 19.7 μm only when Lb is close to 0. The MACs for ellipsoids with Lb > 1/3 (the b-disk, a-needle, and c-needle) show one peak between 17.4 and 18.2 μm, while those with Lb < 1/3 (the b-needle, a-disk, and c-disk) show a peak between 18.2 and 18.8 μm and another peak at ∼19.8 μm in the case of Lb ∼ 0 (Figure 4b; Table 2).
The c-axis has one optical resonance in this complex. A peak of Cabsc appears at 17.3, 18.3, and 19.8 μm for La = 1, 1/3, and 0, respectively. The MACs for ellipsoids with Lc > 1/3 (c-disk, a-needle, and b-needle) show a peak between 17.3 and 18.3 μm, while shapes with Lc < 1/3 (c-needle, a-disk, and b-disk) show at least one peak between 18.3 and 19.8 μm (Figure 4(b); Table 2).
The diagnostic feature to deduce the crystallographically anisotropic shape in the 18 μm complex is the optical resonant mode between 15.4 and 16.5 μm, which is the only resonance in that wavelength range and is attributed to that along the a-axis. The degree of contribution from the resonance along the a-axis (La > 1/3 or La < 1/3) can be estimated from this resonance (Figure 4(b); Table 2).
For the shapes with La > 1/3 (a-disk, b-, and c-needle), b- and c-needles show a peak between 17.3 and 18.3 μm but a-disk has no peak in that wavelength range. The peak of b-needle (Lb < 1/3 and Lc > 1/3) between 17.3 and 18.3 μm is twice as strong as the peak between 18.3 and 18.9 μm, but that of c-needle (Lb > 1/3 and Lc < 1/3) is comparable to that of the peak between 18.3 and 18.9 μm. This is because the peak between 17.3 and 18.3 μm is due to the optical resonances along the b-axis for Lb > 1/3 and along the c-axis for Lc > 1/3 (Figure 4(a)) and the latter is stronger than the former.
The difference in spectral features between a-needle, b-disk, and c-disk (La < 1/3) is the relative strengths of peaks. The peak of b-disk (Lb > 1/3 and Lc < 1/3) between 18.3 and 19.8 μm is strongest in this complex and twice as strong as that the second largest peak between 16 and 16.5 μm. This is because the resonances of Cabsa and Cabsc for La and Lc < 1/3 (Figure 4(a)) make a single strong peak between 18.3 and 19.8 μm. On the other hand, the peaks between 18.3 and 19.8 μm and between 16 and 16.5 μm are comparable for a-needle and c-disk because Lc of these shapes are larger than 1/3. The a-needle (Lb > 1/3) and c-disk (Lb <1/3) may possibly be distinguished by the strength of the peak between 17 and 18.3 μm, which is strongest for a-needle.
The CDE show peaks at 16.4, 18.8, and 19.6 μm. The peaks at 16.4 and 19.6 μm are those for Cabsa with La ∼ 0.05, and the 18.8 μm peak is that for Cabsc with Lc ∼ 0.2 (Figure 4(a)). Because peaks of Cabsb and Cabsc appear at similar wavelengths and the peaks of Cabsb has weaker than that of Cabsc (Figure 4(a)), the spectral peak positions of CDE can be similar to those for the ellipsoidal b-disk with (La, Lb, Lc) ∼ (0.05, 0.75, 0.20) corresponding to the aspect ratio of ra:rb:rc ∼ 1:0.11:0.4. The spectrum for the CDE2 shows peaks similar to that of the b-disk with (La, Lb, Lc) ∼ (0.29, 0.46, 0.25) (ra:rb:rc ∼ 0.9:0.6:1). As mentioned above, the spectrum with predominance of a specific shape should show sharper peaks compared to the CDE and the CDE2, and we thus conclude that the dominant crystallographically anisotropic shape of forsterite can be distinguished from the infrared features in this complex.
The 25 μm complex. Nine optical resonances are present in the wavelength range of 20–30 μm (Figure 5(a)). However, in the wavelength range of 20–26 μm, the strong peaks of Cabsa and Cabsc appear at similar wavelengths and the peaks of Cabsb are not strong. These resonances are thus not useful to distinguish the crystallographically anisotropic shape. The only characteristic feature in the 25 μm complex is the peak for Cabsb between 26.5 and 28.4 μm (Figure 5(b); Table 2), which appears at 26.5, 26.7, and 28.4 μm for Lb = 1, 1/3, and 0, respectively. Because the peak appears clearly in the MAC only for Lb < 1/3 (b-needle, a-disk, and c-disk), the contribution of the b-axis dimension to the grain shape could be determined based on the presence of a peak at 26.7–28.4 μm (Figure 5(b); Table 2). The extreme shape with La ∼ 1 might also be distinguished by the presence of a peak at ∼26 μm although the predominance of such an extreme shape seems to be unlikely.
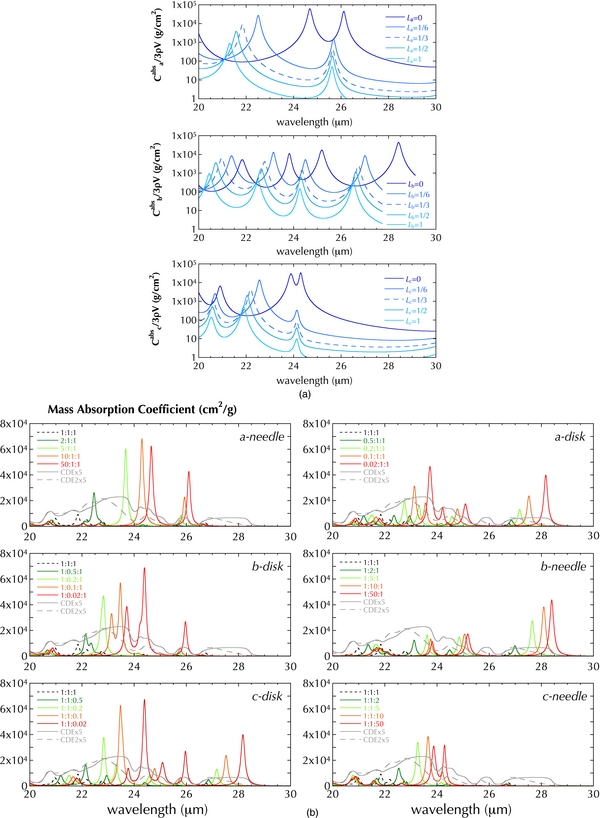
Figure 5. (a) Absorption cross sections per unit mass along the a-, b-, and c-axes for La, Lb, and Lc = 0, 1/6, 1/3, 1/2, and 1, calculated with the optical constants of 100 K (Suto et al. 2006), in the wavelength ranges of 20–30 μm. (b) Mass absorption coefficients (MACs) of ellipsoidal forsterite (a-, b-, and c-needles and a-, b-, and c-disks) with various aspect ratios (ra:rb:rc) at wavelengths of 20–30 μm with the MACs for spherical forsterite and the CDE/CDE2.
Download figure:
Standard image High-resolution imageThe 33 μm complex. Five optical resonances are present in this complex. No diagnostic features are present to distinguish all the six types of shapes in this complex because there are no strong resonances along the a-axis and two resonances along the b- and c-axes exist in a similar wavelength range (34.2–34.4 μm).
The 69 μm complex. The 69 μm feature is a single peak reflecting an optical mode along the b-axis (Figures 7(a) and (b); Table 2). A clear 69 μm peak appears only for the shape with Lb < 1/3 (a-disk, b-needle, and c-disk), and the peak position shifts toward longer wavelengths with increasing the degree of contribution from the b-axis, i.e., decreasing Lb (Figure 7(b)). The peak shifts from 68.8 to 69.1 μm with decreasing Lb. The peak position of the 69 μm feature has been known as an indicator of temperature of circumstellar forsterite because peaks at far-infrared wavelengths are largely affected by temperature, but the present results show that the crystallographically anisotropic shape also affects the peak position.
5. EFFECTS OF DUST TEMPERATURE, SIZE, COMPOSITION, AND EDGES
The infrared features of forsterite reflect the crystallographically anisotropic shape in the wide range of wavelengths from 9 to 70 μm. However, peak features are also dependent of dust temperature, size, chemical composition, and grain edges. In this section, we discuss the effects of these factors on infrared features and their distinguishabilities from the features caused by crystallographically anisotropic shapes.
The MACs of forsterite calculated with the optical constants at 100 K (Suto et al. 2006) are shown in Figures 3–7, but peak positions shift to longer wavelengths at higher temperatures (Koike et al. 2006). When we use the optical constants measured at 50–295 K (Suto et al. 2006), the shifts of peak positions due to temperature change are larger for peaks at longer wavelengths; peak wavelengths of the CDE model shift by <0.1 μm in the 10 and 18 μm complex, ∼0.3 μm in the 25 and 33 μm complex, and ∼0.7 μm in the 69 μm complex.
Grain size affects both peak positions and intensities. When the size changes from 0.1 to 1.0 μm, peak wavelengths of 10.1 and 11.3 μm shift to 10.2 and 11.5 μm, respectively, but peaks at longer wavelengths are not largely affected (Min et al. 2003).
Peak intensities also change with the grain size, and they decrease with increasing size of grains, e.g., the intensity of the 11.3 μm peak of 4 μm sized forsterite grains is ∼1/5 of that for 0.1 μm sized grains.
The Mg/(Mg+Fe) ratio has influences on the positions and intensities of peaks particularly at longer wavelengths. Peak wavelengths of irregularly shaped olivine measured in laboratory tend to shift toward longer sides with decreasing the Mg/(Mg+Fe) from 1 (forsterite) to 0 (fayalite; Koike et al. 2003). Peaks of forsterite grains at 10.1, 11.2, and 11.9 μm appear at 10.6, 11.4, and 12.1 μm, respectively, for fayalite (Fe2SiO4) in the 10 μm complex. If the addition of Fe to forsterite is limited (Mg/(Mg+Fe) > 0.9), it has little effects on peak positions in the 10 μm complex and peaks in the 18 μm complex shifts to longer sides by <1 μm. For the peaks at longer wavelengths (25, 33, and 69 μm complexes), a small content of iron in the lattice structure shifts peak positions significantly to longer sides without broadening the peaks (Koike et al. 2006; Suto et al. 2006; de Vries et al. 2011). Combination of multiple peak positions in the 33 and 69 μm complexes can be used to evaluate the grain shape effect separately from the composition and temperature effects (Figures 5 and 6). However, the features in the 33 and 69 μm complexes are required to be emitted from the same dust component, and they may not be as useful as the features at shorter wavelengths to deduce the grain shape.
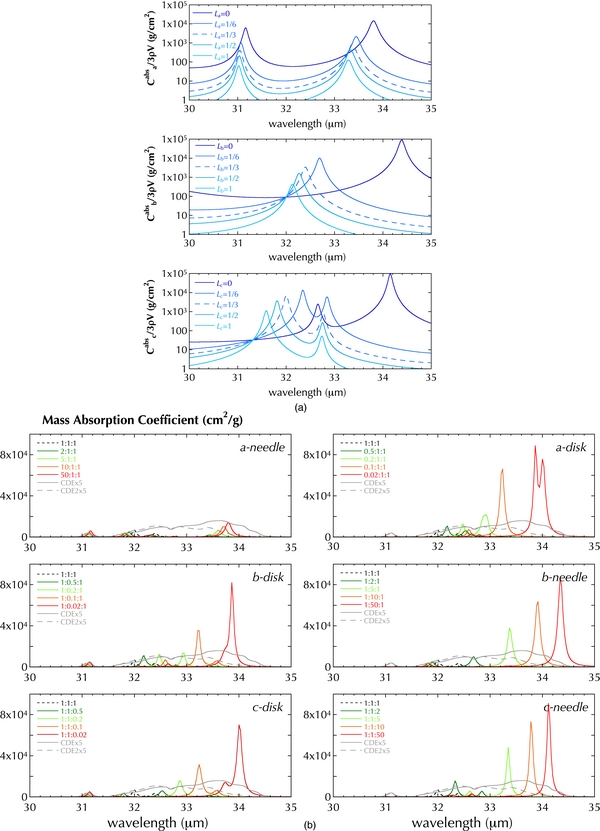
Figure 6. (a) Absorption cross sections per unit mass along the a-, b-, and c-axes for La, Lb, and Lc = 0, 1/6, 1/3, 1/2, and 1, calculated with the optical constants of 100 K (Suto et al. 2006), in the wavelength ranges of 26–35 μm. (b) Mass absorption coefficients (MACs) of ellipsoidal forsterite (a-, b-, and c-needles and a-, b-, and c-disks) with various aspect ratios (ra:rb:rc) at wavelengths of 26–35 μm with the MACs for spherical forsterite and the CDE/CDE2.
Download figure:
Standard image High-resolution image
Figure 7. (a) Absorption cross sections per unit mass along the a-, b-, and c-axes for La, Lb, and Lc = 0, 1/6, 1/3, 1/2, and 1, calculated with the optical constants of 100 K (Suto et al. 2006), in the wavelength ranges of 68–70 μm. (b) Mass absorption coefficients (MACs) of ellipsoidal forsterite (a-, b-, and c-needles and a-, b-, and c-disks) with various aspect ratios (ra:rb:rc) at wavelengths of 68–70 μm with the MACs for spherical forsterite and the CDE/CDE2.
Download figure:
Standard image High-resolution imageThe presence of the crystal surfaces and edges results in the increase of surface modes. For instance, cubic-shaped optically isotropic grains have six strong surface modes for one optical resonance (Fuchs 1975), while ellipsoidal-shaped grains have three surface modes for the resonance. Figure 8 shows the MACs of forsterite parallelepipeds with various aspect ratios calculated with DDA (Draine & Flatau 1994, 2010) using the optical constant at 100 K by Suto et al. (2006). Cubic forsterite shows peaks at 9.7, 10.6, and 10.8 μm, which also appear for spherical forsterite. Another strong peak appears at 11.0 μm, which is inconsistent with the spectrum of spherical forsterite. However, when the aspect ratios of parallelepipeds increase, the 11 μm feature becomes smaller and the peak features of ellipsoids and parallelepipeds look similar to each other. The euhedral forsterite has crystal faces more than six, so that the edge effect should be less than that shown in Figure 8 although the number of weak (and unobservable) surface mode resonances may increase. Therefore, crystallographically anisotropic shapes are distinguishable for grains with edges as well and that the ellipsoidal approximation is reasonable to evaluate the crystallographically anisotropic shapes of forsterite dust.

Figure 8. Mass absorption coefficients (MACs) of rectangular forsterite calculated with DDA at wavelengths of 9–12 μm. A dotted curve represents a spectrum of cubic grains, and solid curves show those for rectangular grains with various aspect ratios (ra:rb:rc). The optical constants at 100 K (Suto et al. 2006) were used for the calculation.
Download figure:
Standard image High-resolution imageTemperature, size, chemical composition, and crystal edges have clear effects on infrared features. However, the crystallographically anisotropic shapes of forsterite can be deduced separately from these effects in the 10 and 18 μm complexes because: (1) the peak positions are insensitive to temperature in these complexes and thus the grain shapes can be deduced from a spectrum even if circumstellar forsterite has some temperature distribution; (2) the peaks shifts due to the compositional effect are only in one direction, and are limited as long as the iron content is limited as observed in circumstellar forsterite (Mg/(Mg+Fe) > 0.9); (3) the grain size effect, which is larger in these complexes than that for longer wavelengths, is insignificant as long as the grains are smaller than 1 μm even if the grain size is beyond the Rayleigh limit and it also shifts peaks in one direction; (4) grain edges have little effects on shifts of peaks except for almost spherical shapes.
The compositional effect is not negligibly small in the 25 μm complex, but features in this complex can also be used to evaluate the predominance of the b-axis-dominant shapes (b-needle, a-disk, and c-disk) because the peaks shift unidirectionally with similar degrees by the compositional effect and the presence of a single peak at >27 μm is the criteria for judgment. Because there is only one peak in the 69 μm complex, it is not simple to separate the effect of crystallographically anisotropic shapes from other effects, particularly temperature and compositional effects.
In summary, infrared features of forsterite with crystallographically anisotropic shapes can be separated from the effects of temperature, size, composition, and grain edges in a wide range of wavelengths.
6. CRYSTALLOGRAPHICALLY ANISOTROPIC SHAPE AND DUST-FORMING CONDITIONS
The crystallographically anisotropic shape of forsterite is not arbitrary in a mineralogical point of view because it reflects physical and chemical conditions of dust formation and subsequent evolution. The processes potentially responsible for the change of the crystallographic anisotropic shape of forsterite are condensation of solid from vapor, evaporation of solid, and crystallization of amorphous, of which anisotropy is likely to depend on temperature, pressure, and gas composition. It has been well known that forsterite evaporates anisotropically to change the crystallographically anisotropic shape and anisotropy in evaporation depends on temperature and hydrogen gas pressure (Ozawa et al. 1996; Yamada et al. 2006; Takigawa et al. 2009). The changes of the crystallographically anisotropic shape of forsterite (rb/ra and rc/ra) by evaporation from a sphere under various conditions (Takigawa et al. 2009) are shown in Figure 9. The typical crystallographically anisotropic shapes of forsterite formed by evaporation from a sphere are b-needle or c-disk at >1900 K, c-disk at ∼1800 K, c-disk or a-needle at ∼1600 K, and b-disk at <1420 K (Figure 9). Because details of anisotropic growth rates of forsterite have not yet been precisely determined, we assume the needle-like forsterite elongated to the c-axis as condensed forsterite based on the condensation experiments of forsterite on metallic substrates in hydrogen gas of 1 Pa at >1300 K (Tsuchiyama 1998).
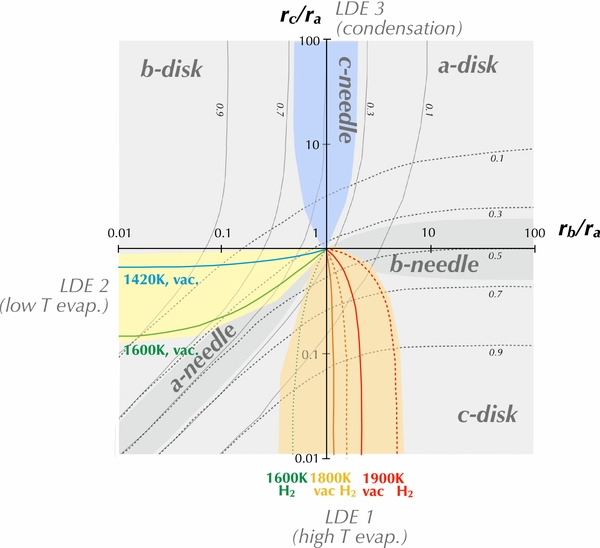
Figure 9. Changes of aspect ratios of ellipsoidal forsterite grains by evaporation of forsterite spheres at various temperatures and hydrogen pressures (thick solid, dashed, and dotted curves; Takigawa et al. 2009), superimposed on the classification diagram of crystallographically anisotropic shapes. The shapes within the orange- and yellow-shaded regions are the LDE1 and the LDE2 representing the shapes formed by evaporation at >1600 K and at <1600 K, respectively. The entire range of c-needle (shown in blue) is the LDE3 for the possible shapes of condensed forsterite (Tsuchiyama 1998).
Download figure:
Standard image High-resolution imageWe discussed the infrared features of forsterite grains with a single shape, which show narrow peaks as seen in Figures 3–8. However, some degree of variations in aspect ratios of grains is expected through different degrees of anisotropic evaporation or condensation in circumstellar environments, which result in broader peaks for the ensemble of the grains. In order to discuss the infrared features for crystallographically anisotropic shapes as a potential probe to estimate the circumstellar dust-forming conditions, we consider the infrared features of different ensembles of grain shapes (LDE: limited distribution of ellipsoids) formed by evaporation at >1600 K (LDE1), evaporation at <1600 K (LDE2), and condensation (LDE3; Figure 9). We assume that the shapes within the range of aspect ratios for each ensemble appear with equal probability to calculate the infrared spectrum. Note that if all the shapes in Figure 9 appear with equal probability, the MAC for that ensemble should be that for the CDE.
Figure 10 compares the MACs of each ensemble and the CDE at 100 K. As most of grains in the LDE1 belong to c-disk, their MAC shows peaks at 9.7–10.2, 10.2–10.6, 10.8–11.5, and 11.9 μm. The MAC of the LDE2 shows peaks at 9.7–10.2, 10.2–10.6, and 10.6–10.8 μm. It shows no clear peak at 10.8–11.5 μm although grains in the LDE2 belong mostly to b-disk. The peak at 10.8–11.5 μm is attributed to Cc for Lc < 0.25 (see Section 4; Figure 3(a)); but the shapes with Lc < 0.25 occupy a small fraction of the LDE2. Therefore, the contribution from the shapes with Lc <0.25 appears only as a tail of the peak at 10.6–10.8 μm (Figure 9), which is the same as in the case of nearly spherical spheroidal b-disk (Table 2). The MAC of the LDE3, which covers the entire region of c-needle ((La, Lb, Lc) = (>1/3, >1/3, <1/3); Figure 9), shows peaks at 9.2–9.7, 10.6–10.8, 10.8–11.5, and 11.9 μm and no peak at 9.7–10.2 and 10.2–10.6 μm. The infrared features of the three ensembles are basically consistent with the classification described in Section 4 and Table 2, and can thus be distinguished from each other.

Figure 10. MACs of the CDE model and the LDE1, LDE2, and LDE3 in Figure 9 (100 K).
Download figure:
Standard image High-resolution imageThe above discussion indicates that the dust-forming conditions can be evaluated from infrared spectra even for grains having a variation of crystallographically anisotropic shape. Another factor we should consider to link the infrared features to the dust-forming conditions is that most of infrared observations do not resolve stars and their dusty envelopes are observed as point sources. Especially, the dust-forming region or the region where dust particles are thermally altered is spatially limited, so that it cannot be resolved with large telescopes such as the VLTI or Subaru. We thus need to evaluate how the mixing of different ensembles of grains with different ranges of shape distributions affects the infrared spectra. Here we show the composite spectra of a grain ensemble with the dominance of a specific crystallographically anisotropic shape (LDE1, LDE2, or LDE3 in Figure 9) and the CDE with different mixing ratios (Figure 11). It is clearly seen that the composite spectrum is different from the spectrum of CDE if the fraction of each LDE is higher than a few tens of a percent.
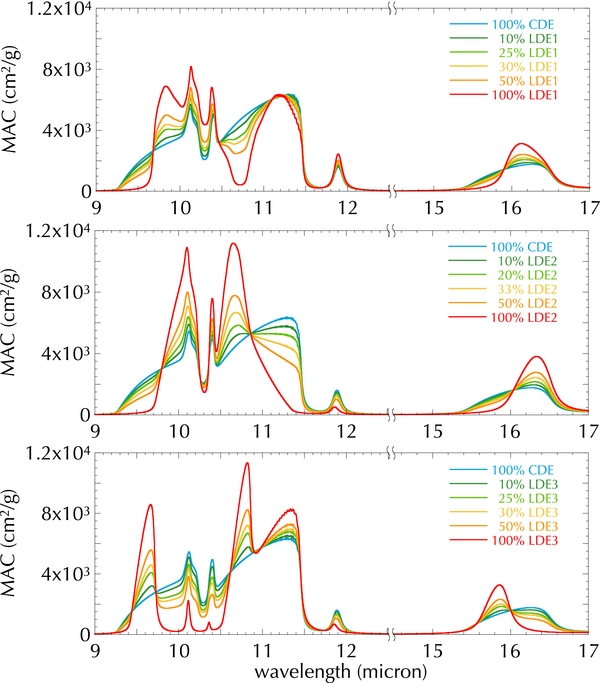
Figure 11. Composite MACs of forsterite of the CDE model and the LDE1 (top), the LDE2 (middle), and the LDE3 (bottom) with different mixing ratios (100 K).
Download figure:
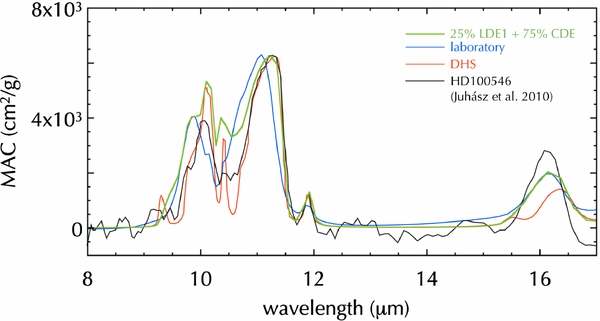
Standard image High-resolution imageWe therefore conclude that the dust-forming or dust-evolving conditions of forsterite (condensation and evaporation under different temperature conditions) can be evaluated from infrared observations as long as a certain fraction of forsterite particles with a dominant crystallographically anisotropic shape are present (more than a few tens of a percent) among the entire forsterite grains. We finally apply the present result to the observed spectrum of a protoplanetary disk HD100546 (Malfait et al. 1998; Juhász et al. 2010). Juhász et al. (2010) compared the spectra of forsterite derived from the Spitzer Infrared Spectrograph spectrum of HD100546, which is the protoplanetary disk showing strong features of crystalline forsterite in the 10 μm band, with the calculated spectrum of DHS forsterite (the distribution of hollow spheres; Min et al. 2003) and the absorption spectrum of forsterite measured in laboratory with the aerosol technique (Tamanai et al. 2006). However, the observed 16.1 μm peak could not be reproduced by the DHS model, which shows similar band profiles to the CDE model with some exceptions. The laboratory spectrum, which is well produced by the CDE2 model, shows a peak at ∼16 μm, but could not reproduce peak positions observed at 10.1 and 11.3 μm.
We found that the composite spectrum of CDE and the LDE1 with the mixing ratio of 3:1 reproduces the peak wavelengths at 10.1, 11.3, and 16.1 μm better than the DHS and the laboratory measurement (Figure 12). We note that the wavelength resolution of the composite spectrum in Figure 12 was reduced to be ∼0.1 μm to compare with the observed spectrum by Spitzer/IRC, of which spectral resolution was ∼0.1 μm in the 10 μm band. Moreover, the band shapes of the peaks at 11.3 and 16.1 μm in the composite spectrum reproduce the observation better than the DHS, the laboratory spectrum, and the CDE alone. The modeled peaks at 10.1 and 11.3 μm are, however, stronger than the observed peaks, which is also the cases for the DHS, the laboratory spectrum, and the CDE. This might be due to the overestimation of amorphous silicate and too much subtraction of its spectrum, which shows a broad peak centered at ∼10 μm, from the original. We here note that the grain size effect is not significant as long as the typical size of larger grains is ∼1–2 μm (Bouwman et al. 2001, 2003; van Boekel et al. 2005).
Figure 12. Comparison of the MAC of forsterite of the composite spectrum of 75% of CDE and 25% of the LDE1 (100 K) with that derived from the spectrum of HD100546 observed by Spitzer (Juhász et al. 2010). The spectral resolution of the composite spectrum is reduced to be ∼0.1 μm to match to the Spitzer observation. The calculated DHS spectrum and the laboratory spectrum are also shown (after Juhász et al. 2010). The vertical axis is arbitrary.
Download figure:
Standard image High-resolution image
We therefore propose that a certain fraction of forsterite dust in HD100546 experienced high-temperature evaporation processes most likely in the inner region of the disk. Rapid transient heating events such as formation of chondrules, the major constituents of primitive meteorites, could be responsible for the high-temperature evaporation of forsterite in the disk. The partially evaporated dust particles may have mixed with grains that did not experience such high-temperature events due to radial mixing of materials in the disk (e.g., Dullemond et al. 2006; Ciesla 2007).
Further experimental works for condensation are clearly needed in order to evaluate the dust-forming conditions quantitatively, but we conclude that the crystallographically anisotropic shape of forsterite deduced from infrared features leads us to understand thermal events that crystalline forsterite experienced in circumstellar environments.
7. SUMMARY AND CONCLUSIONS
The crystallographically anisotropic shape is a specific crystal shape with a specific relationship to crystallographic orientations, which changes with dust formation and/or subsequent evolution conditions reflecting the anisotropic nature of crystals. An emission spectrum from dust grains depends on their crystallographically anisotropic shapes because different crystallographically anisotropic shapes yield different wavelengths of surface mode resonances and their different degrees of activation. The crystallographically anisotropic shape can thus be used to estimate circumstellar dust-forming conditions quantitatively. In order to relate the crystallographically anisotropic shape with the mid-infrared features, we calculated MACs for spheroidal forsterite particles, the most abundant crystalline silicate in space, with various aspect ratios. We found that the crystallographically anisotropic shape of forsterite can be estimated from infrared features.
- 1.The 10 μm complex. Discrete and/or relatively strong optical resonances along each crystallographic axis exist in the 10 μm complex, and the peak wavelengths and intensities of the surface mode resonances show clear changes with the crystallographically anisotropic shape. The temperature of dust particles also changes the peak wavelengths, but the wavelength shift occurs only in one direction with a limited range in these complexes. The composition (substitution of Fe for Mg) has little effect on peak positions if the iron content is limited as observed in circumstellar forsterite (Mg/(Mg + Fe) > 0.9). The effect of grain size larger than the Rayleigh limit is insignificant as long as the grains are ∼1 μm in size, which is a typical size of larger grains observed in protoplanetary disks, and it also shifts peaks in one direction. We also showed that grain edges have little effect on shifts of peaks except for almost spherical shapes. Therefore, the infrared features in the 10 μm complex can be used as an indicator of the crystallographically anisotropic shape of forsterite.
- 2.The 18 μm complex. The features in the 18 μm complex can also be used to evaluate the crystallographically anisotropic shape of forsterite because characteristic variations of peak features are expected for various crystallographically anisotropic shapes. Note that the shape determination based on the features in the 18 μm complex may be more complicated than that based on the 10 μm features because not only the peak positions but the relative peak intensities should also be used for the shape determination.
- 3.The 25 μm complex. The only diagnostic feature in the 25 μm complex is the contribution of the crystallographic b-axis although the compositional effect is not negligible; the shapes with the longer dimension along the b-axis (b-needle, a-disk, and c-disk) have a peak at >27 μm and can be distinguished from those with the shorter dimension along the b-axis (b-disk, a-needle, and c-needle). There are also many resonances in the range of 20–26 μm, but their interactions for different crystallographically anisotropic shapes are too complicated to be used as the shape indicator.
- 4.The 33 μm complex. There are limited numbers of resonances in the 33 μm complex, where resonances along the a-axis are very weak and strong resonances along the b- and c-axes appear at similar wavelengths. The MAC in the 33 μm complex thus does not have diagnostic features to determine the crystallographically anisotropic shape.
- 5.The 69 μm complex. For the 69 μm feature that is attributed to the resonance along the b-axis, the peak shift by the crystallographically anisotropic shape is comparable to that caused by varying dust temperature of 100 K.
- 6.The comparison of infrared features of grain ensembles with shape distributions expected for various degrees of anisotropic evaporation at different temperatures and of condensation shows that the infrared features of the crystallographically anisotropic shape are distinguishable even when forsterite dust has a certain range of shape variations. Moreover, it is shown that the presence of such a grain ensemble can be detected even if the ensemble is mixed with the CDE spectrum as long as the fraction of the ensemble is higher than a few tens of a percent.
These findings strongly suggest that the dust-forming conditions (evaporation and/or condensation) can be evaluated from the infrared spectra of forsterite. The application of the present results to the infrared spectrum of forsterite in a protoplanetary disk HD100546 shows that the composite spectrum of the CDE (75%) and the ensemble of grains experienced high-temperature evaporation (>1600 K) (25%) well reproduces the observed spectrum. The presence of forsterite dust experienced high-temperature evaporation in the protoplanetary disk may indicate the radial outward transport of high-temperature inner-disk materials in the disk.
The crystallographically anisotropic shape of forsterite will be a new powerful probe for astromineralogy to link the infrared observations to dust formation conditions around stars via anisotropy in dust formation processes. Finally, we emphasize that the crystallographically anisotropic shape of other crystalline dust species can also be evaluated from the infrared spectra. Combining the crystallographically anisotropic shapes of various minerals and their anisotropic properties of formation processes will enable us to evaluate dust formation histories from infrared spectra in more detail. Anisotropic nature of minerals provides us in-depth scope for astromineralogy.
We are grateful to the anonymous reviewer for a careful reading of the manuscript and helpful comments and to Eric D. Feigelson for editorial handling. We thank Hiroko Nagahara for her valuable comments. We also thank Hisato Sogawa for his code for calculation of infrared spectra. The DDSCAT numerical code was kindly provided by Bruce T. Draine. This work was supported by Grant-in-Aid for JSPS Fellows (09J02084) (A.T.) and Grant-in-Aids for Young Scientists (A) (20684025) (S.T.).