


ABSTRACT
We present observations of a metric type II solar radio burst that occurred on the 3rd of November 2010 in association with an erupting plasmoid. The eruption was well observed by the Atmospheric Imaging Assembly (AIA) on board the Solar Dynamics Observatory and the Reuven Ramaty High Energy Solar Spectroscopic Imager, while the burst occurred in the frequency range of the Nançay Radioheliograph (NRH). Such events, where the type II emission occurs in the NRH frequency range, allowing us to image the burst, are infrequent. Combining these data sets, we find that the type II is located ahead of the hot (∼11 MK) core of the plasmoid, which is surrounded by a well-defined envelope of cool (few MK) plasma. Using two methods, we determine the propagation velocity of the shock: (1) fitting the type II emission observed in PHOENIX and HUMAIN radio spectrogram data; (2) direct imaging of the type II source location using NRH observations. We use LASCO C2 polarized brightness images to normalize our coronal density model. However, we find that information from imaging is required in order to fine-tune this normalization. We determine a shock propagation velocity between 1900 km s−1 and 2000 km s−1. This is faster than the plasmoid observed at extreme-ultraviolet wavelengths by AIA (v = 670–1440 km s−1, where the cooler plasma propagates faster than the hot core). The positioning of the type II, ahead of the plasmoid, suggests that the electrons are accelerated in a piston-driven shock.
Export citation and abstract BibTeX RIS
1. INTRODUCTION
Solar type II radio bursts are defined as slow drifting features in radio spectrogram data (e.g., Cairns et al. 2003). Thought to be caused by plasma radiation from shock-accelerated electrons, the burst is often observed as two bands of emission at the local plasma frequency (νp) and its harmonic. At coronal heights the bursts appear in the metric range with typical frequencies of 20–400 MHz, while their interplanetary counterparts are seen in the kHz range. At interplanetary distances it is generally accepted that these electrons are accelerated in the foreshock of propagating coronal mass ejections (CMEs; Bale et al. 1999). However, for coronal bursts there are competing theories for how the shock is produced: (1) a flare-related blast wave caused by a sudden energy release or pressure pulse (e.g., Vršnak & Lulić 2000; Vršnak 2001; Vršnak et al. 2006); (2) a CME or smaller scale ejecta such as a plasmoid, propagating at speeds greater than the local Alfvén speed. In this scenario, the shock is driven by the CME, which provides a continuous source of energy. Two possibilities exist for CME-driven shocks, piston-driven or bow shock (see Vršnak 2005). For a piston-driven shock, the ambient plasma is unable to flow behind the driver. The shock moves faster than the driver, thus increasing the standoff distance between the two. For a bow shock, the ambient plasma can flow around the driver, such as in the interaction between the solar wind and Earth's magnetosphere. The shock is situated at the forehead of the driver, meaning that both shock and driver propagate with the same velocity. The standoff distance in this case is determined by the driver's speed, size, and shape. It is possible that a shock may be initially driven by the motion of ejected plasma but can become decoupled and continue to propagate freely, as we would expect in the blast wave scenario. Since the acceleration phase of an erupting CME is coincident with the impulsive phase of the flare (Zhang et al. 2001; Temmer et al. 2008; Raftery et al. 2010), it is often difficult to distinguish between these two theories. Until the launch of the Sun Earth Connection Coronal and Heliospheric Investigation (SECCHI; Howard et al. 2008) on board the Solar Terrestrial Relations Observatory (STEREO), contiguous observations to follow the evolution of these events from the low to high corona were not available.
There is a well-established relation between type II bursts and EIT waves, i.e., large-scale propagating wavefronts first observed by the EUV Imaging Telescope (EIT; Delaboudinière et al. 1995) on board the Solar and Heliospheric Observatory (Dere et al. 1997; Thompson et al. 1998). In a study of 20 events, Klassen et al. (2000) showed that 90% of type II bursts were associated with EIT waves. Uchida (1968) first suggested that for events where the wavefront has an associated Moreton wave, both phenomena can be explained by a single underlying physical process. A recent study by Warmuth (2010) showed this to be possible. Veronig et al. (2010) presented observations of a large-scale, three-dimensional expanding extreme-ultraviolet (EUV) wavedome. The dome appears ahead of the CME front, seen at EUV wavelengths, and has characteristics consistent with a fast-mode MHD wave. An associated type II burst indicates the occurrence of a shock in the low corona, at a similar height to that of the wavedome. Kozarev et al. (2011) present two similar events that show an EUV wavefront ahead of an EUV bubble, considered to be the CME front (Patsourakos et al. 2010). For one event the height–time plots of the EUV wavefront agree with values found for the associated type II. However, without radio imaging and/or an accurate knowledge of the coronal electron density gradient, it is not clear how the EUV wavefront and the coronal shock, which produces the type II, are related. Coronal type II bursts occurring at the highest frequencies of a few 100 MHz in the observing range of the Nançay Radioheliograph (NRH; Kerdraon & Delouis 1997) are infrequent. Dauphin et al. (2006) and Vršnak et al. (2006) presented observations of such an event. From NRH images the radio source position was found ahead of a rising soft X-ray loop. Dauphin et al. (2006) suggest that the shock is caused by the propagation of an associated CME, while Vršnak et al. (2006) argue in favor of the type II shock being generated by wave propagation.
In this paper, we present observations of a coronal type II radio burst associated with an erupting plasmoid. The event was well observed by the Atmospheric Imaging Assembly (AIA; Lemen et al. 2011) on board the Solar Dynamics Observatory, and the burst occurred in the frequency range of NRH. We were able to determine the velocity of the propagating shock that produces the type II using two methods: (1) by fitting the frequency drift of the type II burst observed in radio spectrogram data; (2) using source positions identified from NRH images. In particular, we used LASCO C2 polarized brightness (pB) images to select and normalize an appropriate coronal density model. We found that while this gave a good initial estimate of the normalization required for the model, images of the source position were required to fine-tune this value.
In Section 2, we present an overview of the event. In Section 3, we describe the method used to determine the shock velocity using the radio spectrogram data and how the LASCO pB images were used to normalize our density model. In Section 4, we describe how NRH images were used to fine-tune this result. In Section 5, we discuss the association between the erupting plasmoid and the type II radio burst.
2. OBSERVATIONAL OVERVIEW
The event occurred on the 3rd of November 2010 and was associated with a GOES C4.9 flare. Figure 1 shows (top to bottom) GOES, RHESSI (Lin et al. 2002), PHOENIX (Benz et al. 1991), and HUMAIN time profiles. The GOES soft X-ray peak occurred at 12:20, while RHESSI shows a hard X-ray peak at 12:14. PHOENIX (175–600 MHz) and HUMAIN (45–175 MHz) spectrogram data show a type II radio burst between 12:15 and 12:18.
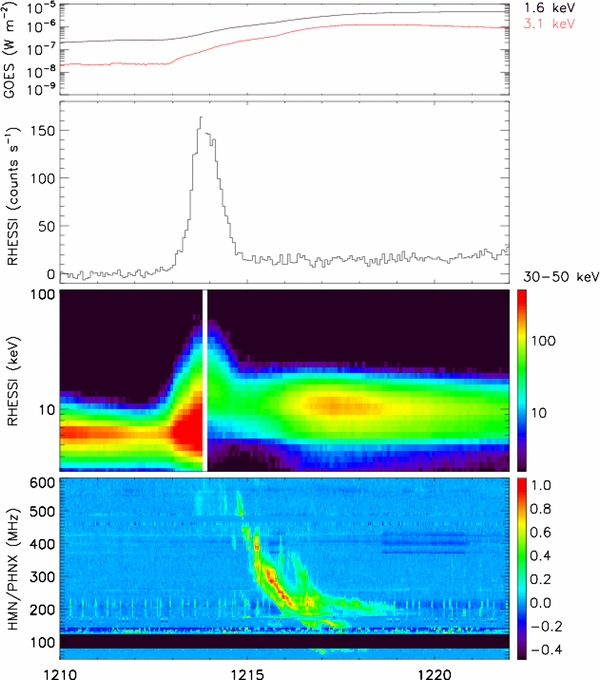
Figure 1. Plots show (top to bottom) GOES and RHESSI 30–50 keV light curves and RHESSI (3–100 keV) and PHOENIX/HUMAIN (45–600 MHz) spectrogram data. The white vertical band observed in the RHESSI spectrogram is the result of an attenuator state change.
Download figure:
Standard image High-resolution imageThe flare was occulted such that only the tips of the coronal flare loops were observed above the eastern limb. Using observations from the Extreme Ultraviolet Imager (EUVI) on board STEREO B, we estimate that the base of the flare was occulted by around 5 3–74. Figure 2 (top) shows the evolution of the plasmoid at 131 Å within the AIA field of view (FOV). The observed geometry of the erupting flux rope is similar to that expected in the classical eruptive flare model; this is discussed in more detail in Cheng et al. (2011) and Reeves & Golub (2011). In addition to this, Foullon et al. (2011) present observations of a magnetic Kelvin–Helmholtz instability occurring along the northern edge of the erupting plasma. At other AIA wavelengths, 335 Å (difference image Figure 2, bottom left), 211 Å, and 193 Å (difference image Figure 2, bottom center), we see an envelope of plasma surrounding the core. This is particularly noticeable in 335 Å difference images as a white envelope surrounding the dark void of the core. (For reference of how the structures observed at 131 Å and 335 Å relate to one another, see composite difference images in Figures 5 and 6 later.) The temperature response of the 131 Å passband has two main peaks at 0.4 MK and 11 MK (O'Dwyer et al. 2010; Boerner et al. 2012). The core of the plasmoid is not observed in the 335 Å and 211 Å AIA passbands, which are responsive to plasma well below 11 MK (typically plasma of a few MK during flares). This indicates that the observed emission results from the higher temperature, 11 MK component of the 131 Å passband (see Reeves & Golub 2011). This is confirmed through multi-wavelength filter analysis in a forthcoming paper (L. Glesener et al. 2012, in preparation). Figure 2 (bottom right) shows RHESSI 18–40 keV nonthermal image contours. Green shows a compact low coronal source (50%, 70%, and 90% contours) and red shows an extended high coronal source (0.41%, 0.54%, and 0.70% of compact source) obtained from the two-step CLEAN method (Krucker et al. 2011). The extended source contains nonthermal electrons, most likely accelerated in a reconnection event below the plasmoid (Hudson et al. 2001; Krucker et al. 2007). This will be discussed further in L. Glesener et al. (2012, in preparation), where the authors examine the spectral parameters of the nonthermal electrons in the extended source and consider their ability to provide the thermal energy of the plasma.
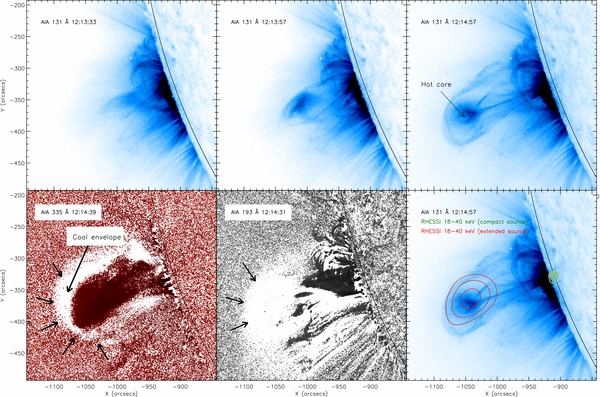
Figure 2. Top row: AIA 131 Å images showing evolution of erupting plasmoid, in particular the hot core. Bottom row (left and center): AIA 335 Å and 193 Å difference images. Arrows indicate the edge fitted in velocity estimates. Bottom right: RHESSI nonthermal 18–40 keV image contours. Green shows a compact source (50%, 70%, and 90% contours) and red shows an extended source (0.41%, 0.54%, and 0.70% of the compact source) obtained using the two-step CLEAN method.
Download figure:
Standard image High-resolution image3. TYPE II RADIO SPECTROGRAM FITTING
Figure 3 (top left) shows the type II burst from the combined PHOENIX and HUMAIN spectrogram data. NRH observing frequencies are indicated on the plot. The burst is observed at both the fundamental and harmonic of the local plasma frequency, where  and ne is the local electron density. The main burst emission occurs at the harmonic, while the fundamental branch, identified best in the inverse frequency plot, Figure 3 (top right), is only observed later in the event around 12:17 at 60–80 MHz. This could be a result of the occultation. Since the radio emission site is located behind the limb, for a radial density model, the emitted radiation potentially passes through a region of increased density as it propagates toward Earth. When the frequency of emission is less than the local plasma frequency, as is the case in these denser regions, the radiation becomes optically thick. The fundamental emission would therefore not be observed. However, the harmonic emission is able to propagate unimpeded. In addition, both branches show fine structure indicating more than one site of emission occurring in regions of varying density along the shock front or from different densities occurring up- and downstream of the propagating shock.
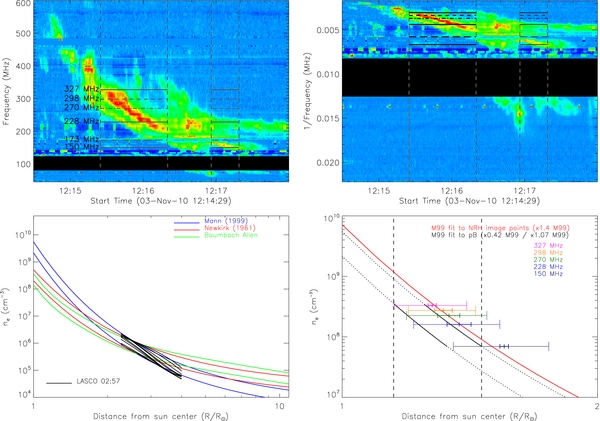
Figure 3. Top left: combined radio spectrogram from PHOENIX and HUMAIN. Top right: 1/frequency spectrogram. Vertical dashed lines show the time intervals used for the type II fit. NRH observing frequencies are indicated on the plot. Bottom left: profiles of ne determined from LASCO pB images for radial positions between 245° and 255° (black). Upper and lower limits for the M99 (blue), N61 (red), and BA (green) normalized coronal density models are plotted. Bottom right: solid black shows the M99 coronal density model used to fit the type II emission. Dotted black lines show the model extrapolated to other values of ne and R☉. Colored crosses show the observed type II radial position from NRH images. Thick (smaller) horizontal colored bars present the motion of the source during the type II time interval at each frequency. Thin (larger) bars show the source FWHM.
Download figure:
Standard image High-resolution imageThe frequency drift rate of the burst is related to the propagation speed of the shock, the gradient of the coronal electron density, and the angle of propagation with respect to the radial drop in ne. In order to determine the speed of the progenitor shock, a model for ne is required. Since a number of models exist, which can vary by a factor of two or three, we use pB images from LASCO C2 to normalize our model (Minnaert 1930; van de Hulst 1950; Gopalswamy & Yashiro 2011). Using this technique, we can separate the polarized K-corona, consisting of photospheric continuum scattered by free electrons, from the unpolarized F-corona resulting from photospheric emission scattered by dust. The polarized brightness depends only on the line-of-sight electron density. Although STEREO COR 1 and 2 have a much higher cadence of pB images (48 and 24 images per day, respectively) compared with the two images per day from LASCO, the eruption was observed as a halo CME from STEREO B, while STEREO A did not observe the CME until it was much farther out. Despite both LASCO C2 pB images being taken before the plasmoid reached the C2 FOV, at 02:57 and 08:57, the 08:57 image contains emission from a small eruption from the same active region that occurred several hours before our event and therefore was not used for this analysis. However, we note that although the ne profile at 08:57 was altered by the presence of the earlier CME, the resulting values of ne are within the range of those from 02:57 and would not significantly alter our normalization or choice of density model. We therefore assume that any density variations in the hours leading up to our event also lie within this range.
Using the solarsoft routine pb_inverter.pro, a number of position angles (245°–255°) around the plasmoid nose were selected. The resulting ne profiles are plotted in black in Figure 3 (bottom left). For some angles the routine failed due to artifacts in the image, e.g., cosmic-ray hits; these were removed. Above 4 R☉ the profile became constant and unphysical; therefore, we only consider points between 2.26 and 4 R☉. Assuming radial propagation, we obtained lower and upper normalization values of 0.42–1.07 for the Mann et al. (1999) (blue), 0.23–0.58 for the Newkirk (1961) (red), and 0.31–0.79 for the Baumbach–Allen (green) coronal density models, Figure 3 (bottom left). The Newkirk (1961, hereafter N61) model is considered to be a quiet-Sun model, derived from K-corona pB observations. The Baumbach–Allen (hereafter BA) model includes power-law contributions from the K-, L-, and F-corona. The Mann et al. (1999, hereafter M99) model is designed to model the atmosphere above an active region. The semi-empirical function in M99 is derived from MHD solutions in conjunction with in situ observations at 1 AU of the solar wind speed and electron number density. Typical densities and temperatures for the low corona were also used as constraints. From Figure 3 (bottom left) we find that the M99 model agrees best with the gradient of ne obtained from the pB images. Once normalized, we extrapolate the model to coronal heights for comparison with our observations.
To determine the propagation speed of the type II emission, points from the most prominent, higher frequency split-band of the harmonic branch were chosen using a threshold of 70% maximum intensity. Points were chosen between 12:15:24 to 12:16:20 and 12:16:56 to 12:17:18, indicated by vertical dashed lines in Figure 3 (top left and right). It is unclear if points outside of these intervals can be attributed to this band of the type II. In particular, we note that emission at 173 MHz is not part of the band of emission we use for our analysis. Furthermore, it is unclear whether the NRH 150 MHz channel catches the type II burst within the second time interval. Corresponding plots of ne and distance from Sun center, R, using the upper and lower normalization factors of M99, are shown in solid black in Figure 3 (bottom right). Dotted lines show the extrapolation to other values. Vertical dashed lines show the radial distance range over which the type II burst occurred based on this model. Colored crosses show the corresponding source positions obtained from direct imaging with NRH (discussed more later). We note that for the N61 and BA models, the resulting type II emission is estimated to occur below or very close to the photosphere, i.e., at 1 R☉. This is clearly incorrect and supports our choice in the M99 model. The corresponding height as a function of time is shown in Figure 4 (black) for both normalizations. Fitting a constant acceleration model h(t) = h0 + v0t + (1/2)at2, we find that v0 is in the range 1570–1860 km s−1 and a between −8 and − 9 km s−2.
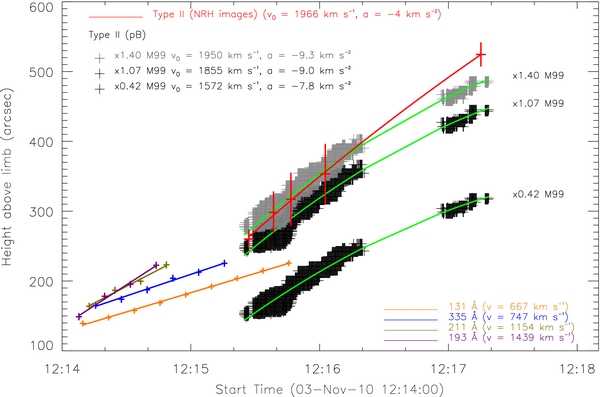
Figure 4. Plot shows height as a function of time for the erupting plasmoid leading edge as seen in AIA 131 Å (orange), 335 Å (blue), 211 Å (olive), and 194 Å (purple) passbands. Red shows the height of type II emission observed using NRH images. Also shown are estimated heights of the type II emission found from fitting the drift observed in spectrogram data with the M99 model. Black shows upper and lower limits on the M99 normalization obtained from pB images, and gray shows a normalization found using NRH images. Green trends show constant acceleration model fits to the spectrogram data. Values of velocity and acceleration for each fit are stated.
Download figure:
Standard image High-resolution image4. COMPARISON WITH NRH IMAGES
To check the accuracy of the type II velocity determined from spectrogram fitting, we use NRH images to locate the type II source position and determine the speed directly. Figure 5 shows an AIA 131 Å (blue) and 335 Å (red) composite difference image with NRH source positions overplotted. NRH source positions are shown for five frequencies, 228 MHz (top left), 270 MHZ (top right), 298 MHz (bottom left), 150 MHz, and 327 MHz (bottom right). The source positions were found by fitting an elliptical Gaussian to the high temporal resolution (0.25 s) data. Each plot shows the temporal evolution of the type II source position using colored crosses from blue (earliest) to yellow (latest). Note that since the type II appears in different frequencies at different times, the time range for each frequency varies slightly. The type II spatially precedes the erupting (hot) plasmoid material, and the source appears to move inward as time progresses. This is difficult to explain but could be attributed to propagation direction, a changing coronal density structure, or preferential emission site along the shock front, not to mention the effects of absorption, scattering, or refraction, which could alter the radio source centroid.
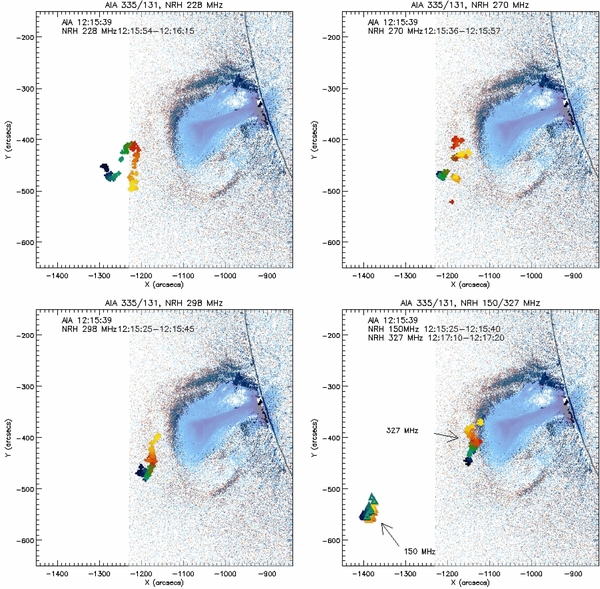
Figure 5. AIA 131 Å (blue) and 335 Å (red) composite difference image at 12:15:39. NRH source positions of type II emission at different frequencies, 228 MHz (top left), 270 MHz (top right), 270 MHz (bottom left), 150 MHz, and 327 MHz (bottom right). Temporal evolution is from blue to yellow.
Download figure:
Standard image High-resolution imageFor comparison with the spectrogram data, a mean radial distance was calculated for each frequency, weighted by the source flux. Colored crosses in Figure 3 (bottom right) show the NRH source positions. Thick (smaller) horizontal bars represent the motion of the source over the period of the burst, with thin (larger) horizontal lines indicating the source FWHM at each frequency. The NRH source height as a function of time is shown in Figure 4 (red). Vertical bars represent the motion of the source during the time intervals used in Figure 5. Fitting a constant acceleration model, we find v0 = 1966 km s−1 and a = − 4 km s−2 (for comparison, a constant velocity fit yields v ≈ 2000 km s−1). However, from Figures 3 (bottom right) and 4, we can see that the NRH sources lie at greater heights than found from fitting the spectrogram data. Figure 3 shows that our upper limit on the normalization lies close to the image positions. If we fit the NRH image points with the M99 model, we find a normalization of 1.4. Applying this normalization to the spectrogram points, we find that the calculated heights of the type II emission match those from imaging, gray trend in Figure 4. Fitting a constant acceleration model, as before, yields v0 = 1950 km s−1 and a = − 9.3 km s−2. v0 is now very close to the value obtained from the NRH image positions. The source motion observed in Figure 5, which places an uncertainty on the normalization factor of ±0.28, varies the velocity and acceleration, determined from NRH images, by roughly 4%. However, we note that while the first four NRH image positions, corresponding to 327, 298, 273, and 228 MHz points, lie close to the × 1.4 fit, the position of the 150 MHz source is around 25'' higher than the spectrogram points. It is therefore likely that the 150 MHz emission at this time is not associated with the band of type II emission used in our analysis.
Following the leading edge of the plasmoid at 131 Å, we find that the plasmoid erupts with a velocity of 670 km s−1. The envelope of cooler plasma, indicated by arrows in Figure 2, seen at 335 Å, 211 Å, and 193 Å, expands ahead of the plasmoid with velocities of 750 km s−1, 1150 km s−1, and 1440 km s−1, respectively; see Figure 4. The shock, outlined by the type II emission, therefore propagates much faster than the erupting plasmoid. This is consistent with the characteristics of a piston-driven shock.
5. SUMMARY
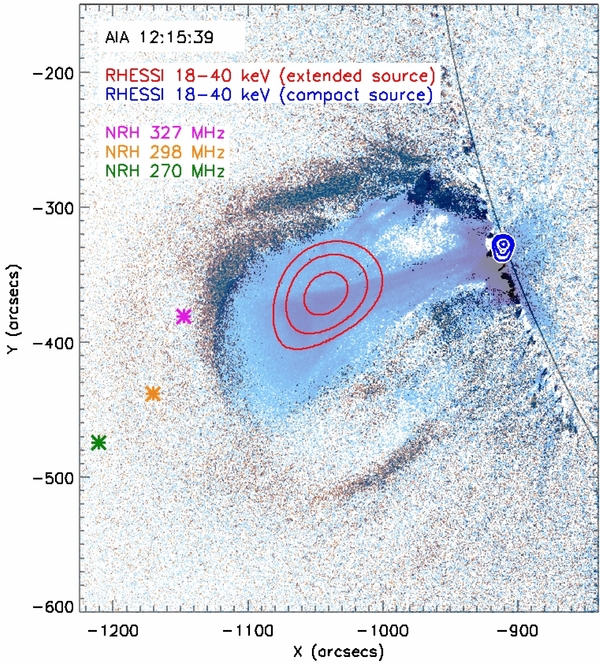
We have presented observations of a metric type II radio burst that occurred in association with an erupting plasmoid. Figure 6 gives a summary of the event at different wavelengths. The plotted NRH points correspond to type II emission at the time of the AIA image at 12:15:39. The burst is visible at 270 MHz (green), 298 MHz (orange), and 327 MHz (magenta) for this time. RHESSI contours show the X-ray emission at the earlier time of 12:14:51, just after the X-ray peak. We note therefore the slight displacement of the extended RHESSI source from the 131 Å plasmoid by around 45'' as a result of the plasmoid's propagation between these times. From NRH images, the burst was found to originate ahead of the hot core of the plasmoid. Using pB images from LACSO C2, we found the Mann et al. (1999) model to be the most appropriate coronal density model to use for fitting the type II. While the pB images produced an initial estimate of the normalization required for the model, to be consistent with observations, source positions from NRH images were required to fine-tune the normalization to a factor of 1.4.
Figure 6. Plot shows a summary of the different emissions. AIA 131 Å (blue) and 335 Å (red) composite difference image at 12:15:39. NRH type II source positions at 270 MHz (green), 298 MHz (orange), and 327 MHz (magenta) for time corresponding to the AIA image. RHESSI contours are plotted for just after the X-ray peak. Red contours show the extended source and blue contours show the compact source at 12:14:51.
Download figure:
Standard image High-resolution image
Fitting a constant acceleration model to the NRH source positions, we find that the shock that produced the type II propagates with the parameters h0 = 1.27 R☉, v0 = 1966 km s−1, and a = − 4 km s−2. From fits to the spectrogram data, we found h0 = 1.28 R☉, v0 = 1950 km s−1, and a = − 9.3 km s−2. The difference in the acceleration arises due to the greater height observed for the 150 MHz source in NRH images than from the spectrogram data. However, it is likely that the 150 MHz component is not associated with the band of type II emission used for fitting. A shock velocity of ∼1960 km s−1 is greater than the velocity of the propagating plasmoid observed at EUV wavelengths from AIA. The hot core observed at 131 Å was found to propagate with a velocity of 670 km s−1, while velocities between 750 and 1440 km s−1 were observed for the outer edge of the cooler envelope. It is not clear why the cooler envelope moves faster than the hot core.
Since the flare is occulted and the STEREO B EUVI images are badly saturated and lack sufficient cadence, it is not possible to investigate the flare-related energy release. Therefore, we cannot completely rule out the possibility that the shock is produced by a blast wave. However, the association of the type II burst with the erupting plasmoid, along with its location ahead of the hot core and the relative propagation velocities of the plasmoid and the type II emission site, is strongly indicative of a piston-driven shock.
This work was supported in part by the RHESSI project, NASA contract NAS598033. L.G. was partly supported by NASA GSRP grant NNX09AM40H. R.P.L. was partly supported by the WCU grant (No. R31-10016) funded by the Korean Ministry of Education, Science and Technology. The authors thank Nicole Vilmer, Ivan Zimovets, and the anonymous referee, whose comments helped improve the paper.